Belvidere Healthcare Center

Nursing Home in Lowell

CMS overall rating Info The Overall CMS Rating is scored from 1 to 5 stars and combines results from health inspections, staffing levels, and quality measures. Health inspections carry the most weight. Staffing and quality scores can increase or decrease the final rating based on performance compared to state and national standards.
Calculator: See prices in your area
Belvidere Healthcare Center accepts Medicare, Medicaid, and private pay.

Overview of Belvidere Healthcare Center

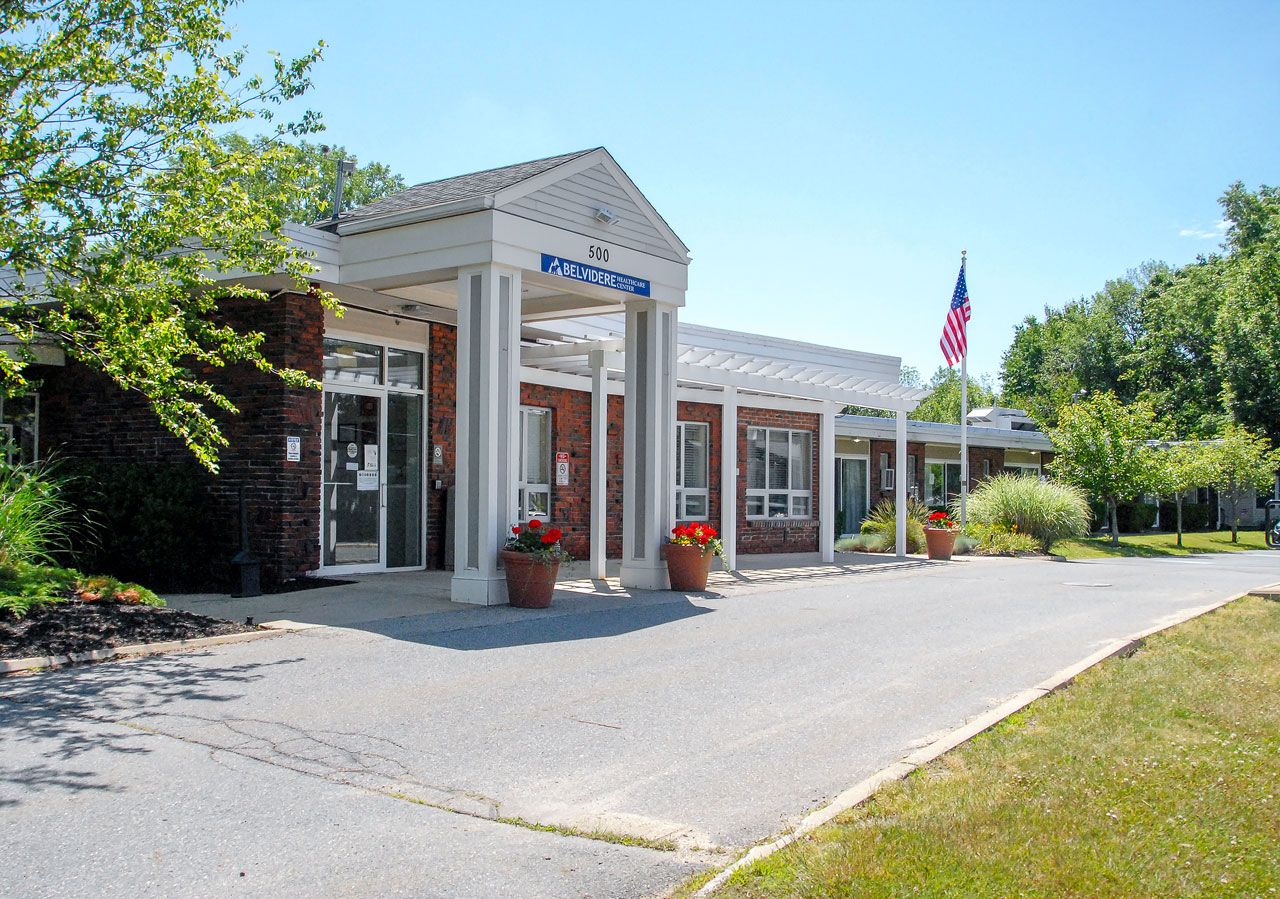
Belvidere Healthcare Center is one of Lowell’s trusted nursing homes. The home consists of professional staff committed to providing seniors with a safe and comfortable environment. With its professional approach, the nursing home aims to change the meaning of skilled nursing and rehabilitation for seniors through the exceptional care delivered by the compassionate staff. Belvidere successfully recreates the importance of recovery and has been more than welcome to have residents relax and recover.
The nursing home’s centers of excellence include short-term rehabilitation, long-term skilled nursing, and respite care. Its nursing includes stroke recovery, IV therapy, pain management, specialized therapy programs, and diabetic care.

(978) 458-1271

Quality ratings

Measured by Centers for Medicare & Medicaid Services (CMS)

Overall rating Info The Overall CMS Rating combines results from health inspections, staffing levels and quality measures. Health inspections carry the most weight. Staffing and quality scores can increase or decrease the final rating based on performance compared to state and national standards.
3/5 ▲ 0.1 Massachusetts average: 2.9/5
Health Inspection Info Based on the results of the facility's three most recent standard inspections and any complaint investigations. CMS reviews the number, scope, and severity of deficiencies, with more recent findings weighted more heavily.
3/5 ▲ 0.2 Massachusetts average: 2.8/5
Staffing Info Measures average nursing staff hours per resident per day, including Registered Nurses (RNs) and total nursing staff. Ratings are adjusted based on the level of care residents require and are compared to state and national benchmarks.
3/5 ■ Avg Massachusetts average: 3.0/5
Quality Measures Info Based on clinical and physical health indicators reported to CMS, such as hospital readmissions, falls, pressure ulcers, and improvements in mobility. These measures reflect how well residents' health needs are being managed.
3/5 ▼ 0.2 Massachusetts average: 3.2/5

Staffing hours breakdown

Info Daily nursing hours per resident by staff type, reported to CMS. Higher is generally better — compare this facility to state and national averages to see where staffing stands.

Hours per resident per day — compared to Massachusetts state averages

Total nursing care / resident Info This home is ranked 47th out of 58 homes in Massachusetts.

Total adjusted nursing hours per resident per day, combining RN, LPN, and aide time. CMS adjusts this for case-mix so facilities can be fairly compared.
3h 31m per day
Rank #47 / 58Nurse hours — state benchmarkedThis home is ranked 47th out of 58 homes in Massachusetts.Shows adjusted nurse hours per resident per day benchmarked to the Massachusetts average, with a ranking across 58 Massachusetts SNFs. More hours mean more direct care. The national average is about 3.5 hrs; below 3.0 is a red flag.
This facility Massachusetts avg (3h 56m per day)
vs Massachusetts avg
-11%

1 of 1 metrics below state avg

Staff type Hours / day vs state avg
Total Nursing (Weekend) Info Combined nursing hours (RN + LPN + Nurse Aide) per resident per day on weekends. Staffing often drops on weekends — this figure reveals whether the facility maintains adequate coverage outside of weekday hours. 3h 4m per day ▼ 11% State avg: 3h 27m per day · National avg: 3h 26m per day

Capacity and availability

This home usually has availability

Occupancy lower than 85% suggests more openings may be available.

Lower occupancy than the Massachusetts average: 82%
Occupancy rate 62.1% Rank #48 / 59Occupancy rate — state benchmarkedThis home is ranked 48th out of 59 homes in Massachusetts.Shows this facility's occupancy rate versus the Massachusetts average, with its statewide rank out of 59. Higher occupancy signals strong local demand and financial stability.
Avg. Length of Stay 124 days
Occupancy rate
62.1% Rank #48 / 59Occupancy rate — state benchmarkedThis home is ranked 48th out of 59 homes in Massachusetts.Shows this facility's occupancy rate versus the Massachusetts average, with its statewide rank out of 59. Higher occupancy signals strong local demand and financial stability.
Avg. Length of Stay
124 days

Who this home usually serves

TYPE OF STAY

Mostly short-term rehab stays

Most residents typically stay for a few weeks or months before returning home or moving on.

Breakdown by payment type

Medicare

60% of new residents, usually for short-term rehab.

Typical stay 20 days

Private pay

19% of new residents, often for short stays.

Typical stay 9 - 10 months

Medicaid

21% of new residents, often for long-term daily care.

Typical stay 9 - 10 months

Finances and operations

Privately-owned community
Operated by a business corporation.
Home revenue
$11.3M
Operating loss
-$153.7K
Privately-owned community Operated by a business corporation.
Home revenue
$11.3M Rank #51 / 60Revenue — state benchmarkedThis home is ranked 51st out of 60 homes in Massachusetts.Shows this facility's annual revenue compared to the Massachusetts SNF average. Higher revenue generally means more resources for staffing and capital — read alongside Payroll %.
Operating loss
-$153.7K
Payroll costs Info The portion of the home's budget spent on staff, including nurses, caregivers, and other employees who support care and operations. Rank #52 / 60Payroll — state benchmarkedThis home is ranked 52nd out of 60 homes in Massachusetts.Shows total annual staff payroll benchmarked to the Massachusetts average. Higher payroll investment relative to peers often signals better staffing and less reliance on cheaper contract labor.
$4.9M
43.9% of revenue Rank #23 / 60Payroll % — state benchmarkedThis home is ranked 23rd out of 60 homes in Massachusetts.Shows payroll as a percentage of revenue versus the Massachusetts average. Well-run SNFs often land around 55–65%. Below 25% may signal understaffing or heavy agency use — read with Staffing ratings.
Other operating costs Info All remaining costs needed to run the home, such as food, utilities, building maintenance, supplies and administrative expenses.
$6.5M
Total costs $11.4M
Walk Score
Walk Score: 74 / 100 Rank #18 / 55Walk Score — state benchmarkedThis home is ranked 18th out of 55 homes in Massachusetts.Shows how walkable this facility's neighborhood is compared to the average Walk Score across Massachusetts SNFs. Higher scores benefit residents, families, and staff.
Very walkable. Most errands can be accomplished on foot, and many essentials are within a short walk.

About this community

Safety & Compliance

Wheelchair Accessible
Grab Bars

Therapy & Rehabilitation

3 services
Rehabilitation Services
Respite Care
Short-Term Rehab

Additional Services

3 services
Short-Term Rehabilitation
Extended/Long-Term Care
Neurobehavioral Rehab

Types of Care at Belvidere Healthcare Center

Memory Care Respite Care Nursing Home Hospice Care

Contact Belvidere Healthcare Center

Health Inspection History

Inspections
Total health inspections 4

Massachusetts average 4.5


Last Health inspection on May 2025

Total health citations
49 Rank #50 / 57Health citations — state benchmarkedThis home is ranked 50th out of 57 homes in Massachusetts.Shows this facility's total health deficiency citations benchmarked to the Massachusetts state average, with a ranking across all 57 MA SNFs. Lower citation counts earn a better rank.

Massachusetts average 32.7

Citations per inspection
12.25 Rank #54 / 57Citations per inspection — state benchmarkedThis home is ranked 54th out of 57 homes in Massachusetts.Shows average deficiency citations per CMS inspection for this facility versus the Massachusetts mean across 57 SNFs with citation data. Lower is better.

Massachusetts average 7.24


Health citations are formal notices following inspections when they fail to comply with safety and care standards.

48 of 49 citations resulted from standard inspections; and 1 of 49 resulted from complaint investigations.

Breakdown of citation severity (last 3 years)
Critical Health citations More info
0
100% better than Massachusetts average

Massachusetts average: 0.3


Serious Health citations More info 3
100% worse than Massachusetts average

Massachusetts average: 1.5

0 critical citations More info Massachusetts average: 0.3

3 serious citations More info Massachusetts average: 1.5

45 moderate citations More info Massachusetts average: 29.7

1 minor citation More info Massachusetts average: 1.3
Citations history (last 3 years)
Infection Control moderate citation Info Issues related to preventing and controlling infections, including hygiene practices and safety protocols. May 14, 2025
Corrected

Quality of Care moderate citation Info Issues related to how well residents receive appropriate treatment and support for their medical and daily care needs. May 14, 2025
Corrected

Quality of Care moderate citation Info Issues related to how well residents receive appropriate treatment and support for their medical and daily care needs. May 14, 2025
Corrected

Quality of Care moderate citation Info Issues related to how well residents receive appropriate treatment and support for their medical and daily care needs. May 14, 2025
Corrected

Financial Assistance for
Nursing Home in Massachusetts

Belvidere Healthcare Center is located in Lowell, Massachusetts.
Here are the financial assistance programs available to residents in Massachusetts.

Get Financial aid guidance

Home Care Program

MassHealth Home Care

Age 60+
General Massachusetts resident, at risk of nursing home placement.
Income Limits (2025) ~$1,500/month individual, varies by region
Asset Limits $2,000 individual, excludes home, car
MA

Coordinated through Aging Services Access Points (ASAPs); high demand in urban areas.

Benefits
In-home care (3-5 hours/day) Homemaker services Respite care (up to 14 days/year) Adult day care (~$75/day)

Frail Elder Waiver

Massachusetts Medicaid FE Waiver

Age 65+
General Massachusetts resident, Medicaid-eligible, nursing home-level care need.
Income Limits (2025) ~$2,829/month 300% FBR, individual
Asset Limits $2,000 (individual), $3,000 (couple).
MA

Requires clinical eligibility determination.

Benefits
Personal care (5-7 hours/day) Respite care (240 hours/year) Adult day care (~$75/day) Home health services

Senior Care Options (SCO)

Massachusetts Senior Care Options

Age 65+
General Massachusetts resident, eligible for MassHealth (Medicare optional), nursing home-level care need.
Income Limits (2025) ~$2,829/month (300% FBR, individual); QIT allowed.
Asset Limits $2,000 (individual), $3,000 (couple) (excludes home up to $713,000, car).
MA

Not available in Dukes/Nantucket Counties; multiple SCO providers (e.g., CCA, Tufts).

Benefits
Personal care (5-7 hours/day) Medical care Respite (240 hours/year) Adult

Medicare Savings Program (MSP)

Massachusetts Medicare Savings Program (MassHealth Buy-In)

Age 65+ or disabled
General Massachusetts resident, Medicare Part A/B.
Income Limits (2025) ~$2,510/month (QMB), ~$3,380/month (SLMB), ~$3,598/month (QI)—individual.
Asset Limits $9,430 (individual), $14,130 (couple).
MA

Three tiers; no waitlist; includes Extra Help for Part D.

Benefits
Covers Part B premiums ($174.70/month) Deductibles ($240/year) Copays (~20%)

National Family Caregiver Support Program (NFCSP) Respite

Massachusetts NFCSP Respite Care

Age
General Caregivers of 60+ needing care or 55+ caregivers of others; Massachusetts resident; functional needs (2+ ADLs).
Income Limits (2025) Prioritizes ~$24,980/year (individual); no strict cap.
Asset Limits Not assessed; need-based.
MA

27 ASAPs; prioritizes low-income, rural caregivers.

Benefits
Respite (4-6 hours/week or 5 days/year) Adult day care ($60/day) Caregiver training Supplies (~$500/year)

Prescription Advantage

Massachusetts Prescription Advantage

Age 65+ or disabled
General Massachusetts resident, enrolled in Medicare Part D (or ineligible for Medicare).
Income Limits (2025) No strict limit; copays vary by income ~$24,980-$75,000/year individual
Asset Limits Not assessed.
MA

Supplements Medicare Part D; no enrollment fee for low-income.

Benefits
Covers prescription copays ($5-$40/drug) Fills coverage gaps Catastrophic cost protection ($4,000+ covered)

Senior Community Service Employment Program (SCSEP)

Massachusetts SCSEP

Age 55+
General unemployed, low-income, Massachusetts resident.
Income Limits (2025) ~$1,983/month 125% FPL
Asset Limits Not specified; income-focused.
MA

Priority for veterans, rural residents; AARP partnership.

Benefits
Paid training (~20 hours/week at ~$15/hour) Job placement

VA Aid and Attendance (A&A) and Housebound Benefits

Massachusetts VA Aid and Attendance/Housebound

Age 65+ or disabled veteran/spouse
General Massachusetts resident, wartime service, need for ADL help (A&A) or homebound.
Income Limits (2025) Net income < ~$1,984/month (veteran with dependent, A&A); pension offsets income.
Asset Limits ~$155,356 net worth limit
MA

High veteran demand statewide.

Benefits
Cash (~$1,433-$2,642/month veteran, ~$951-$1,318 spouse) for care costs (e.g., in-home, assisted living)

Places of interest near Belvidere Healthcare Center

Address 2.1 miles from city center Info Estimated distance in miles from Lowell's city center to Belvidere Healthcare Center's address, calculated via Google Maps. — 8.62 miles to nearest hospital (Merrimack Health Lawrence Hospital)

Calculate Travel Distance to Belvidere Healthcare Center

Add your location

Address

Staffing Data (Q2 2025)

This data corresponds to Q2 2025 and is based on CMS Payroll-Based Journal.

Total staff 108
Employees 95
Contractors 13
Staff to resident ratio 1.24:1
27% worse than Massachusetts average

Massachusetts average ratio: 1.70:1

Avg staff/day 42
Average shift 7.7 hours
0% compared with Massachusetts average

Massachusetts average: 7.9 hours

Total staff hours (quarter) 29,400
Nursing staff breakdown
Registered Nurse

Manages medical care and health needs.

Total count 6
Average shift length Info Average shift length. Calculated as total hours divided by days worked and average staff per day. 5.9 hours

No contractors work on this role.

Licensed Practical Nurse

Assists with medical care and medications.

Total count 23
Average shift length Info Average shift length. Calculated as total hours divided by days worked and average staff per day. 8.3 hours

No contractors work on this role.

Certified Nursing Assistant

Helps with daily care and mobility.

Total count 39
Average shift length Info Average shift length. Calculated as total hours divided by days worked and average staff per day. 8 hours

No contractors work on this role.

Contractor staffing

Total hours from contractors

2.4%

699 contractor hours this quarter

Clinical Nurse Specialist: 4 Dental Services Staff: 3 Other Physician: 1 Occupational Therapy Aide: 1 Medical Director: 1 Occupational Therapy Assistant: 1 Mental Health Service Worker: 1 RN Director of Nursing: 1
Staff by category
Certified Nursing Assistant 39 0 39 13,996 91 100% 8
Licensed Practical Nurse 23 0 23 7,970 91 100% 8.3
Clinical Nurse Specialist 4 4 8 1,551 77 85% 7.8
Other Dietary Services Staff 4 0 4 1,375 81 89% 7.9
Physical Therapy Assistant 6 0 6 932 70 77% 6.2
Physical Therapy Aide 3 0 3 598 64 70% 5.1
Respiratory Therapy Technician 3 0 3 516 59 65% 8.1
Nurse Practitioner 1 0 1 504 63 69% 8
Administrator 1 0 1 488 61 67% 8
Registered Nurse 6 0 6 373 51 56% 5.9
Dental Services Staff 0 3 3 348 45 49% 7.7
Speech Language Pathologist 1 0 1 306 40 44% 7.7
Occupational Therapy Aide 1 1 2 140 26 29% 5.4
Mental Health Service Worker 1 1 2 117 14 15% 7.8
Qualified Social Worker 2 0 2 60 18 20% 3
Other Physician 0 1 1 52 13 14% 4
Occupational Therapy Assistant 0 1 1 40 6 7% 6.7
RN Director of Nursing 0 1 1 20 2 2% 10
Medical Director 0 1 1 12 3 3% 4
39 Certified Nursing Assistant
% of Days 100%
23 Licensed Practical Nurse
% of Days 100%
8 Clinical Nurse Specialist
% of Days 85%
4 Other Dietary Services Staff
% of Days 89%
6 Physical Therapy Assistant
% of Days 77%
3 Physical Therapy Aide
% of Days 70%
3 Respiratory Therapy Technician
% of Days 65%
1 Nurse Practitioner
% of Days 69%
1 Administrator
% of Days 67%
6 Registered Nurse
% of Days 56%
3 Dental Services Staff
% of Days 49%
1 Speech Language Pathologist
% of Days 44%
2 Occupational Therapy Aide
% of Days 29%
2 Mental Health Service Worker
% of Days 15%
2 Qualified Social Worker
% of Days 20%
1 Other Physician
% of Days 14%
1 Occupational Therapy Assistant
% of Days 7%
1 RN Director of Nursing
% of Days 2%
1 Medical Director
% of Days 3%

Facility Characteristics

Source: CMS Long-Term Care Facility Characteristics (Data as of Jan 2026)

Total residents 87
Medicare
12
13.8% of residents
Medicaid
29
33.3% of residents
Private pay or other
46
52.9% of residents
Programs & Services
Residents Group

Residents meet regularly to discuss policies, care quality, and activities

Active Resident Council

Organized group of residents that meets regularly to discuss facility policies, quality of life, and activities.

Quality of care over time

These measures show how residents usually do over time at this home, based on health outcomes and preventive care.

High-risk clinical events score Info A composite score based on pressure ulcers, falls with injury, weight loss, walking ability decline, and activities of daily living decline. 7.6
25% better than Massachusetts average

Massachusetts average: 10.2

Functional decline score Info A composite score based on activities of daily living decline, walking ability decline, and incontinence. 13.3
34% better than Massachusetts average

Massachusetts average: 20.0

Long-stay resident measures
Average Massachusetts avg: 3.6 Info CMS star rating based on long-stay quality measure performance. 5 stars = significantly above average, 1 star = significantly below average.
Need for Help with Daily Activities Increased Info Percent of long-stay residents whose need for help with daily activities has increased 10.6%
43% better than Massachusetts average

Massachusetts average: 18.7%

Walking Ability Worsened Info Percent of long-stay residents whose ability to move independently worsened 10.2%
47% better than Massachusetts average

Massachusetts average: 19.3%

Low Risk Residents with Bowel/Bladder Incontinence Info Percent of low risk long-stay residents who lose control of their bowels or bladder 19.0%
14% better than Massachusetts average

Massachusetts average: 22.1%

Falls with Major Injury Info Percent of long-stay residents experiencing one or more falls with major injury 4.9%
38% worse than Massachusetts average

Massachusetts average: 3.6%

High Risk Residents with Pressure Ulcers Info Percent of long-stay high risk residents with pressure ulcers 8.3%
78% worse than Massachusetts average

Massachusetts average: 4.7%

Urinary Tract Infection Info Percent of long-stay residents with a urinary tract infection 1.9%
7% better than Massachusetts average

Massachusetts average: 2.1%

Lost Too Much Weight Info Percent of long-stay residents who lose too much weight 4.2%
18% better than Massachusetts average

Massachusetts average: 5.2%

Depressive Symptoms Info Percent of long-stay residents who have depressive symptoms 0.4%
96% better than Massachusetts average

Massachusetts average: 10.7%

Antipsychotic Use Info Percent of long-stay residents who received an antipsychotic medication 14.2%
30% better than Massachusetts average

Massachusetts average: 20.3%

Pneumococcal Vaccine Info Percent of long-stay residents assessed and appropriately given the pneumococcal vaccine 96.6%
5% better than Massachusetts average

Massachusetts average: 91.9%

Influenza Vaccine Info Percent of long-stay residents assessed and appropriately given the seasonal influenza vaccine 93.0%
In line with Massachusetts average

Massachusetts average: 94.8%

Hospitalizations per 1,000 days Info Number of hospitalizations per 1,000 long-stay resident days. 3.02
62% worse than Massachusetts average

Massachusetts average: 1.86

ED visits per 1,000 days Info Number of outpatient emergency department visits per 1,000 long-stay resident days. 1.72
12% worse than Massachusetts average

Massachusetts average: 1.54

Short-stay resident measures
Average Massachusetts avg: 3.2 Info CMS star rating based on short-stay quality measure performance. 5 stars = much above average, 1 star = much below average.
Pneumococcal Vaccine Info Percent of short-stay residents assessed and appropriately given the pneumococcal vaccine 75.5%
In line with Massachusetts average

Massachusetts average: 76.7%

Antipsychotic medication increase Info Percent of short-stay residents who newly received an antipsychotic medication 1.0%
25% better than Massachusetts average

Massachusetts average: 1.3%

Influenza Vaccine Info Percent of short-stay residents assessed and appropriately given the seasonal influenza vaccine 75.2%
In line with Massachusetts average

Massachusetts average: 77.7%

Re-hospitalized after SNF stay Info Percentage of short-stay residents who were re-hospitalized after their nursing home admission. 26.9%
In line with Massachusetts average

Massachusetts average: 25.8%

Emergency department visits Info Percentage of short-stay residents who had an outpatient emergency department visit. 7.7%
35% better than Massachusetts average

Massachusetts average: 11.8%

Falls with major injury Info Percentage of SNF residents who experience falls with major injury during their stay. 1.7%
123% worse than Massachusetts average

Massachusetts average: 0.8%

Ability to care for self at discharge Info Percentage of residents at or above expected ability to care for themselves at discharge. 64.1%
19% better than Massachusetts average

Massachusetts average: 53.7%

Successful return to home or community Info Rate of successful return to home or community from a skilled nursing facility. 50.9%
In line with Massachusetts average

Massachusetts average: 50.6%

Penalties and fines

Federal penalties imposed by CMS for regulatory violations, including civil money penalties (fines) and denials of payment for new Medicare/Medicaid admissions.

Source: CMS Penalties Database (Data as of Jan 2026)

Total fines amount $48K
33% lower than Massachusetts average

Massachusetts average: $72K

Number of fines 4
133% more fines than Massachusetts average

Massachusetts average: 1.7

Payment Denials Info Serious action where Medicare and/or Medicaid temporarily stops payments for new residents until issues are fixed. 0
100% fewer payment denials than Massachusetts average

Massachusetts average: 0.1

Fines amount comparison
This facility $48K
Massachusetts average $72K
Penalty History

Penalties are imposed by CMS for violations of federal nursing home regulations.

1 penalty in the past 3 years

Nov 29, 2023 · $13K

Civil Money Penalty Info Fines imposed for noncompliance, which can be assessed per day or per instance of violation. Nov 29, 2023
$13K

Last updated: Jan 2026

Compare Nursing Homes around Lowell The information below is reported by the Massachusetts Executive Office of Elder Affairs and Department of Public Health.

4 facilities compared · CMS & MA Dept. of Health data · Updated Apr 2026

Filter by care type
Palm Center
NH

Nursing Home Licensed facility providing 24/7 skilled nursing care for residents with complex, ongoing medical needs. Staffed by RNs, LPNs, and CNAs. Inspected and star-rated annually by CMS. Accepts Medicare (short-term rehab) and Medicaid (long-term care).

AL

Assisted Living A licensed, long-term care setting for seniors or individuals with disabilities who need help with daily activities — like bathing, dressing, and medication management — but not 24-hour skilled nursing. Offers housing, meals, and around-the-clock support while aiming to maximize resident independence.

Chelmsford (North Chelmsford) 119 81.2% -1% 4.27 -21% +9% 1 21 4.2 1 102 78 Sirakov, Dimitre $17.6M $6.0M 34.1% 225508
CareOne at Lowell
NH

Nursing Home Licensed facility providing 24/7 skilled nursing care for residents with complex, ongoing medical needs. Staffed by RNs, LPNs, and CNAs. Inspected and star-rated annually by CMS. Accepts Medicare (short-term rehab) and Medicaid (long-term care).

AL

Assisted Living A licensed, long-term care setting for seniors or individuals with disabilities who need help with daily activities — like bathing, dressing, and medication management — but not 24-hour skilled nursing. Offers housing, meals, and around-the-clock support while aiming to maximize resident independence.

Lowell (Centralville) 160 95.1% +16% 5.04 -75% +28% 1 27 6.8 1 155 77 Thci Of Massachusetts, Llc $33.0M $12.7M 38.7% 225224
Belvidere Healthcare Center
NH

Nursing Home Licensed facility providing 24/7 skilled nursing care for residents with complex, ongoing medical needs. Staffed by RNs, LPNs, and CNAs. Inspected and star-rated annually by CMS. Accepts Medicare (short-term rehab) and Medicaid (long-term care).

AL

Assisted Living A licensed, long-term care setting for seniors or individuals with disabilities who need help with daily activities — like bathing, dressing, and medication management — but not 24-hour skilled nursing. Offers housing, meals, and around-the-clock support while aiming to maximize resident independence.

Lowell (Belvidere) 111 62.1% -24% 3.51 -57% -11% 4 49 12.3 3 81 74 Tessier-Efstathiou, Diane $11.3M $4.9M 43.9% 225489
RegalCare at Lowell
NH

Nursing Home Licensed facility providing 24/7 skilled nursing care for residents with complex, ongoing medical needs. Staffed by RNs, LPNs, and CNAs. Inspected and star-rated annually by CMS. Accepts Medicare (short-term rehab) and Medicaid (long-term care).

AL

Assisted Living A licensed, long-term care setting for seniors or individuals with disabilities who need help with daily activities — like bathing, dressing, and medication management — but not 24-hour skilled nursing. Offers housing, meals, and around-the-clock support while aiming to maximize resident independence.

Lowell (Highlands) 90 70.7% -14% 3.53 -22% -10% 2 44 8.8 3 55 69 - $6.8M $3.5M 52.2% 225511

Guides for Better Senior Living

Care Cost Calculator: See Prices in Your Area

Nursing Home Data Explorer

Don’t Wait Too Long: 7 Red Flag Signs Your Parent Needs Assisted Living Now

The True Cost of Assisted Living in 2025 – And How Families Are Paying For It

Understanding Senior Living Costs: Pricing Models, Discounts & Financial Assistance

Explore Open Rooms
1 Contact details
2 What type of senior care service are you looking for?
3 What budget do you have in mind for senior care?
4 How soon do you need to find care?
5 Additional details

Thank you for your interest!

Our team will be in touch shortly to help with next steps.