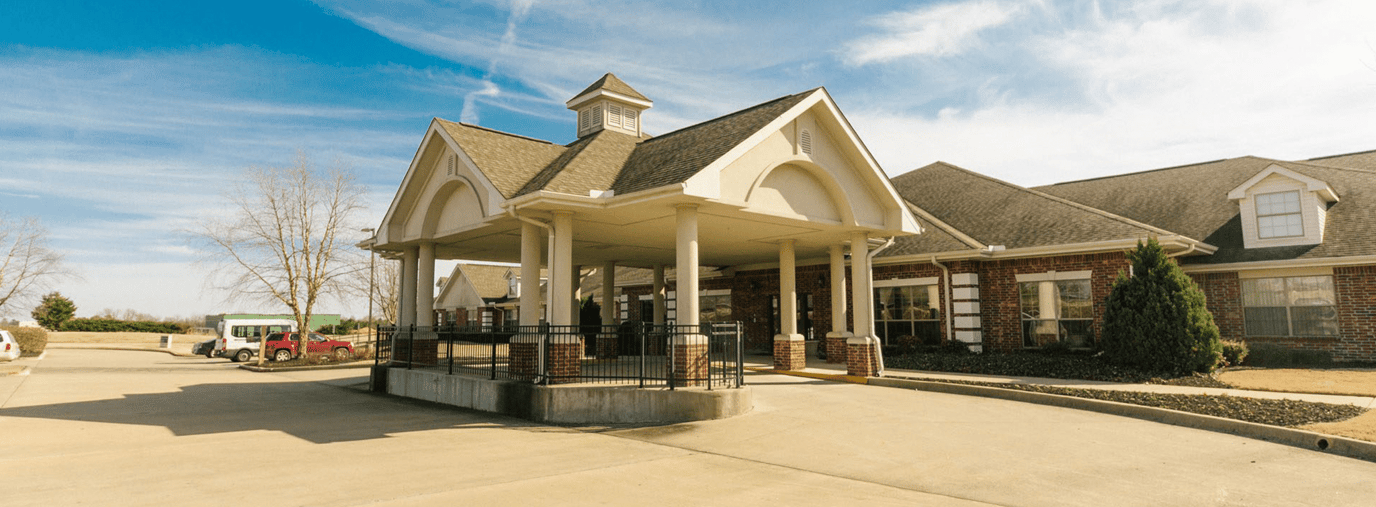
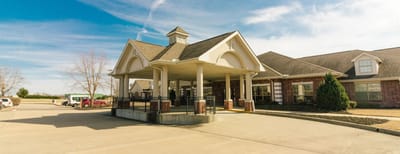
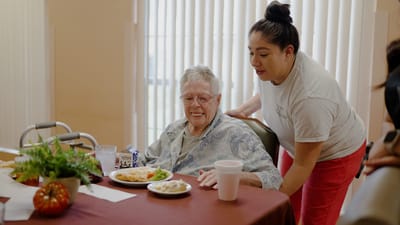
Edgewood Health and Rehabilitation
Nursing Home, Memory Care & Respite Care · Springdale, AR
CMS overall rating Info CMS (the Centers for Medicare & Medicaid Services) is the federal agency that rates nursing home quality. Its Overall Rating runs from 1 to 5 stars, combining health inspections, staffing, and quality measures, with inspections weighted most heavily.

Edgewood Health and Rehabilitation

Nursing Home, Memory Care & Respite Care · Springdale, AR
CMS overall rating Info CMS (the Centers for Medicare & Medicaid Services) is the federal agency that rates nursing home quality. Its Overall Rating runs from 1 to 5 stars, combining health inspections, staffing, and quality measures, with inspections weighted most heavily.
Calculator: See prices in your area
Edgewood Health and Rehabilitation accepts Medicare, Medicaid, and private pay.

Overview of Edgewood Health and Rehabilitation

Edgewood Health And Rehabilitation is a 102-bed skilled nursing home in Springdale operates at full capacity on East Don Tyson Parkway in Washington County, Arkansas. Tracie Jones owns the facility, which Bob Martin administers. Most admissions, roughly two-thirds, are private-pay rehabilitation patients staying 1 to 2 months. Medicaid and Medicare fill the remainder, with long-term Medicaid residents comprising 61% of current census.

CMS ratings run high across most measures: 5 stars for health inspections (38.9% above average), 5 stars for quality measures (35.1% above state), and 5 overall (58.7% above average). Yet staffing carries a 1-star designation (7.7% below average), a rating that reflects a structural problem rather than occasional lapses.

The facility maintains zero registered nurses in direct clinical roles; only administrative RN Director positions exist. This creates predictable deficiency patterns. In November 2024, state inspectors cited failure to have a registered nurse work 8 consecutive hours daily, hand hygiene breaches during meal service and personal care, and missed barrier precautions for a resident with pressure ulcers.

Over four years of state oversight, the facility has recorded 32 deficiencies, 52% above the average. Inspection patterns cluster around infection control, medication management, care plan implementation (particularly bathing and feeding assistance), and dietary safety.

Two complaint investigations in 2023 substantiated privacy failures during medication administration, unsanitary conditions with torn furnishings, improper medication storage, and systematic hand-hygiene lapses among dietary staff.

No severe sanctions materialized; no immediate jeopardy findings, no fines, no payment denials. All cited deficiencies were corrected.

Long-stay residents experience low rates of functional decline (22% better than state), rare pressure ulcers (53% better than state), and minimal antipsychotic medication use (86% better than average). Falls with major injury, however, occur in 5.8% of long-stay residents, nearly half again the average.

Rehabilitation outcomes for short-stay Medicare patients are weaker: only 41.8% of residents achieve expected self-care ability at discharge (22% below average), and fall rates during short stays sit at 1.2%, nearly double the average.

Staffing composition includes 15 licensed practical nurses, 64 certified nursing aides, and 40 contractor therapy professionals (26% contractor dependency).

Payroll consumes 37.2% of revenue; below the 47–60% benchmark for well-staffed facilities.

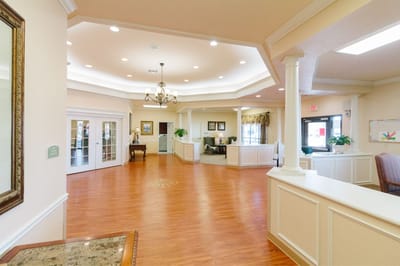
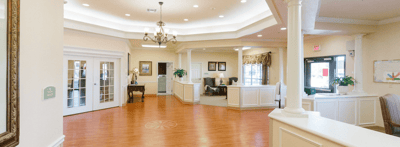
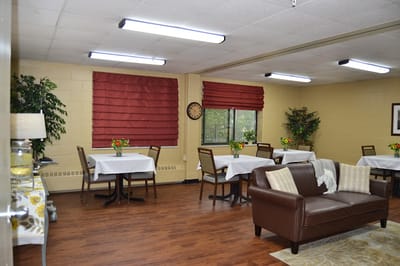
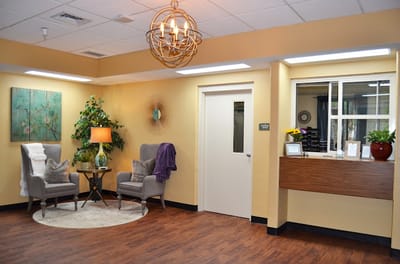
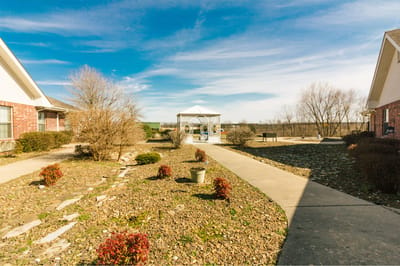
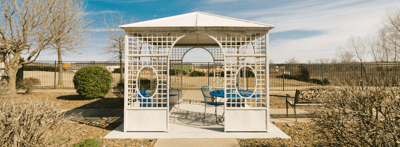
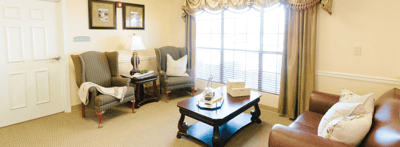
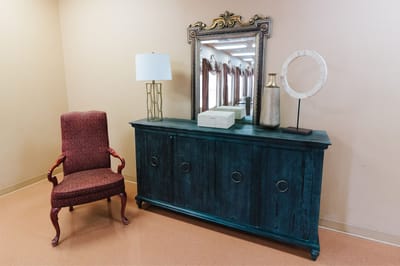
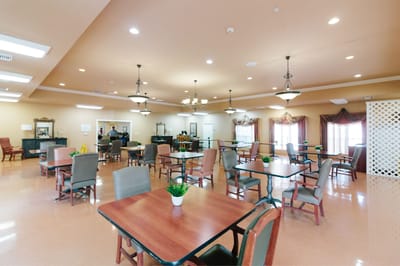
The community offers therapy gym, outdoor courtyard, activity spaces, communal dining, and salon services.

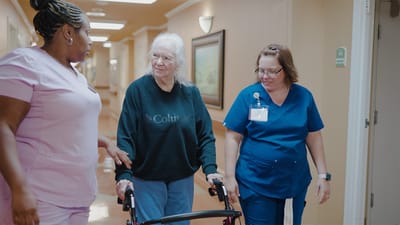
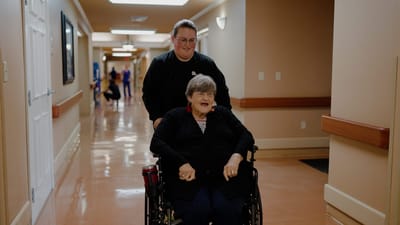
Admissions are supported by 24-hour nursing and respite services.

The facility provides rehabilitation or memory care with strong regulatory ratings but with acknowledged staffing and compliance challenges requiring ongoing attention.

(479) 751-2390

Quality ratings

Measured by Centers for Medicare & Medicaid Services (CMS)

Overall rating Info The Overall CMS Rating combines results from health inspections, staffing levels and quality measures. Health inspections carry the most weight. Staffing and quality scores can increase or decrease the final rating based on performance compared to state and national standards.
▲ 27.5% Above AR avg. ▲ 27.5% Above AR avg.AR average: 3.1Click the badge to see the full State ranking.Click here to see the full State ranking.
Health Inspection Info Based on the results of the facility's three most recent standard inspections and any complaint investigations. CMS reviews the number, scope, and severity of deficiencies, with more recent findings weighted more heavily.
▲ 38.4% Above AR avg. ▲ 38.4% Above AR avg.AR average: 2.9Click the badge to see the full State ranking.Click here to see the full State ranking.
Staffing Info Measures average nursing staff hours per resident per day, including Registered Nurses (RNs) and total nursing staff. Ratings are adjusted based on the level of care residents require and are compared to state and national benchmarks.
▼ 5.8% Below AR avg. ▼ 5.8% Below AR avg.AR average: 3.2Click the badge to see the full State ranking.Click here to see the full State ranking.
Quality Measures Info Based on clinical and physical health indicators reported to CMS, such as hospital readmissions, falls, pressure ulcers, and improvements in mobility. These measures reflect how well residents' health needs are being managed.
▲ 9.3% Above AR avg. ▲ 9.3% Above AR avg.AR average: 3.7Click the badge to see the full State ranking.Click here to see the full State ranking.

Staffing hours breakdown

Info Daily nursing hours per resident by staff type, reported to CMS. Higher is generally better — compare this facility to state and national averages to see where staffing stands.

Hours per resident per day — compared to Arkansas state averages

Total nursing care / resident Info Total adjusted nursing hours per resident per day, combining RN, LPN, and aide time. CMS adjusts this for case-mix so facilities can be fairly compared.
4h 33m per day
This facility Arkansas avg (4h 40m per day)
vs Arkansas avg
-2%

2 of 6 metrics below state avg

Standout metric LPN / LVN is +15% above state avg
Staff typeHours / Day / Residentvs state avg
Registered Nurse (RN) Info RNs hold the highest nursing license and can assess residents, interpret test results, and direct care plans. More RN hours per day often signals stronger clinical oversight and faster response to health changes. 14m per day ▼ 40% State avg: 24m per day · National avg: 41m per day
LPN / LVN Info Licensed Practical Nurses (LPNs) or Licensed Vocational Nurses (LVNs) deliver routine hands-on care — medication administration, wound dressing, and monitoring vital signs. They work under RN supervision and make up a large share of daily bedside care. 1h 6m per day ▲ 15% State avg: 57m per day · National avg: 52m per day
Nurse Aide Info Certified Nurse Aides (CNAs) provide the most direct day-to-day assistance: bathing, dressing, feeding, and mobility. Nurse aide hours are typically the largest staffing category and directly affect residents' quality of life. 2h 59m per day ▲ 9% State avg: 2h 44m per day · National avg: 2h 21m per day
Weekend Total Nursing Info Combined nursing hours (RN + LPN + Nurse Aide) per resident per day on weekends. Staffing often drops on weekends — this figure reveals whether the facility maintains adequate coverage outside of weekday hours. 3h 38m per day ▲ 4% State avg: 3h 29m per day · National avg: 3h 26m per day
Physical Therapist Info Hours per resident per day provided by licensed Physical Therapists (PTs) or PT Assistants. PT services help residents recover mobility after injury or illness and are especially important for post-acute (short-stay) rehabilitation. 2m per day ■ Avg State avg: 2m per day · National avg: 4m per day
Weekend RN Info Registered nurse hours specifically on weekends. Facilities sometimes reduce RN presence on Saturdays and Sundays — a low weekend RN figure compared to weekday hours can indicate reduced clinical oversight when most administrative staff are absent. 8m per day ▼ 50% State avg: 16m per day · National avg: 29m per day

Capacity and availability

Avg. Length of Stay
113 days
Bed community size
102-bed community Rank #125 / 330Bed count — State benchmarkedThis home is ranked 125th out of 330 homes in Arkansas. Shows this facility's certified or reported bed count compared to other Arkansas facilities. Larger communities may offer more amenities, programs, and on-site services for residents and families.Ranking totals vary by category as each rank only includes facilities that report data for that metric. Homes missing that data point aren't included in the ranking.Click the rank badge to see the full State ranking.Click here to see the full State ranking.
A larger shared setting that may offer more common spaces and organized community services.
Walk Score
Walk Score: 37 / 100 Rank #179 / 419Walk Score — State benchmarkedThis home is ranked 179th out of 419 homes in Arkansas. Shows how walkable this facility's neighborhood is compared to the average Walk Score across Arkansas facilities. Higher scores benefit residents, families, and staff.Ranking totals vary by category as each rank only includes facilities that report data for that metric. Homes missing that data point aren't included in the ranking.Click the rank badge to see the full State ranking.Click here to see the full State ranking.
Somewhat walkable. A few nearby services may be reachable on foot, but most trips require transportation.
BBB Rating
BBB Rating: A+ (Not Accredited)
An independent rating from the Better Business Bureau based on factors such as complaint history, transparency, and business practices.
How BBB ratings work

About this community

Occupancy

Occupancy rate
100%
Higher than the Arkansas average: 71.3%
Occupied beds
102 / 102
Average occupied beds in Arkansas homes 77 beds

License Details

Facility TypeSkilled Nursing Facility With Dual Certified Beds (medicaid / Medicare)
CountyWashington
Business TypeCorporation
CMS Certification Number45428
Certification TypeMedicaid/Medicare

Ownership & Operating Entity

Edgewood Health and Rehabilitation is legally operated by CWNC OPS, Inc., and administrated by Bob Martin.

Type Of Units

Medicaid and Medicare
102 units
Total beds
102 units

Staffing

Key information about the people who lead and staff this community.

Leadership

ContactMs. Tracy Jones, Administrator

Therapy & Rehabilitation

2 services
Rehabilitation Services
Respite Care

Staffing & Medical

1 service
24-Hour Staffing

Contact Information

Fax479-751-3034

Amenities & Lifestyle

Communal Dining Space
Activity Area
Outdoor Courtyard
Therapy Gym
Salon Services
ActivitiesAt Edgewood, we are committed to keeping our guests happy by offering daily opportunities for entertainment and socialization.
Specific ProgramsShort-Term Rehab, Additional Services

Dining & Nutrition

Food DescriptionSavor a variety of delicious dishes crafted by our certified dietary manager and cooks. From Southern classics to lighter fare, there’s something for every taste.

Contact Edgewood Health and Rehabilitation

Inspection History

In Arkansas, the Department of Human Services, Office of Long Term Care is authorized to conduct unannounced inspections and issue official quality of care reports for all senior living providers.

Since 2022 · 4 years of data 32 deficiencies

Inspection Scorecard Info This scorecard compares key inspection, citation, and complaint metrics at this facility against the Arkansas state average. Metrics rated ≥15% worse than average are highlighted in red; those ≥15% better are highlighted in green.

Since 2022 vs. Arkansas state average
Overall vs. AR average 2 Worse Metrics worse than Arkansas average:
• Total deficiencies (52% above)
• Deficiencies per year (51% above)
0 Better No metrics in this bucket.
Latest Inspection November 7, 2024 Routine

Deficiencies Info Deficiencies are formal regulatory issues recorded during state inspections.

This FacilityAR Averagevs. AR Avg
Total deficiencies Info Formal regulatory issues recorded by inspectors across all inspection types. 3221 This facility has 52% more total deficiencies than a typical Arkansas nursing home (32 vs. AR avg 21).↑ 52% worse
Deficiencies per year Info Average deficiencies per year since 2022. 85.3 This facility has 51% more deficiencies per year than a typical Arkansas nursing home (8 vs. AR avg 5.3).↑ 51% worse

Inspection Reports Summary Info An editor-reviewed summary of the themes and findings across this facility's recent inspection reports.

  • November 7, 2024 inspections found 2 to 3 deficiencies including failure to have an RN on duty 8 consecutive hours daily and poor hand hygiene during meal service and perineal care.
  • September 8, 2023 complaint investigation identified 5 deficiencies involving privacy breaches, unsanitary environment, medication labeling and storage errors, dietary hand hygiene, and infection control lapses.
  • February 17, 2023 complaint investigation substantiated failures in bathing care plans and respiratory treatment administration, but no immediate jeopardy or harm-level citations were issued.

Health Inspection History

Inspections since 2022
Total health inspections 4

Arkansas average 4.2


Last Health inspection on Nov 2024

Total health citations
18

Arkansas average 21.8

Citations per inspection
4.5

Arkansas average 5.32


Health citations are formal notices following inspections when they fail to comply with safety and care standards.

14 of 18 citations resulted from standard inspections; and 4 of 18 resulted from complaint investigations.

Breakdown of citation severity (last 4 years)
Critical health citations
0
100% better than Arkansas average

Arkansas average: 0.4


Serious health citations
0
100% better than Arkansas average

Arkansas average: 0.2

0 critical citations Arkansas average: 0.4

0 serious citations Arkansas average: 0.2

18 moderate citations Arkansas average: 20.9

0 minor citations Arkansas average: 0.4
Citations history (last 4 years)
Abuse/Neglect moderate citation Nov 07, 2024
Corrected

Infection Control moderate citation Nov 07, 2024
Corrected

Nursing Services moderate citation Nov 07, 2024
Corrected

Infection Control moderate citation Sep 08, 2023
Corrected

Staffing Data

Reporting period: October 1 – December 31, 2025 (Q4 2025). Source: CMS Payroll-Based Journal report.

Total staff 155
Employees 115
Contractors 40
Staff to resident ratio 1.87 : 1
18% more staff per resident than Arkansas average
Arkansas average ratio: 1.59 : 1 Arkansas average ratio: 1.59 : 1See full Arkansas ranking
Avg staff/day 48
Average shift 8 hours
0% compared with Arkansas average
Arkansas average: 8 hours Arkansas average shift: 8 hoursSee full Arkansas ranking
Total staff hours (quarter) 35,109

Nursing staff breakdown

Q4 2025 · Oct 1 – Dec 31 More info This data comes from the CMS Payroll-Based Journal report covering October 1 – December 31, 2025.
Registered Nurse

Manages medical care and health needs.

RN Staff Info No RN Staff reported this quarter. 0
Average shift length Info Average shift length. Calculated as total hours divided by days worked and average staff per day.
Licensed Practical Nurse

Assists with medical care and medications.

LPN Staff Info All 15 LPN Staff are full-time employees. No contractors work on this role. 15
Average shift length Info Average shift length. Calculated as total hours divided by days worked and average staff per day. 9.6 hours
Certified Nursing Assistant

Helps with daily care and mobility.

CNA Staff Info All 64 CNA Staff are full-time employees. No contractors work on this role. 64
Average shift length Info Average shift length. Calculated as total hours divided by days worked and average staff per day. 8 hours

Contractor staffing

Q4 2025 · Oct 1 – Dec 31 More info This data comes from the CMS Payroll-Based Journal report covering October 1 – December 31, 2025.

Total hours from contractors

4%

1,411 contractor hours this quarter

Physical Therapy Assistant: 8 Respiratory Therapy Technician: 7 Speech Language Pathologist: 6 Qualified Social Worker: 6 Physical Therapy Aide: 5 Clinical Nurse Specialist: 3 Occupational Therapy Aide: 2 Occupational Therapy Assistant: 2 Medical Director: 1

Staff by category

Q4 2025 · Oct 1 – Dec 31 More info This data comes from the CMS Payroll-Based Journal report covering October 1 – December 31, 2025.
Certified Nursing Assistant6406417,56092100%8
Licensed Practical Nurse150155,49092100%9.6
Medication Aide/Technician6062,84392100%8.1
RN Director of Nursing6062,7157480%8.1
Nurse Aide in Training130131,9099199%7.5
Clinical Nurse Specialist73101,3089199%7.2
Nurse Practitioner1014966267%8
Administrator1014886166%8
Dental Services Staff1014876368%7.7
Other Dietary Services Staff1014836571%7.4
Physical Therapy Aide0554136773%5.8
Speech Language Pathologist0663246470%4.8
Respiratory Therapy Technician0772465459%4.4
Qualified Social Worker0662226773%3.2
Physical Therapy Assistant088583740%1.4
Occupational Therapy Aide0224567%7.5
Occupational Therapy Assistant0221922%9.5
Medical Director011333%1
64 Certified Nursing Assistant
% of Days 100%
15 Licensed Practical Nurse
% of Days 100%
6 Medication Aide/Technician
% of Days 100%
6 RN Director of Nursing
% of Days 80%
13 Nurse Aide in Training
% of Days 99%
10 Clinical Nurse Specialist
% of Days 99%
1 Nurse Practitioner
% of Days 67%
1 Administrator
% of Days 66%
1 Dental Services Staff
% of Days 68%
1 Other Dietary Services Staff
% of Days 71%
5 Physical Therapy Aide
% of Days 73%
6 Speech Language Pathologist
% of Days 70%
7 Respiratory Therapy Technician
% of Days 59%
6 Qualified Social Worker
% of Days 73%
8 Physical Therapy Assistant
% of Days 40%
2 Occupational Therapy Aide
% of Days 7%
2 Occupational Therapy Assistant
% of Days 2%
1 Medical Director
% of Days 3%

Penalties and fines

Federal penalties imposed by CMS for regulatory violations, including civil money penalties (fines) and denials of payment for new Medicare/Medicaid admissions.

Source: CMS Penalties Database

No penalties in the past 3 years

No civil money penalties or payment denials were reported in the last 3 years.

Quality of care over time

These measures show how residents usually do over time at this home, based on health outcomes and preventive care.

High-risk clinical events score Info A composite score based on pressure ulcers, falls with injury, weight loss, walking ability decline, and activities of daily living decline. 6.0
22% better than Arkansas average

Arkansas average: 7.7

Functional decline score Info A composite score based on activities of daily living decline, walking ability decline, and incontinence. 11.1
17% better than Arkansas average

Arkansas average: 13.3

Long-stay resident measures
Significantly above average Arkansas avg: 4.2 Info CMS star rating based on long-stay quality measure performance. 5 stars = significantly above average, 1 star = significantly below average.
Need for Help with Daily Activities Increased Info Percent of long-stay residents whose need for help with daily activities has increased 6.7%
42% better than Arkansas average

Arkansas average: 11.5%

Walking Ability Worsened Info Percent of long-stay residents whose ability to move independently worsened 12.8%
5% better than Arkansas average

Arkansas average: 13.4%

Low Risk Residents with Bowel/Bladder Incontinence Info Percent of low risk long-stay residents who lose control of their bowels or bladder 13.9%
8% better than Arkansas average

Arkansas average: 15.1%

Falls with Major Injury Info Percent of long-stay residents experiencing one or more falls with major injury 5.8%
47% worse than Arkansas average

Arkansas average: 3.9%

High Risk Residents with Pressure Ulcers Info Percent of long-stay high risk residents with pressure ulcers 2.2%
53% better than Arkansas average

Arkansas average: 4.7%

Urinary Tract Infection Info Percent of long-stay residents with a urinary tract infection 0.0%
100% better than Arkansas average

Arkansas average: 1.3%

Lost Too Much Weight Info Percent of long-stay residents who lose too much weight 2.5%
50% better than Arkansas average

Arkansas average: 5.0%

Depressive Symptoms Info Percent of long-stay residents who have depressive symptoms 0.0%
100% better than Arkansas average

Arkansas average: 1.5%

Antipsychotic Use Info Percent of long-stay residents who received an antipsychotic medication 1.5%
86% better than Arkansas average

Arkansas average: 10.5%

Pneumococcal Vaccine Info Percent of long-stay residents assessed and appropriately given the pneumococcal vaccine 100.0%
6% better than Arkansas average

Arkansas average: 94.4%

Influenza Vaccine Info Percent of long-stay residents assessed and appropriately given the seasonal influenza vaccine 100.0%
In line with Arkansas average

Arkansas average: 96.2%

Hospitalizations per 1,000 days Info Number of hospitalizations per 1,000 long-stay resident days. 2.14
9% worse than Arkansas average

Arkansas average: 1.97

ED visits per 1,000 days Info Number of outpatient emergency department visits per 1,000 long-stay resident days. 1.57
28% better than Arkansas average

Arkansas average: 2.18

Short-stay resident measures
Above average Arkansas avg: 2.7 Info CMS star rating based on short-stay quality measure performance. 5 stars = much above average, 1 star = much below average.
Pneumococcal Vaccine Info Percent of short-stay residents assessed and appropriately given the pneumococcal vaccine 97.4%
20% better than Arkansas average

Arkansas average: 80.9%

Antipsychotic medication increase Info Percent of short-stay residents who newly received an antipsychotic medication 0.0%
100% better than Arkansas average

Arkansas average: 1.5%

Influenza Vaccine Info Percent of short-stay residents assessed and appropriately given the seasonal influenza vaccine 91.6%
18% better than Arkansas average

Arkansas average: 77.7%

Re-hospitalized after SNF stay Info Percentage of short-stay residents who were re-hospitalized after their nursing home admission. 22.3%
12% better than Arkansas average

Arkansas average: 25.2%

Emergency department visits Info Percentage of short-stay residents who had an outpatient emergency department visit. 12.4%
10% better than Arkansas average

Arkansas average: 13.8%

Falls with major injury Info Percentage of SNF residents who experience falls with major injury during their stay. 1.2%
55% worse than Arkansas average

Arkansas average: 0.8%

Ability to care for self at discharge Info Percentage of residents at or above expected ability to care for themselves at discharge. 41.8%
22% worse than Arkansas average

Arkansas average: 53.7%

Successful return to home or community Info Rate of successful return to home or community from a skilled nursing facility. 48.3%
In line with Arkansas average

Arkansas average: 50.6%

Breakdown by payment type

Medicare

26% of new residents, usually for short-term rehab.

Typical stay 1 - 2 months

Private pay

65% of new residents, often for short stays.

Typical stay 1 - 2 months

Medicaid

9% of new residents, often for long-term daily care.

Typical stay 2 years

Facility Characteristics

Source: CMS Long-Term Care Facility Characteristics (Data as of Jan 2026)

Total residents 83
Medicare
8
9.6% of residents
Medicaid
51
61.4% of residents
Private pay or other
24
28.9% of residents
Programs & Services
Residents Group

Residents meet regularly to discuss policies, care quality, and activities

Active Resident Council

Organized group of residents that meets regularly to discuss facility policies, quality of life, and activities.

Finances and operations

Based on CMS SNF Cost Report for fiscal year ending in 12/2023.

Voluntary non-profit community
Operated by a church.
Net patient revenue Info Net patient revenue — what the home actually collects for resident care, after contractual allowances, bad debt and discounts are subtracted from its gross charges (CMS cost report, Worksheet G-3). It covers resident care only; money the home earns from other sources is shown separately as "Other income."
$9.8M
Net patient income Info Net patient income: net patient revenue minus the home's total operating expenses. A positive figure means it earns more from resident care than it spends to deliver it; a negative figure means the opposite. It excludes non-operating "other income."
$987.6K
Voluntary non-profit community Operated by a church.
Net patient revenue Info Net patient revenue — what the home actually collects for resident care, after contractual allowances, bad debt and discounts are subtracted from its gross charges (CMS cost report, Worksheet G-3). It covers resident care only; money the home earns from other sources is shown separately as "Other income."
$9.8M
Net patient income Info Net patient income: net patient revenue minus the home's total operating expenses. A positive figure means it earns more from resident care than it spends to deliver it; a negative figure means the opposite. It excludes non-operating "other income."
$987.6K
Other income Info Money the home earns outside of resident care — such as investments, grants, rentals and other non-operating sources (CMS cost report, Worksheet G-3). It is tracked separately from net patient revenue: it is not part of that figure, and it is not included in net patient income.
$15.7K
Payroll costs Info Staff salaries plus wage-related costs — benefits such as payroll taxes, health insurance and retirement — from the home's own accounting records (CMS cost report, Worksheet A). Contract or agency labor is counted separately, under other operating costs.
$4.1M 42.2% of net patient revenue Info Payroll as a share of revenue: staff salaries and wage-related benefits divided by net patient revenue. A higher figure means more of each revenue dollar goes to staff pay.
Other operating costs Info Everything it costs to run the home apart from payroll — food, utilities, supplies, maintenance, contract labor and administration. Calculated as total operating expense minus payroll (staff salaries and wage-related benefits).
$4.7M
Total costs Info The home's total operating expense for the year — all the costs of running it, salaries included (CMS cost report, Worksheet G-3).
$8.8M

Who this home usually serves

TYPE OF STAY

Primarily short stays

Residents typically stay for brief periods, with frequent admissions and discharges throughout the year.

Most new residents arrive under private pay (65% of admissions), and a typical private pay stay runs around 1 - 2 months.

Admissions
264 total

Coverage residents most often arrive under.

Medicare 26%
Private pay 65%
Medicaid 9%
Discharges
263 total

Coverage residents most often leave under.

Medicare 29%
Private pay 62%
Medicaid 10%

Edgewood Health and Rehabilitation Reviews

James
Overall, I really like Edgewood. If they were to fire Tracy Jones, I would give them five stars!! Until then, one star is the only rating I can give them.What do you like most about living here? Answer: The nursing staff. Are there enough caregivers to handle the residents' needs, especially during emergencies? Answer: Yes Are the common areas pleasant and comfortable for socializing or relaxing? Answer: Yes How would you rate the quality and variety of the meals? (1-5) Answer: 4 Are special diets handled well? Answer: Yes Is the dining schedule flexible enough to meet your preferences? Answer: Yes How do you feel about the level of social interaction available with other residents? Answer: Very good 
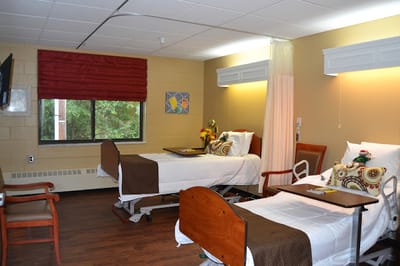
How was the units offered in this community? Answer: Private and semi private Do you feel safe living in this community? Answer: Yes How well do you think the community handles emergencies or unexpected events? Answer: Seems good Are there any hidden fees or unexpected charges? Answer: No Would you recommend this community to others looking for senior living options? Answer: Get rid of Tracy Jones and I will!! Is there anything you wish you knew before moving in? Answer: That an administrator like Tracy Jones was there!!

Places of interest near Edgewood Health and Rehabilitation

Address 3.2 miles from city center Info Estimated distance in miles from Springdale's city center to Edgewood Health and Rehabilitation's address, calculated via Google Maps. — 1.56 miles to nearest hospital (Kin Hood, MD)

Calculate Travel Distance to Edgewood Health and Rehabilitation

Add your location

Address

Compare Nursing Home around Springdale

The information below is reported by the Arkansas Department of Human Services, Office of Long Term Care.

5 facilities compared · CMS & AR Dept. of Health data

The Maples at Har-Ber Meadows
NH
MC
RC
Springdale
140
Facility 140
AR AVG 84
Rank #17 / 330
79.2% +11%4.83 -50%+3%$0235.81101-
18
Facility 18
AR AVG 34
Rank #302 / 419
John Mcpherson$13.6M$5.6M41.3%45407
​​Shiloh Health and Rehab
NH
RC
Springdale (Bethel Heights)
140
Facility 140
AR AVG 84
Rank #17 / 330
49.3% -31%4.23 -60%-9%$0144.7-69-
23
Facility 23
AR AVG 34
Rank #274 / 419
Denny Ledford$7.6M$4.0M52.1%45427
Edgewood Health and Rehabilitation
NH
MC
RC
Springdale
102
Facility 102
AR AVG 84
Rank #125 / 330
100.0% +40%4.56 -100%-2%$0184.5-167A+
37
Facility 37
AR AVG 34
Rank #179 / 419
Tracie Jones$9.8M$4.1M42.2%45428
Windcrest Health and Rehabilitation
NH
MC
RC
Springdale (Berryfield Apartments)
70
Facility 70
AR AVG 84
Rank #206 / 330
81.7% +15%5.05 -78%+8%$0297.3-56A+
29
Facility 29
AR AVG 34
Rank #240 / 419
Kimberly Burner$6.1M$3.0M49.2%45367
westwood-health-and-rehabilitation
NH
MC
RC
Springdale (South West End Street)
85
Facility 85
AR AVG 84
Rank #171 / 330
77.6% +9%5.10 -32%+9%$13.9k205.0260A+
78
Facility 78
AR AVG 34
Rank #4 / 419
Bilal Naeem$6.9M$3.4M49%45371

Financial Assistance for
Nursing Home in Arkansas

Edgewood Health and Rehabilitation is located in Springdale, Arkansas.
Here are the financial assistance programs available to residents in Arkansas.

Get Financial aid guidance

ARChoices

Arkansas Medicaid ARChoices

Age 65+ or 21+ with disability
General Arkansas resident, Medicaid- eligible, nursing home-level care need.
Income Limits (2025) ~$2,829/month 300% FBR, individual
Asset Limits $2,000 (individual), $3,000 (couple).
AR

Rural focus; possible waitlists.

Benefits
Personal care (5-7 hours/day) Meals ($7/meal) Respite care (240 hours/year) Adult day services ($60/day)

Choices in Living Resource Center

Arkansas Choices in Living

Age 60+
General Arkansas resident.
Income Limits No strict limit; prioritizes low-income.
Asset Limits Not applicable.
AR

Limited direct funding; mostly referral-based.

Benefits
Care coordination Limited respite (up to 5 days/year) Transportation assistance (~5 trips/month)

Living Choices Assisted Living Waiver

Arkansas Medicaid Living Choices Assisted Living Waiver

Age 65+
General Arkansas resident, requires nursing home-level care, lives in a Level II assisted living facility.
Income Limits (2025) ~$2,829/month 300% FBR, individual
Asset Limits $2,000 (individual), $3,000 (couple); spousal rules apply.
AR

Limited provider network; excludes Level I facilities (no nursing services).

Benefits
Personal care (~5 hours/day) Medication management Nursing Activities Transportation

Program of All-Inclusive Care for the Elderly (PACE)

Arkansas Medicaid PACE

Age 55+
General Arkansas resident, nursing home-level care, safe with PACE support.
Income Limits (2025) ~$2,829/month 300% FBR
Asset Limits $2,000 (individual), $3,000 (couple).
AR

Limited geographic availability.

Benefits
Primary/preventive care Personal care (5-7 hours/day) Meals Transportation Therapy

Arkansas State Plan Personal Care

Arkansas Medicaid Personal Care Program

Age
General Any age, Arkansas resident, needs ADL/IADL help, Medicaid-eligible.
Income Limits (2025) ~$1,004/month individual
Asset Limits $9,660 (individual), $14,470 (couple).
AR

No nursing home-level care requirement.

Benefits
Personal care (~4-6 hours/day) Homemaker services (e.g., meal prep)

Frequently Asked Questions about Edgewood Health and Rehabilitation

Who is the owner of Edgewood Health and Rehabilitation?

The legal owner and operator of Edgewood Health and Rehabilitation is CWNC OPS, Inc..

Is Edgewood Health and Rehabilitation in a walkable area?

Edgewood Health and Rehabilitation has a walk score of 37. Somewhat walkable. A few nearby services may be reachable on foot, but most trips require transportation.

What is the occupancy rate at Edgewood Health and Rehabilitation?

Edgewood Health and Rehabilitation's occupancy is 100%.

Who is the administrator of Edgewood Health and Rehabilitation?

Bob Martin is the administrator of Edgewood Health and Rehabilitation.

How many beds does Edgewood Health and Rehabilitation have?

Edgewood Health and Rehabilitation has 102 beds.

Are there photos of Edgewood Health and Rehabilitation?

Yes — there are 16 photos of Edgewood Health and Rehabilitation in the photo gallery on this page.

What is the phone number of Edgewood Health and Rehabilitation?

(479) 751-2390 will put you in contact with the team at Edgewood Health and Rehabilitation.

Guides for Better Senior Living

Care Cost Calculator: See Prices in Your Area

Nursing Home Data Explorer

Don’t Wait Too Long: 7 Red Flag Signs Your Parent Needs Assisted Living Now

The True Cost of Assisted Living in 2025 – And How Families Are Paying For It

Understanding Senior Living Costs: Pricing Models, Discounts & Financial Assistance