


Total health inspections
8
State average 6
Last Health inspection on Sep 2025
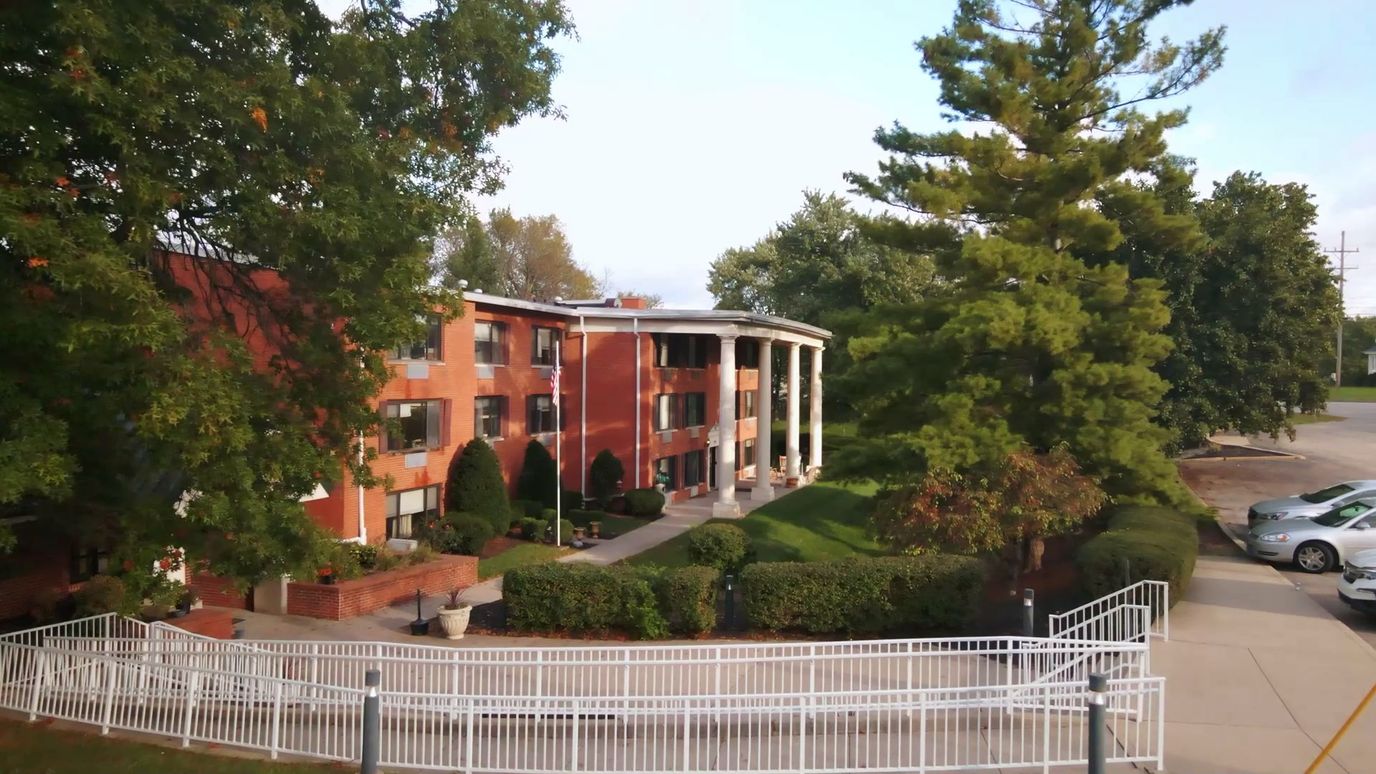


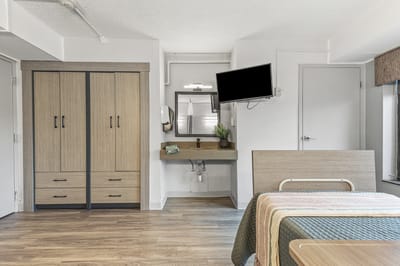


Under Envive Nursing Holdings’s ownership, Envive of Lawrenceburg is a newly opened skilled nursing and rehabilitation community in southeastern Indiana. Operated by Adams County Memorial Hospital at 403 Bielby Road in Lawrenceburg, the facility is administered by Keith Mckee and takes Medicare, Medicaid, and private pay. This means families have flexibility in how they arrange coverage for rehabilitation or ongoing nursing care. The 100-bed facility is built to support short-term recovery and longer-term care, averaging a stay length of roughly 121 days. This timeline reflects a mix of residents: those completing post-acute rehabilitation after hospitalization, those receiving ongoing skilled nursing, and some who shifted to longer placements. The community is found in a moderately walkable neighborhood (Walk Score 64), so it’s convenient for visiting families to navigate on foot for occasional errands and drop-ins.
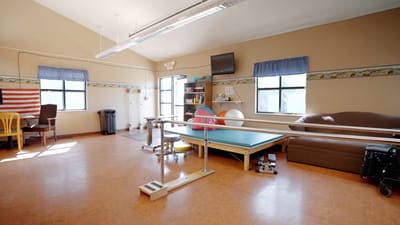
The home, clinically speaking, emphasizes rehabilitation and specialized nursing care. Its programs span post-surgical recovery, post-stroke rehabilitation, and respiratory therapies, including mechanical ventilator management and weaning. For residents with complex medical needs, the facility also offers IV therapy, bariatric care, and tracheotomy care. Physical, occupational, and speech therapy exist in-house, along with short-term respite options for families needing temporary care. A registered dietician develops therapeutic meal plans tailored to individual health needs, and the facility arranges transportation to medical appointments outside the home. Staffing supports this clinical focus: the facility provides roughly 2 hours and 55 minutes of total nursing care per resident day, with registered nurses, nurse aides, and LPN/LVNs distributed across shifts to maintain 24-hour coverage. This staffing pattern indicates a commitment to hands-on, direct care all the time.
State inspections have centered on life safety and emergency preparedness standards like egress and exit compliance, along with protocols for medication management and infection control during nursing operations.
Staffing hours
![]() Daily nursing hours per resident by staff type, reported to CMS. Higher is generally better — compare this facility to state and national averages to see where staffing stands.
Daily nursing hours per resident by staff type, reported to CMS. Higher is generally better — compare this facility to state and national averages to see where staffing stands.
Hours per resident per day vs Indiana averages
Total nursing care
![]() This home is ranked 221st out of 277 homes in Indiana for nurse hours. Total adjusted nursing hours per resident per day, combining RN, LPN, and aide time. CMS adjusts this for case-mix so facilities can be fairly compared.
This home is ranked 221st out of 277 homes in Indiana for nurse hours. Total adjusted nursing hours per resident per day, combining RN, LPN, and aide time. CMS adjusts this for case-mix so facilities can be fairly compared.
2h 55m
15% below state avg4 of 6 metrics below state avg
Envive of Lawrenceburg is legally operated by Adams County Memorial Hospital, and administered by Keith Mckee.
Key information about the people who lead and staff this community.
In Indiana, the Department of Health, Division of Long Term Care is the primary regulatory body that performs onsite inspections and quality of care reviews for all licensed facilities.
9 points below the Indiana average for nursing homes (83/100)
Rank #299 / 393 in Indiana Inspection Score — State benchmarked This home is ranked 299th out of 393 homes in Indiana for inspection score. Shows this facility's inspection score compared to the Indiana average among 393 comparable communities in the ranking pool. Facilities with the same value for a metric share the same rank. Rankings are based only on facilities in Indiana that report data for that category. Facilities without available data are excluded from the ranking. This is a proprietary Assisted Living Magazine score. Inspection score: 74 out of 100. Letter grade C. 9 points below the Indiana average for nursing homes (83/100)
Deficiencies
| This Facility | IN Average | vs. IN Avg |
|---|---|---|---|
|
Total deficiencies
| 104 | 36 | This facility has 189% more total deficiencies than a typical Indiana nursing home (104 vs. IN avg 36).↑ 189% worse |
|
Deficiencies per inspection
| 8.0 | 1.9 | This facility has 321% more deficiencies per inspection than a typical Indiana nursing home (8 vs. IN avg 1.9).↑ 321% worse |
Inspections
| This Facility | IN Average | vs. IN Avg |
|---|---|---|---|
|
Total visits
| 13 | 19 | This facility has had 32% fewer total visits than the Indiana average (13 vs. IN avg 19). More inspections can mean more regulatory scrutiny rather than worse care.↓ 32% fewer |
|
Inspections with deficiencies
| 13 | 7 | This facility has 86% more inspections with deficiencies than a typical Indiana nursing home (13 vs. IN avg 7).↑ 86% worse |
|
Inspection deficiency rate
| 100% | 37% | This facility has 63 percentage points higher inspection deficiency rate than a typical Indiana nursing home (100% vs. IN avg 37%).↑ 63% worse |
|
Inspections
| 13 | 13 | This facility has inspections in line with the Indiana average (13 vs. IN avg 13).— At avg |
Complaints & Investigations
| This Facility | IN Average | vs. IN Avg |
|---|---|---|---|
|
Total complaints
| 4 | 5 | This facility has 20% fewer total complaints than a typical Indiana nursing home (4 vs. IN avg 5).↓ 20% better |
|
Complaints per year
| 1.3 | 1.7 | This facility has 24% fewer complaints per year than a typical Indiana nursing home (1.3 vs. IN avg 1.7).↓ 24% better |
State average 6
Last Health inspection on Sep 2025
State average 25
State average 4.12
Health citations are formal notices following inspections when they fail to comply with safety and care standards.
22 of 28 citations resulted from standard inspections; and 6 of 28 resulted from complaint investigations.
State average: 0.2
State average: 0.6
Reporting period: October 1 – December 31, 2025 (Q4 2025). Source: CMS Payroll-Based Journal report.
Manages medical care and health needs.
Assists with medical care and medications.
Helps with daily care and mobility.
Total hours from contractors
1,115 contractor hours this quarter
| Certified Nursing Assistant | 19 | 18 | 37 | 8,717 | 92 | 100% | 9.3 |
| Licensed Practical Nurse | 9 | 24 | 33 | 4,541 | 92 | 100% | 8.7 |
| Registered Nurse | 6 | 5 | 11 | 1,841 | 92 | 100% | 10.8 |
| Other Dietary Services Staff | 2 | 0 | 2 | 955 | 83 | 90% | 8 |
| Clinical Nurse Specialist | 3 | 0 | 3 | 920 | 66 | 72% | 7.3 |
| Administrator | 1 | 0 | 1 | 512 | 64 | 70% | 8 |
| Nurse Practitioner | 1 | 0 | 1 | 512 | 64 | 70% | 8 |
| Mental Health Service Worker | 1 | 0 | 1 | 502 | 62 | 67% | 8.1 |
| Dietitian | 1 | 0 | 1 | 428 | 54 | 59% | 7.9 |
| Qualified Activities Professional | 1 | 0 | 1 | 40 | 8 | 9% | 5 |
| Feeding Assistant | 0 | 1 | 1 | 4 | 1 | 1% | 4 |
Federal penalties imposed by CMS for regulatory violations, including civil money penalties (fines) and denials of payment for new Medicare/Medicaid admissions.
Source: CMS Penalties Database
No penalties in the past 3 years
No civil money penalties or payment denials were reported in the last 3 years.
These measures show how residents usually do over time at this home, based on health outcomes and preventive care.
Indiana average: 8.0
Indiana average: 17.1
Indiana average: 12.0%
Indiana average: 14.4%
Indiana average: 24.6%
Indiana average: 3.9%
Indiana average: 4.4%
Indiana average: 1.2%
Indiana average: 5.7%
Indiana average: 24.1%
Indiana average: 12.4%
Indiana average: 93.7%
Indiana average: 95.4%
Indiana average: 1.60
Indiana average: 1.48
Indiana average: 81.7%
Indiana average: 1.4%
Indiana average: 79.0%
Indiana average: 22.4%
Indiana average: 10.5%
Indiana average: 0.8%
Quality measures are calculated from Minimum Data Set (MDS) assessments. For most measures, lower percentages indicate better care quality.
16% of new residents, usually for short-term rehab.
24% of new residents, often for short stays.
60% of new residents, often for long-term daily care.
Source: CMS Long-Term Care Facility Characteristics (Data as of Jan 2026)
Residents meet regularly to discuss policies, care quality, and activities
Organized group of residents that meets regularly to discuss facility policies, quality of life, and activities.
Data sourced from CMS Long-Term Care Facility Characteristics quarterly report. Payer mix reflects the current resident census by primary payment source.
Historical financial and operational data for Envive of Lawrenceburg from 2012–2023, based on CMS SNF Cost Reports.
Key figures below are for fiscal year ending in 12/2023.
Based on CMS SNF Cost Report for fiscal year ending in 12/2023.
Most residents stay for extended periods and receive ongoing daily care.
Most new residents arrive under Medicaid (60% of admissions), and a typical Medicaid stay runs around 4 - 5 months.
Coverage residents most often arrive under.
Coverage residents most often leave under.
![]() 0.0 miles from city center
0.0 miles from city center
![]() Estimated distance in miles from Lawrenceburg's city center to Envive of Lawrenceburg's address, calculated via Google Maps.
Estimated distance in miles from Lawrenceburg's city center to Envive of Lawrenceburg's address, calculated via Google Maps.
Add your location
Info below is compiled from CMS reports & the IN Dept. of Health (IDOH), senior community websites & trusted data sources such as Walk Score & BBB.
Communities are listed from highest to lowest based on our ranking methodology.
| The Barrington of Carmel | NH AL IL MC SNF | Carmel | 154
Facility
154
IN AVG
116
Rank
#82 / 432 |
71.4%
Facility
71.4%
IN AVG
65.3
Rank
#174 / 422 | +9% | 9.22
Facility
9.22
IN AVG
3.44
Rank
#1 / 277 | -61% | +168% | $0
Facility
$0
IN AVG
$31.4k
Rank
#1 / 279 | 95
Facility
95
IN AVG
83
Rank
#41 / 393 | 5
Facility
5
IN AVG
25.0
Rank
#11 / 279 | 2.5
Facility
2.5
IN AVG
4.1
Rank
#51 / 279 | - | 110 | A+ |
39
Facility
39
IN AVG
40
Rank
#275 / 552 | Bhi Retirement Communities Inc | $17.0MFiscal year ending 12/2023
Facility
$17.0MFiscal year ending 12/2023
IN AVG
$10.5M
Rank
#24 / 268 | $6.9MFiscal year ending 12/2023
Facility
$6.9MFiscal year ending 12/2023
IN AVG
$5.2M
Rank
#54 / 268 | 40.6%Fiscal year ending 12/2023
Facility
40.6%Fiscal year ending 12/2023
IN AVG
51.1%
Rank
#225 / 268 | 155817 | ||||
| Westminster Village Muncie | NH AL IL SNF | Muncie | 303
Facility
303
IN AVG
116
Rank
#5 / 432 |
83.8%
Facility
83.8%
IN AVG
65.3
Rank
#75 / 422 | +28% | 4.72
Facility
4.72
IN AVG
3.44
Rank
#23 / 277 | +3% | +37% | $0
Facility
$0
IN AVG
$31.4k
Rank
#1 / 279 | 93
Facility
93
IN AVG
83
Rank
#63 / 393 | 12
Facility
12
IN AVG
25.0
Rank
#50 / 279 | 3.0
Facility
3.0
IN AVG
4.1
Rank
#80 / 279 | - | 254 | A+ |
6
Facility
6
IN AVG
40
Rank
#509 / 552 | Mary Crutcher | $14.5MFiscal year ending 06/2024
Facility
$14.5MFiscal year ending 06/2024
IN AVG
$10.5M
Rank
#51 / 268 | $10.2MFiscal year ending 06/2024
Facility
$10.2MFiscal year ending 06/2024
IN AVG
$5.2M
Rank
#14 / 268 | 70.4%Fiscal year ending 06/2024
Facility
70.4%Fiscal year ending 06/2024
IN AVG
51.1%
Rank
#13 / 268 | 155170 | ||||
| Christian Care Retirement Community | NH AL IL MC SNF | Bluffton (Toll Gate Heights) | 145
Facility
145
IN AVG
116
Rank
#101 / 432 |
40.0%
Facility
40.0%
IN AVG
65.3
Rank
#386 / 422 | -39% | 5.53
Facility
5.53
IN AVG
3.44
Rank
#9 / 277 | +7% | +61% | $0
Facility
$0
IN AVG
$31.4k
Rank
#1 / 279 | 98
Facility
98
IN AVG
83
Rank
#11 / 393 | 2
Facility
2
IN AVG
25.0
Rank
#2 / 279 | 1.0
Facility
1.0
IN AVG
4.1
Rank
#1 / 279 | - | 58 | - |
4
Facility
4
IN AVG
40
Rank
#527 / 552 | Leon Gerber | $6.9MFiscal year ending 12/2023
Facility
$6.9MFiscal year ending 12/2023
IN AVG
$10.5M
Rank
#198 / 268 | $5.7MFiscal year ending 12/2023
Facility
$5.7MFiscal year ending 12/2023
IN AVG
$5.2M
Rank
#87 / 268 | 83.2%Fiscal year ending 12/2023
Facility
83.2%Fiscal year ending 12/2023
IN AVG
51.1%
Rank
#5 / 268 | 155701 | ||||
| Stonecroft Health Campus | NH ADC AL MC RC SNF | Bloomington | 124
Facility
124
IN AVG
116
Rank
#157 / 432 |
84.7%
Facility
84.7%
IN AVG
65.3
Rank
#68 / 422 | +30% | 3.59
Facility
3.59
IN AVG
3.44
Rank
#88 / 277 | +18% | +4% | $0
Facility
$0
IN AVG
$31.4k
Rank
#1 / 279 | 92
Facility
92
IN AVG
83
Rank
#73 / 393 | 4
Facility
4
IN AVG
25.0
Rank
#7 / 279 | 2.0
Facility
2.0
IN AVG
4.1
Rank
#24 / 279 | - | 105 | A+ |
9
Facility
9
IN AVG
40
Rank
#473 / 552 | Daviess County Hospital | $10.6MFiscal year ending 12/2023
Facility
$10.6MFiscal year ending 12/2023
IN AVG
$10.5M
Rank
#115 / 268 | $5.2MFiscal year ending 12/2023
Facility
$5.2MFiscal year ending 12/2023
IN AVG
$5.2M
Rank
#112 / 268 | 49.7%Fiscal year ending 12/2023
Facility
49.7%Fiscal year ending 12/2023
IN AVG
51.1%
Rank
#132 / 268 | 155838 | ||||
| Envive of Lawrenceburg | NH HOS RC SNF | Lawrenceburg | 100
Facility
100
IN AVG
116
Rank
#235 / 432 | - | - | 2.92
Facility
2.92
IN AVG
3.44
Rank
#221 / 277 | +22% | -15% | $0
Facility
$0
IN AVG
$31.4k
Rank
#1 / 279 | 74
Facility
74
IN AVG
83
Rank
#299 / 393 | 28
Facility
28
IN AVG
25.0
Rank
#178 / 279 | 3.5
Facility
3.5
IN AVG
4.1
Rank
#119 / 279 | 3 | 9 | - |
64
Facility
64
IN AVG
40
Rank
#115 / 552 | Envive Nursing Holdings, LLC | $7.0MFiscal year ending 12/2023
Facility
$7.0MFiscal year ending 12/2023
IN AVG
$10.5M
Rank
#196 / 268 | $3.7MFiscal year ending 12/2023
Facility
$3.7MFiscal year ending 12/2023
IN AVG
$5.2M
Rank
#181 / 268 | 53.5%Fiscal year ending 12/2023
Facility
53.5%Fiscal year ending 12/2023
IN AVG
51.1%
Rank
#99 / 268 | 155061 |
Bonnie Burnham is the Director of Nursing at Envive of Lawrenceburg.
Envive of Lawrenceburg is legally operated by Adams County Memorial Hospital, and administered by Keith McKee.
Envive of Lawrenceburg has a walk score of 64. Moderately walkable. Some errands can be accomplished on foot, with a mix of nearby amenities.
According to IN state health department records, Envive of Lawrenceburg's license number is 24-000022-1.
According to IN state health department records, Envive of Lawrenceburg's license expires on November 30, 2026.
Envive of Lawrenceburg's occupancy is 42%.
Envive of Lawrenceburg has been operating for approximately 1 year, based on available licensing and registration records.
Care Cost Calculator: See Prices in Your Area
Nursing Home Data Explorer
Don’t Wait Too Long: 7 Red Flag Signs Your Parent Needs Assisted Living Now
The True Cost of Assisted Living in 2025 – And How Families Are Paying For It
Understanding Senior Living Costs: Pricing Models, Discounts & Financial Assistance


