Father Murray, a Villa Center
Nursing Home, Hospice Care & Palliative Care · Warren, MI
CMS overall rating Info CMS (the Centers for Medicare & Medicaid Services) is the federal agency that rates nursing home quality. Its Overall Rating runs from 1 to 5 stars, combining health inspections, staffing, and quality measures, with inspections weighted most heavily.

Father Murray, a Villa Center

Nursing Home, Hospice Care & Palliative Care · Warren, MI
CMS overall rating Info CMS (the Centers for Medicare & Medicaid Services) is the federal agency that rates nursing home quality. Its Overall Rating runs from 1 to 5 stars, combining health inspections, staffing, and quality measures, with inspections weighted most heavily.
Calculator: See prices in your area
Father Murray, a Villa Center accepts Medicare, Medicaid, and private pay.

Overview of Father Murray, a Villa Center

Father Murray, a Villa Center, located in Warren, Michigan, is a leading healthcare institution with a commitment to excellence woven into every facet of care. Specializing in post-acute and long-term healthcare, alongside an array of specialized clinical services, this assisted living community is a beacon of unparalleled medical dedication.
Experience the difference at Father Murray, where excellence is the foundation of care. This center’s unwavering mission transcends the ordinary, aiming not only to provide senior  care but to surpass expectations. This dedication extends to every individual within the Father Murray community — from cherished guests to devoted families and dedicated staff. A spirit of continuous improvement prevails, fostering healing and well-being within a welcoming setting. Father Murray Villa empowers transformation and progress, ultimately enhancing the lives of senior residents.

Quality ratings

Measured by Centers for Medicare & Medicaid Services (CMS)

Overall rating Info The Overall CMS Rating combines results from health inspections, staffing levels and quality measures. Health inspections carry the most weight. Staffing and quality scores can increase or decrease the final rating based on performance compared to state and national standards.
▼ 36.3% Below MI avg. ▼ 36.3% Below MI avg.MI average: 3.1Click the badge to see the full State ranking.Click here to see the full State ranking.
Health Inspection Info Based on the results of the facility's three most recent standard inspections and any complaint investigations. CMS reviews the number, scope, and severity of deficiencies, with more recent findings weighted more heavily.
▼ 29.3% Below MI avg. ▼ 29.3% Below MI avg.MI average: 2.8Click the badge to see the full State ranking.Click here to see the full State ranking.
Staffing Info Measures average nursing staff hours per resident per day, including Registered Nurses (RNs) and total nursing staff. Ratings are adjusted based on the level of care residents require and are compared to state and national benchmarks.
▼ 42.8% Below MI avg. ▼ 42.8% Below MI avg.MI average: 3.5Click the badge to see the full State ranking.Click here to see the full State ranking.
Quality Measures Info Based on clinical and physical health indicators reported to CMS, such as hospital readmissions, falls, pressure ulcers, and improvements in mobility. These measures reflect how well residents' health needs are being managed.
▲ 6.4% Above MI avg. ▲ 6.4% Above MI avg.MI average: 3.8Click the badge to see the full State ranking.Click here to see the full State ranking.

Staffing hours breakdown

Info Daily nursing hours per resident by staff type, reported to CMS. Higher is generally better — compare this facility to state and national averages to see where staffing stands.

Hours per resident per day — compared to Michigan state averages

Total nursing care / resident Info This home is ranked 77th out of 142 homes in Michigan for nurse hours. Total adjusted nursing hours per resident per day, combining RN, LPN, and aide time. CMS adjusts this for case-mix so facilities can be fairly compared.
3h 51m per day
Rank #77 / 142Nurse hours — State benchmarkedThis home is ranked 77th out of 142 homes in Michigan. Shows adjusted nurse hours per resident per day benchmarked to the Michigan average, with a ranking across 142 Michigan facilities. More hours mean more direct care. The national average is about 3.5 hrs; below 3.0 is a red flag.Rankings are based only on facilities in Michigan that report data for that category. Facilities without available data are excluded from the ranking.Click the rank badge to see the full State ranking.Click here to see the full State ranking.
This facility Michigan avg (4h 18m per day)
vs Michigan avg
-10%

5 of 6 metrics below state avg

Standout metric LPN / LVN is +33% above state avg
Staff typeHours / Day / Residentvs state avg
Registered Nurse (RN) Info RNs hold the highest nursing license and can assess residents, interpret test results, and direct care plans. More RN hours per day often signals stronger clinical oversight and faster response to health changes. 11m per day ▼ 77% State avg: 46m per day · National avg: 41m per day
LPN / LVN Info Licensed Practical Nurses (LPNs) or Licensed Vocational Nurses (LVNs) deliver routine hands-on care — medication administration, wound dressing, and monitoring vital signs. They work under RN supervision and make up a large share of daily bedside care. 1h 11m per day ▲ 33% State avg: 53m per day · National avg: 52m per day
Nurse Aide Info Certified Nurse Aides (CNAs) provide the most direct day-to-day assistance: bathing, dressing, feeding, and mobility. Nurse aide hours are typically the largest staffing category and directly affect residents' quality of life. 1h 52m per day ▼ 20% State avg: 2h 20m per day · National avg: 2h 20m per day
Weekend Total Nursing Info Combined nursing hours (RN + LPN + Nurse Aide) per resident per day on weekends. Staffing often drops on weekends — this figure reveals whether the facility maintains adequate coverage outside of weekday hours. 2h 58m per day ▼ 15% State avg: 3h 31m per day · National avg: 3h 27m per day
Physical Therapist Info Hours per resident per day provided by licensed Physical Therapists (PTs) or PT Assistants. PT services help residents recover mobility after injury or illness and are especially important for post-acute (short-stay) rehabilitation. 1m per day ▼ 70% State avg: 4m per day · National avg: 4m per day
Weekend RN Info Registered nurse hours specifically on weekends. Facilities sometimes reduce RN presence on Saturdays and Sundays — a low weekend RN figure compared to weekday hours can indicate reduced clinical oversight when most administrative staff are absent. 5m per day ▼ 84% State avg: 29m per day · National avg: 29m per day

Capacity and availability

High-capacity home

May provide extensive amenities, services and programs.

Total beds 231

This home usually has limited availability

Higher occupancy than the Michigan average: 75.8%
Occupancy rate
88.9% Rank #38 / 395Occupancy rate — State benchmarkedThis home is ranked 38th out of 395 homes in Michigan. Shows this facility's occupancy rate versus the Michigan average, with its Statewide rank out of 395. Higher occupancy signals strong local demand and financial stability.Rankings are based only on facilities in Michigan that report data for that category. Facilities without available data are excluded from the ranking.Click the rank badge to see the full State ranking.Click here to see the full State ranking.
Avg. Length of Stay
153 days
Walk Score
Walk Score: 67 / 100 Rank #88 / 703Walk Score — State benchmarkedThis home is ranked 88th out of 703 homes in Michigan. Shows how walkable this facility's neighborhood is compared to the average Walk Score across Michigan facilities. Higher scores benefit residents, families, and staff.Rankings are based only on facilities in Michigan that report data for that category. Facilities without available data are excluded from the ranking.Click the rank badge to see the full State ranking.Click here to see the full State ranking.
Moderately walkable. Some errands can be accomplished on foot, with a mix of nearby amenities.

Therapy & Rehabilitation

1 service
Rehabilitation Services

Additional Services

1 service
Clinical Rehabilitation

Amenities & Lifestyle

Laundry Service
Pet Visitation
Holiday Celebrations
Reading Materials
Premium Tv
Free Wifi
Spa/Cosmetology Services
In-Room Wifi
Guest Entertainment
Fine Dining
Fitness Center
Specific ProgramsBariatric Rehabilitation Care, Cardiac Care, Medically Complex and Post-Surgical Care, Orthopedic Rehabilitation Therapy, Palliative and Hospice Care, Pharmacy Management, Post-Discharge Follow-Up, Pulmonary and Respiratory Care, Transition Management

Contact Father Murray, a Villa Center

Penalties and fines

Federal penalties imposed by CMS for regulatory violations, including civil money penalties (fines) and denials of payment for new Medicare/Medicaid admissions.

Source: CMS Penalties Database

No penalties in the past 3 years

No civil money penalties or payment denials were reported in the last 3 years.

Breakdown by payment type

Medicare

14% of new residents, usually for short-term rehab.

Typical stay 1 - 2 months

Private pay

51% of new residents, often for short stays.

Typical stay 2 - 3 months

Medicaid

35% of new residents, often for long-term daily care.

Typical stay 1 years

Finances and operations

Based on CMS SNF Cost Report for fiscal year ending in 12/2023.

For-profit
Corporation
Net patient revenue Info Net patient revenue — what the home actually collects for resident care, after contractual allowances, bad debt and discounts are subtracted from its gross charges (CMS cost report, Worksheet G-3). It covers resident care only; money the home earns from other sources is shown separately as "Other income."
$20.9M
Net patient income Info Net patient income: net patient revenue minus the home's total operating expenses. A positive figure means it earns more from resident care than it spends to deliver it; a negative figure means the opposite. It excludes non-operating "other income."
-$1.4M
For-profit Corporation
Net patient revenue Info Net patient revenue — what the home actually collects for resident care, after contractual allowances, bad debt and discounts are subtracted from its gross charges (CMS cost report, Worksheet G-3). It covers resident care only; money the home earns from other sources is shown separately as "Other income."
$20.9M Rank #25 / 143Revenue — State benchmarkedThis home is ranked 25th out of 143 homes in Michigan. Shows this facility's annual revenue compared to the Michigan average. Higher revenue generally means more resources for staffing and capital — read alongside Payroll %.Rankings are based only on facilities in Michigan that report data for that category. Facilities without available data are excluded from the ranking.Click the rank badge to see the full State ranking.Click here to see the full State ranking.
Net patient income Info Net patient income: net patient revenue minus the home's total operating expenses. A positive figure means it earns more from resident care than it spends to deliver it; a negative figure means the opposite. It excludes non-operating "other income."
-$1.4M
Other income Info Money the home earns outside of resident care — such as investments, grants, rentals and other non-operating sources (CMS cost report, Worksheet G-3). It is tracked separately from net patient revenue: it is not part of that figure, and it is not included in net patient income.
$1.3M
Payroll costs Info Staff salaries plus wage-related costs — benefits such as payroll taxes, health insurance and retirement — from the home's own accounting records (CMS cost report, Worksheet A). Contract or agency labor is counted separately, under other operating costs. Rank #40 / 143Payroll — State benchmarkedThis home is ranked 40th out of 143 homes in Michigan. Shows total annual staff payroll benchmarked to the Michigan average. Higher payroll investment relative to peers often signals better staffing and less reliance on cheaper contract labor.Rankings are based only on facilities in Michigan that report data for that category. Facilities without available data are excluded from the ranking.Click the rank badge to see the full State ranking.Click here to see the full State ranking.
$9.8M 46.6% of net patient revenue Info Payroll as a share of revenue: staff salaries and wage-related benefits divided by net patient revenue. A higher figure means more of each revenue dollar goes to staff pay. Rank #106 / 143Payroll % — State benchmarkedThis home is ranked 106th out of 143 homes in Michigan. Shows payroll as a percentage of revenue versus the Michigan average. Well-run Michigan facilities typically land around 49–59% — the top third Statewide. Below 25% may signal understaffing or heavy agency use — read with Staffing ratings.Rankings are based only on facilities in Michigan that report data for that category. Facilities without available data are excluded from the ranking.Click the rank badge to see the full State ranking.Click here to see the full State ranking.
Other operating costs Info Everything it costs to run the home apart from payroll — food, utilities, supplies, maintenance, contract labor and administration. Calculated as total operating expense minus payroll (staff salaries and wage-related benefits).
$12.6M
Total costs Info The home's total operating expense for the year — all the costs of running it, salaries included (CMS cost report, Worksheet G-3).
$22.3M

Who this home usually serves

TYPE OF STAY

Mostly long-term care residents

Most residents stay for extended periods and receive ongoing daily care.

Most new residents arrive under private pay (51% of admissions), and a typical private pay stay runs around 2 - 3 months.
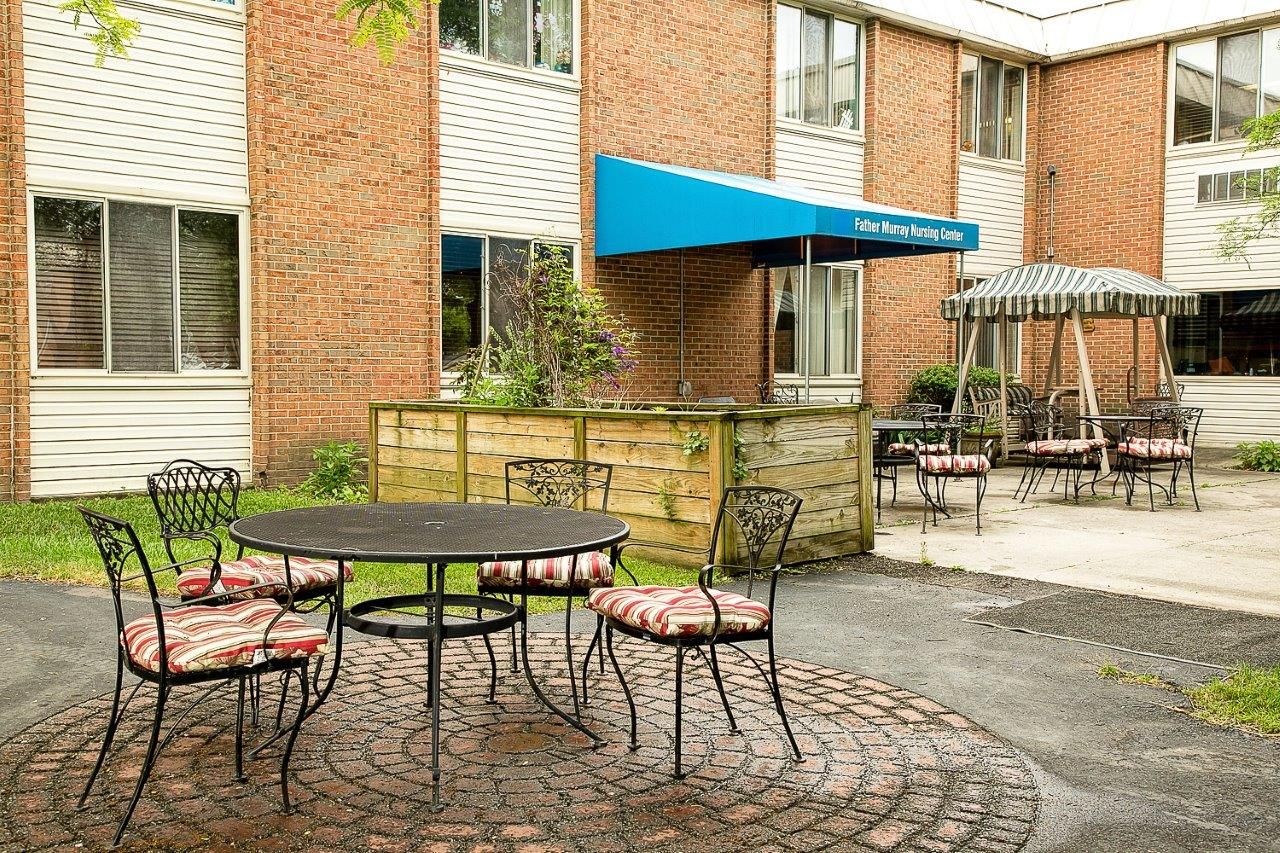
Admissions
442 total

Coverage residents most often arrive under.

Medicare 14%
Private pay 51%
Medicaid 35%
Discharges
490 total

Coverage residents most often leave under.

Medicare 8%
Private pay 47%
Medicaid 45%

Compare Nursing Homes around Warren

The information below is reported by the Michigan Department of Licensing and Regulatory Affairs (LARA).

4 facilities compared · CMS & MI Dept. of Health data

St. Anthony Healthcare Center
NH
HC
MC
NC
PC
RC
Warren
142
Facility 142
MI AVG 75
Rank #40 / 435
91.8%
Facility 91.8%
MI AVG 75.8%
Rank #22 / 395
+21%
3.94
Facility 3.94
MI AVG 4.30
Rank #77 / 142
-55%-8%
$0
Facility $0
MI AVG $87.6k
Rank #1 / 145
18
Facility 18
MI AVG 33.5
Rank #34 / 144
3.0
Facility 3.0
MI AVG 5.2
Rank #16 / 144
2130-
61
Facility 61
MI AVG 39
Rank #125 / 703
Erin Ledington
$19.3M
Facility $19.3M
MI AVG $15.8M
Rank #9 / 143
$9.8M
Facility $9.8M
MI AVG $5.6M
Rank #24 / 143
50.7%
Facility 50.7%
MI AVG 39%
Rank #124 / 143
235408
Villa at City Center
NH
MC
PC
Warren
152
Facility 152
MI AVG 75
Rank #31 / 435
90.6%
Facility 90.6%
MI AVG 75.8%
Rank #29 / 395
+20%
3.77
Facility 3.77
MI AVG 4.30
Rank #94 / 142
-53%-12%
$8.5k
Facility $8.5k
MI AVG $87.6k
Rank #87 / 145
45
Facility 45
MI AVG 33.5
Rank #102 / 144
5.6
Facility 5.6
MI AVG 5.2
Rank #85 / 144
4144-
59
Facility 59
MI AVG 39
Rank #137 / 703
-
$17.3M
Facility $17.3M
MI AVG $15.8M
Rank #41 / 143
$7.6M
Facility $7.6M
MI AVG $5.6M
Rank #57 / 143
44.1%
Facility 44.1%
MI AVG 39%
Rank #126 / 143
235325
Windemere Park of Warren
NH
AL
HC
IL
MC
RC
Warren
92
Facility 92
MI AVG 75
Rank #156 / 435
53.3%
Facility 53.3%
MI AVG 75.8%
Rank #184 / 395
-30%
4.30
Facility 4.30
MI AVG 4.30
Rank #46 / 142
-40%0%
$0
Facility $0
MI AVG $87.6k
Rank #1 / 145
22
Facility 22
MI AVG 33.5
Rank #50 / 144
4.4
Facility 4.4
MI AVG 5.2
Rank #55 / 144
-55A+
48
Facility 48
MI AVG 39
Rank #232 / 703
Windemere Group LLC
$9.1M
Facility $9.1M
MI AVG $15.8M
Rank #104 / 143
$4.3M
Facility $4.3M
MI AVG $5.6M
Rank #112 / 143
47.9%
Facility 47.9%
MI AVG 39%
Rank #93 / 143
235714
The Orchards Michigan – Warren
NH
AL
Warren
134
Facility 134
MI AVG 75
Rank #51 / 435
89.5%
Facility 89.5%
MI AVG 75.8%
Rank #36 / 395
+18%
3.78
Facility 3.78
MI AVG 4.30
Rank #94 / 142
-48%-12%
$21.3k
Facility $21.3k
MI AVG $87.6k
Rank #97 / 145
36
Facility 36
MI AVG 33.5
Rank #84 / 144
5.1
Facility 5.1
MI AVG 5.2
Rank #76 / 144
3122-
49
Facility 49
MI AVG 39
Rank #223 / 703
Warren Snf Holdco LLC
$14.6M
Facility $14.6M
MI AVG $15.8M
Rank #77 / 143
$5.8M
Facility $5.8M
MI AVG $5.6M
Rank #78 / 143
39.7%
Facility 39.7%
MI AVG 39%
Rank #64 / 143
235509

Financial Assistance for
Nursing Home in Michigan

Father Murray, a Villa Center is located in Warren, Michigan.
Here are the financial assistance programs available to residents in Michigan.

Get Financial aid guidance

MI Choice Waiver

Michigan Medicaid MI Choice Waiver

Age 65+ or disabled
General Michigan resident, Medicaid- eligible, nursing home-level care need.
Income Limits (2025) ~$2,829/month 300% FBR, individual
Asset Limits $2,000 (individual), $3,000 (couple).
MI

Delivered through regional waiver agents; waitlists possible.

Benefits
Personal care (5-7 hours/day) Respite care (240 hours/year) Home modifications ($1,500 avg.) Adult day care ($65/day)

Home Help Program

Michigan Home Help

Age 65+ or disabled
General Michigan resident, Medicaid- eligible or low-income.
Income Limits ~$1,732/month individual, Medicaid threshold
Asset Limits $2,000 individual
MI

Can hire family caregivers; less intensive than waiver.

Benefits
Personal care (up to 60 hours/month) Homemaker services Respite (varies)

Program of All-Inclusive Care for the Elderly (PACE)

Michigan PACE

Age 55+
General Michigan resident, nursing home-level care need, safe with PACE support.
Income Limits (2025) ~$2,829/month (Medicaid-eligible); private pay option available.
Asset Limits $2,000 (individual), $3,000 (couple).
MI

16 PACE centers (e.g., Ingham, Wayne counties); expanding slowly.

Benefits
Personal care (5-7 hours/day) Medical care Meals Transportation Therapy Respite

Medicare Savings Program (MSP)

Michigan Medicare Savings Program

Age 65+ or disabled
General Michigan resident, Medicare Part A/B.
Income Limits (2025) ~$2,510/month (QMB), ~$3,380/month (SLMB), ~$3,598/month (QI)—individual.
Asset Limits $9,430 (individual), $14,130 (couple).
MI

Three tiers; no waitlist; includes Extra Help for Part D.

Benefits
Covers Part B premiums ($174.70/month) Deductibles ($240/year) Copays (~20%)

National Family Caregiver Support Program (NFCSP) Respite

Michigan NFCSP Respite Care

Age
General Caregivers of 60+ needing care or 55+ caregivers of others; Michigan resident; functional needs (2+ ADLs).
Income Limits (2025) Prioritizes ~$24,980/year (individual); no strict cap.
Asset Limits Not assessed; need-based.
MI

16 AAAs; prioritizes low-income, rural caregivers.

Benefits
Respite (4-6 hours/week or 5 days/year) Adult day care ($60/day) Caregiver training

VA Aid and Attendance (A&A) and Housebound Benefits

Michigan VA Aid and Attendance/Housebound

Age 65+ or disabled veteran/spouse
General Michigan resident, wartime service, need for ADL help (A&A) or homebound.
Income Limits (2025) Net income < ~$1,984/month (veteran with dependent, A&A); pension offsets income.
Asset Limits ~$155,356 net worth limit
MI

High veteran demand in urban/rural areas.

Benefits
Cash (~$1,433-$2,642/month veteran, ~$951-$1,318 spouse) for care costs

Frequently Asked Questions about Father Murray, a Villa Center

Is Father Murray, a Villa Center in a walkable area?

Father Murray, a Villa Center has a walk score of 67. Moderately walkable. Some errands can be accomplished on foot, with a mix of nearby amenities.

What is the occupancy rate at Father Murray, a Villa Center?

Father Murray, a Villa Center's occupancy is 88.9%.

Does Father Murray, a Villa Center operate as a for-profit or non-profit?

Father Murray, a Villa Center is registered as a for-profit.

Are there photos of Father Murray, a Villa Center?

Yes — there is 1 photo of Father Murray, a Villa Center in the photo gallery on this page.

What is the phone number of Father Murray, a Villa Center?

(586) 755-2400 will put you in contact with the team at Father Murray, a Villa Center.

Is Father Murray, a Villa Center Medicare or Medicaid certified?

Father Murray, a Villa Center is not currently listed as a CMS-certified provider of Medicare or Medicaid.

Guides for Better Senior Living

Care Cost Calculator: See Prices in Your Area

Nursing Home Data Explorer

Don’t Wait Too Long: 7 Red Flag Signs Your Parent Needs Assisted Living Now

The True Cost of Assisted Living in 2025 – And How Families Are Paying For It

Understanding Senior Living Costs: Pricing Models, Discounts & Financial Assistance