


Total staff
94
Employees
91
Contractors
3
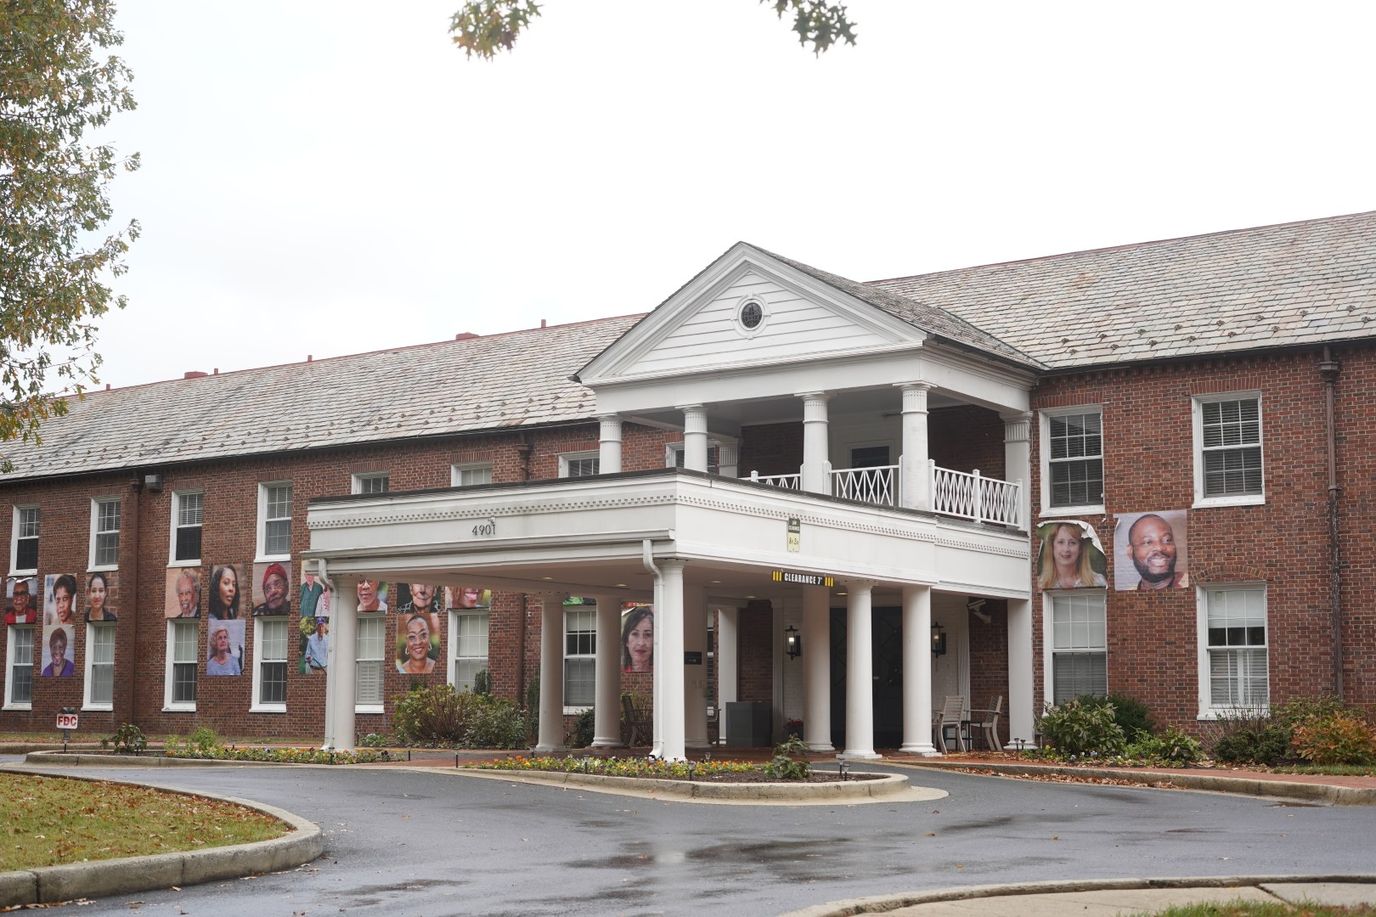
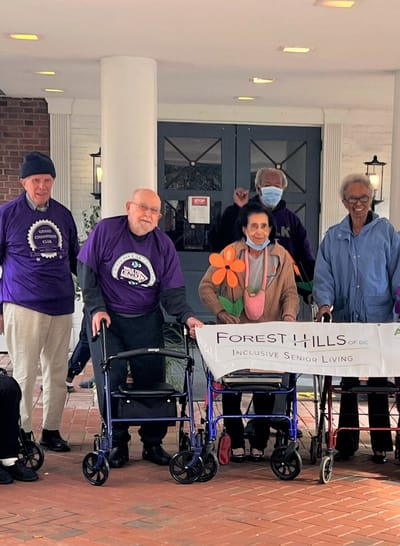
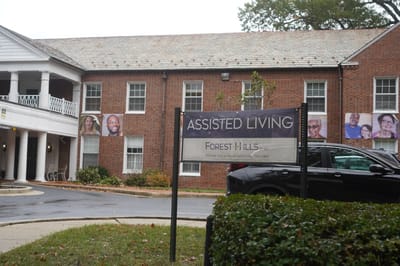
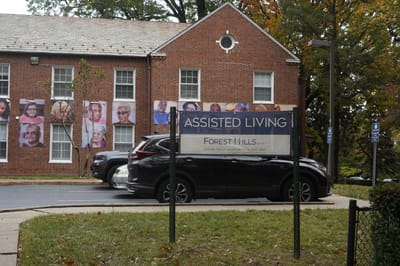
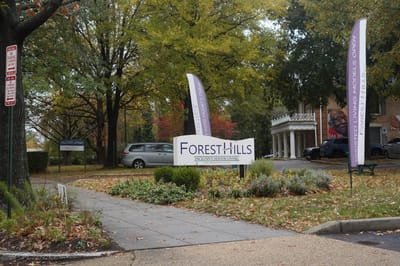
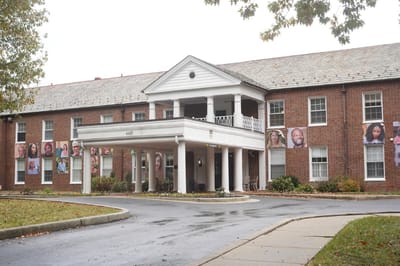
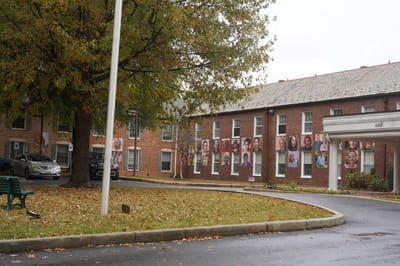


Forest Hills of Dc is an inclusive senior living community located at the southwest corner outside Linnean Park in Washington D.C. They offer assisted living, skilled nursing services and long-term care, Alzheimer’s assisted living with memory care, and respite care for short-term rehabilitation. Their assisted living levels of care is tailored specifically on the resident’s need and is divided into two; traditional assisted living for active seniors, and intensive assisted living for seniors experiencing functional limitations or decline.
Forest Hills of Dc has a lot to offer to its residents such as; social activities, wellness programs, outdoor activities, 24/7 nursing assistance, medication management, and social service consultation. Also, the residents receive meal provisions, onsite physical, occupational, and speech therapy, housekeeping, and grooming services. This senior community also makes sure that the residents have access to devotional activities, to fulfill not just the senior’s physical needs, but also the needs of their mind and spirit.
| Staff type | Hours / Day / Resident | vs state avg |
|---|---|---|
|
Registered Nurse (RN)
| 1h 31m per day | ▼ 13% State avg: 1h 45m per day · National avg: 41m per day |
|
LPN / LVN
| 25m per day | ▼ 26% State avg: 34m per day · National avg: 52m per day |
|
Nurse Aide
| 2h 40m per day | ▲ 5% State avg: 2h 33m per day · National avg: 2h 20m per day |
|
Weekend Total Nursing
| 4h 35m per day | ▲ 6% State avg: 4h 21m per day · National avg: 3h 26m per day |
|
Physical Therapist
| 8m per day | ▲ 33% State avg: 6m per day · National avg: 4m per day |
|
Weekend RN
| 1h 15m per day | ▼ 10% State avg: 1h 23m per day · National avg: 28m per day |
Reporting period: October 1 – December 31, 2025 (Q4 2025). Source: CMS Payroll-Based Journal report.
Manages medical care and health needs.
Assists with medical care and medications.
Helps with daily care and mobility.
Total hours from contractors
118 contractor hours this quarter
| Certified Nursing Assistant | 36 | 0 | 36 | 12,428 | 92 | 100% | 7.6 |
| Registered Nurse | 21 | 0 | 21 | 6,920 | 92 | 100% | 9.3 |
| Other Dietary Services Staff | 11 | 0 | 11 | 2,710 | 92 | 100% | 7.3 |
| Licensed Practical Nurse | 5 | 2 | 7 | 1,637 | 86 | 93% | 12 |
| Respiratory Therapy Technician | 4 | 0 | 4 | 771 | 69 | 75% | 5.8 |
| Nurse Practitioner | 3 | 0 | 3 | 666 | 59 | 64% | 8.1 |
| Administrator | 2 | 0 | 2 | 447 | 51 | 55% | 8.8 |
| Dietitian | 2 | 0 | 2 | 440 | 65 | 71% | 4.8 |
| Mental Health Service Worker | 1 | 0 | 1 | 427 | 56 | 61% | 7.6 |
| Physical Therapy Aide | 2 | 0 | 2 | 383 | 59 | 64% | 5.7 |
| Speech Language Pathologist | 1 | 0 | 1 | 360 | 61 | 66% | 5.9 |
| Physical Therapy Assistant | 2 | 0 | 2 | 191 | 38 | 41% | 5 |
| Qualified Social Worker | 1 | 0 | 1 | 83 | 16 | 17% | 5.2 |
| Medical Director | 0 | 1 | 1 | 70 | 26 | 28% | 2.7 |
Includes penalties issued in 2023
Federal penalties imposed by CMS for regulatory violations, including civil money penalties (fines) and denials of payment for new Medicare/Medicaid admissions.
Source: CMS Penalties Database (Data as of Jan 2026)
District of Columbia average: $100K
District of Columbia average: 1.7
District of Columbia average: 0.5
Penalties are imposed by CMS for violations of federal nursing home regulations.
2 penalties in the past 3 years
Multiple penalties were reported in the last 3 years.
Last updated: Jan 2026
These measures show how residents usually do over time at this home, based on health outcomes and preventive care.
District of Columbia average: 10.8
District of Columbia average: 22.9
District of Columbia average: 23.0%
District of Columbia average: 22.8%
District of Columbia average: 23.5%
District of Columbia average: 1.2%
District of Columbia average: 8.1%
District of Columbia average: 1.8%
District of Columbia average: 4.6%
District of Columbia average: 5.3%
District of Columbia average: 7.2%
District of Columbia average: 90.4%
District of Columbia average: 97.0%
District of Columbia average: 1.07
District of Columbia average: 0.66
District of Columbia average: 66.9%
District of Columbia average: 0.7%
District of Columbia average: 73.2%
District of Columbia average: 18.1%
District of Columbia average: 7.2%
District of Columbia average: 0.8%
District of Columbia average: 53.7%
District of Columbia average: 50.6%
Quality measures are calculated from Minimum Data Set (MDS) assessments. For most measures, lower percentages indicate better care quality.
89% of new residents, usually for short-term rehab.
11% of new residents, often for short stays.
1% of new residents, often for long-term daily care.
Source: CMS Long-Term Care Facility Characteristics (Data as of Jan 2026)
Residents meet regularly to discuss policies, care quality, and activities
Organized group of residents that meets regularly to discuss facility policies, quality of life, and activities.
Data sourced from CMS Long-Term Care Facility Characteristics quarterly report. Payer mix reflects the current resident census by primary payment source.
Historical financial and operational data for Forest Hills of DC from 2011–2023, based on CMS SNF Cost Reports.
Key figures below are for fiscal year ending in 12/2023.
Based on CMS SNF Cost Report for fiscal year ending in 12/2023.
No pets allowed
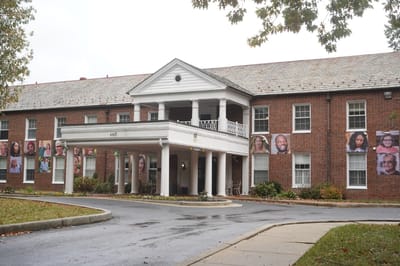
Building Type: Two-story
Transportation Services
Fitness and Recreation
Most residents typically stay for a few weeks or months before returning home or moving on.
Most new residents arrive under Medicare (89% of admissions), and a typical Medicare stay runs around 22 days.
Coverage residents most often arrive under.
Coverage residents most often leave under.
![]() 4.1 miles from city center
4.1 miles from city center
![]() Estimated distance in miles from Washington's city center to Forest Hills of DC's address, calculated via Google Maps.
— 2.49 miles to nearest hospital (Sibley Memorial Hospital)
Estimated distance in miles from Washington's city center to Forest Hills of DC's address, calculated via Google Maps.
— 2.49 miles to nearest hospital (Sibley Memorial Hospital)
Add your location
Info below is compiled from CMS reports & the DC Dept. of Health, senior community websites & trusted data sources such as Walk Score & BBB.
Communities are listed from highest to lowest based on our ranking methodology.
| Lisner-Louise-Dickson-Hurt-Home | NH AL RESC SNF | Washington (Northwest D.C) | 60 |
90.5%
Facility
90.5%
DC AVG
80.6
Rank
#4 / 10 | +12% | 5.04
Facility
5.04
DC AVG
4.60
Rank
#4 / 9 | -6% | +10% | $0
Facility
$0
DC AVG
$118.4k
Rank
#1 / 10 | 25
Facility
25
DC AVG
63.1
Rank
#1 / 10 | 5.0
Facility
5.0
DC AVG
11.1
Rank
#1 / 10 | - | 54 | - | 91 | Jonathan Plater | $8.0MFiscal year ending 06/2024
Facility
$8.0MFiscal year ending 06/2024
DC AVG
$34.0M
Rank
#7 / 9 | $8.9MFiscal year ending 06/2024
Facility
$8.9MFiscal year ending 06/2024
DC AVG
$11.6M
Rank
#7 / 9 | 111.1%Fiscal year ending 06/2024
Facility
111.1%Fiscal year ending 06/2024
DC AVG
39.8%
Rank
#5 / 9 | 95025 | ||||
| Ingleside at Rock Creek, a CCRC | NH AL HC IL MC SNF | Washington (Northwest D.C) | 34 |
87.1%
Facility
87.1%
DC AVG
80.6
Rank
#5 / 10 | +8% | 5.52
Facility
5.52
DC AVG
4.60
Rank
#2 / 9 | +22% | +20% | $39.4k
Facility
$39.4k
DC AVG
$118.4k
Rank
#7 / 10 | 42
Facility
42
DC AVG
63.1
Rank
#5 / 10 | 14.0
Facility
14.0
DC AVG
11.1
Rank
#8 / 10 | 1 | 30 | - | 42 | Bruce Bartels | $34.3MFiscal year ending 12/2023
Facility
$34.3MFiscal year ending 12/2023
DC AVG
$34.0M
Rank
#3 / 9 | $13.1MFiscal year ending 12/2023
Facility
$13.1MFiscal year ending 12/2023
DC AVG
$11.6M
Rank
#4 / 9 | 38.2%Fiscal year ending 12/2023
Facility
38.2%Fiscal year ending 12/2023
DC AVG
39.8%
Rank
#9 / 9 | 95028 | ||||
| Sibley Memorial Hosp Renaissance | NH SNF | Washington (Northwest D.C) | 45 |
79.1%
Facility
79.1%
DC AVG
80.6
Rank
#6 / 10 | -2% | 5.77
Facility
5.77
DC AVG
4.60
Rank
#1 / 9 | +70% | +25% | $8.8k
Facility
$8.8k
DC AVG
$118.4k
Rank
#3 / 10 | 34
Facility
34
DC AVG
63.1
Rank
#2 / 10 | 6.8
Facility
6.8
DC AVG
11.1
Rank
#2 / 10 | 2 | 36 | - | 26 | - | - | - | - | 95030 | ||||
| Forest Hills of DC | NH AL MC RC SNF | Washington (Northwest D.C) | 55 |
93.3%
Facility
93.3%
DC AVG
80.6
Rank
#3 / 10 | +16% | 4.69
Facility
4.69
DC AVG
4.60
Rank
#5 / 9 | +10% | +2% | $9.3k
Facility
$9.3k
DC AVG
$118.4k
Rank
#4 / 10 | 40
Facility
40
DC AVG
63.1
Rank
#4 / 10 | 10.0
Facility
10.0
DC AVG
11.1
Rank
#4 / 10 | 1 | 51 | - | 79 | Scott Taylor | $14.5MFiscal year ending 12/2023
Facility
$14.5MFiscal year ending 12/2023
DC AVG
$34.0M
Rank
#9 / 9 | $7.7MFiscal year ending 12/2023
Facility
$7.7MFiscal year ending 12/2023
DC AVG
$11.6M
Rank
#8 / 9 | 53.4%Fiscal year ending 12/2023
Facility
53.4%Fiscal year ending 12/2023
DC AVG
39.8%
Rank
#2 / 9 | 95038 | ||||
| Knollwood Life Plan Community | NH AL IL MC SNF | Washington (Northwest D.C) | 69 |
54.8%
Facility
54.8%
DC AVG
80.6
Rank
#10 / 10 | -32% | - | -4% | - | $0
Facility
$0
DC AVG
$118.4k
Rank
#1 / 10 | 39
Facility
39
DC AVG
63.1
Rank
#3 / 10 | 7.8
Facility
7.8
DC AVG
11.1
Rank
#3 / 10 | 3 | 38 | - | 15 | Sonja Brooks | $20.5MFiscal year ending 12/2023
Facility
$20.5MFiscal year ending 12/2023
DC AVG
$34.0M
Rank
#6 / 9 | $11.9MFiscal year ending 12/2023
Facility
$11.9MFiscal year ending 12/2023
DC AVG
$11.6M
Rank
#6 / 9 | 57.9%Fiscal year ending 12/2023
Facility
57.9%Fiscal year ending 12/2023
DC AVG
39.8%
Rank
#3 / 9 | 95026 |
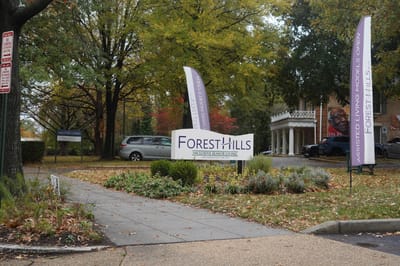
Forest Hills of DC is in the Northwest D.C. neighborhood.
Forest Hills of DC has a walk score of 79. Very walkable. Most errands can be accomplished on foot, and many essentials are within a short walk.
Forest Hills of DC's occupancy is 65.7%.
No, Forest Hills of DC has a no-pet policy.
Forest Hills of DC is registered as a non-profit.
Yes — there are 25 photos of Forest Hills of DC in the photo gallery on this page.
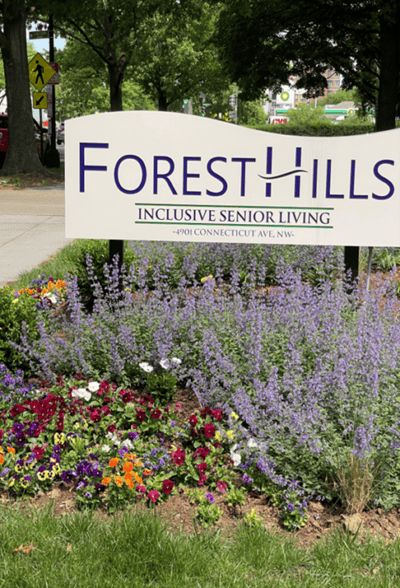
Forest Hills of DC is located at 4901 Connecticut Ave Nw, Washington, DC 20008.
Care Cost Calculator: See Prices in Your Area
Nursing Home Data Explorer
Don’t Wait Too Long: 7 Red Flag Signs Your Parent Needs Assisted Living Now
The True Cost of Assisted Living in 2025 – And How Families Are Paying For It
Understanding Senior Living Costs: Pricing Models, Discounts & Financial Assistance


