Golden Sonora Care Center

Nursing Home in California

CMS overall rating Info The Overall CMS Rating is scored from 1 to 5 stars and combines results from health inspections, staffing levels, and quality measures. Health inspections carry the most weight. Staffing and quality scores can increase or decrease the final rating based on performance compared to state and national standards.

Overview of Golden Sonora Care Center

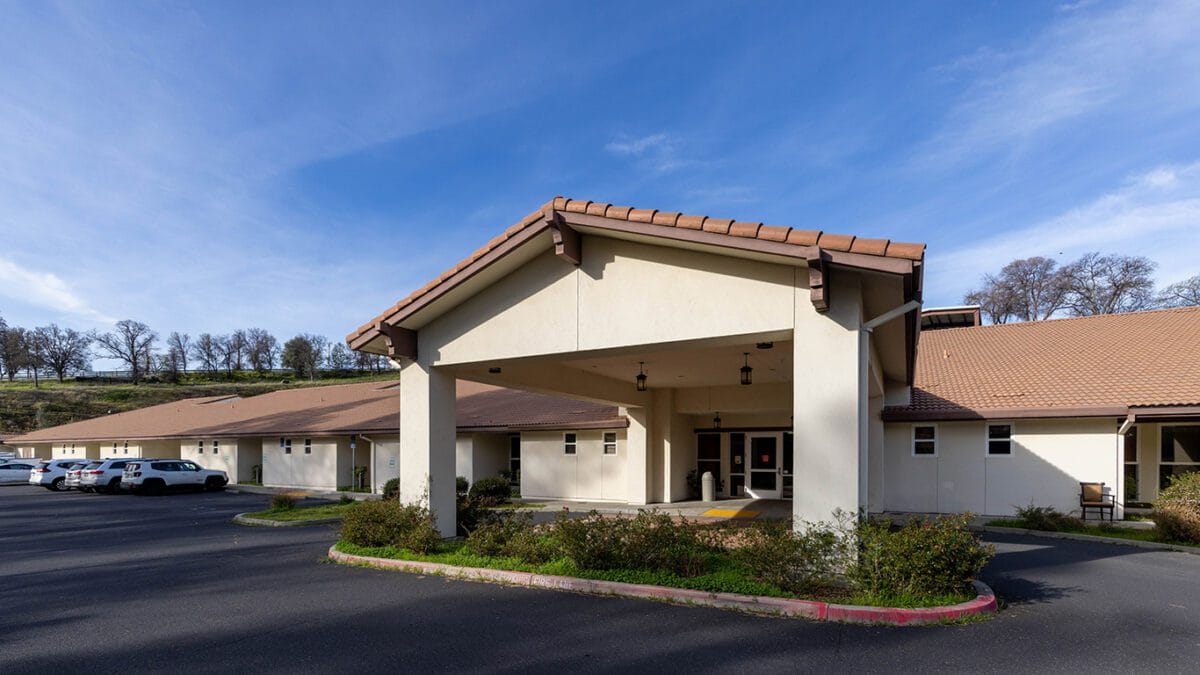
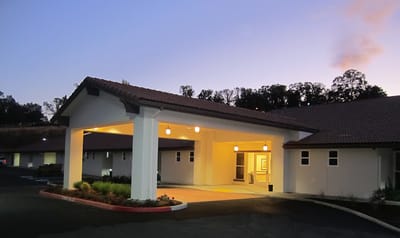
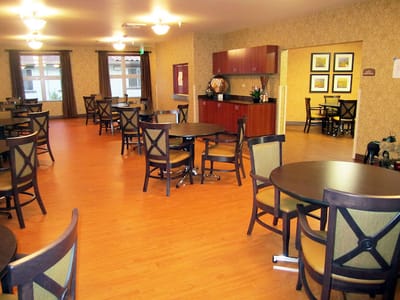
Golden Sonora Care Center, which can be found in serene Sonora, CA, is dedicated to providing a wide range of skilled nursing care and rehabilitation services. With a mission to offer resident-centered care, Golden Sonora Care Center has built a reputation for excellence and compassion in the community. At Golden Sonora Care Center, the focus is on creating a comfortable and nurturing environment where residents receive personalized care tailored to their unique needs. Whether residents require short-term rehabilitation or long-term care, the dedicated team designs individualized care plans to ensure optimal outcomes.

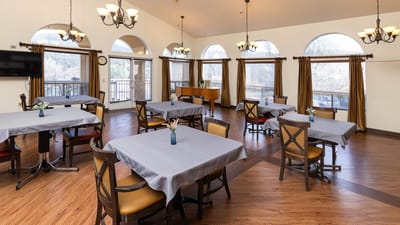
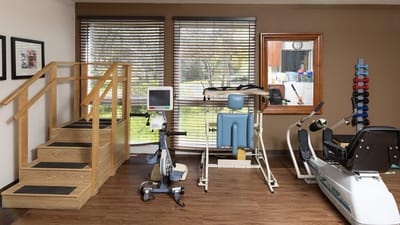
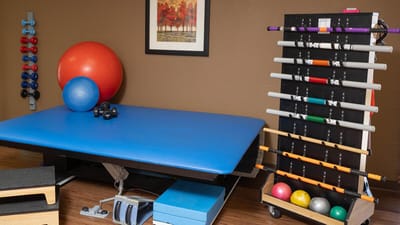
The center offers comprehensive services including 24-hour licensed nursing care, hospice and palliative care, respite care, physical therapy, occupational therapy, and restorative therapy. Golden Sonora Care Center also provides a range of supportive services including prescription and non-prescription drug services, family support services, comfort care, pain management, meals and dining services, beautician services, recreation and activities, housekeeping, laundry, and linen services. Guided by core values of respect, compassion, cooperation, and wisdom, Golden Sonora Care Center aims to be a premier provider of both short-term rehabilitative services and long-term care in California.

(209) 533-2500

Quality ratings

Measured by Centers for Medicare & Medicaid Services (CMS)

Overall rating Info The Overall CMS Rating combines results from health inspections, staffing levels and quality measures. Health inspections carry the most weight. Staffing and quality scores can increase or decrease the final rating based on performance compared to state and national standards.
1/5 ▼ 2.1 California average: 3.1/5
Health Inspection Info Based on the results of the facility's three most recent standard inspections and any complaint investigations. CMS reviews the number, scope, and severity of deficiencies, with more recent findings weighted more heavily.
1/5 ▼ 1.8 California average: 2.8/5
Staffing Info Measures average nursing staff hours per resident per day, including Registered Nurses (RNs) and total nursing staff. Ratings are adjusted based on the level of care residents require and are compared to state and national benchmarks.
3/5 ▼ 0.1 California average: 3.1/5
Quality Measures Info Based on clinical and physical health indicators reported to CMS, such as hospital readmissions, falls, pressure ulcers, and improvements in mobility. These measures reflect how well residents' health needs are being managed.
1/5 ▼ 3.1 California average: 4.1/5

Staffing hours breakdown

Info Daily nursing hours per resident by staff type, reported to CMS. Higher is generally better — compare this facility to state and national averages to see where staffing stands.

Hours per resident per day — compared to California state averages

Total nursing care / resident Info This home is ranked 87th out of 294 homes in California.

Total adjusted nursing hours per resident per day, combining RN, LPN, and aide time. CMS adjusts this for case-mix so facilities can be fairly compared.
4h 32m per day
Rank #87 / 294Nurse hours — state benchmarkedThis home is ranked 87th out of 294 homes in California.Shows adjusted nurse hours per resident per day benchmarked to the California average, with a ranking across 294 California SNFs. More hours mean more direct care. The national average is about 3.5 hrs; below 3.0 is a red flag.
This facility California avg (4h 13m per day)
vs California avg
+8%

5 of 6 metrics below state avg

Standout metric LPN / LVN is +7% above state avg
Staff typeHours / dayvs state avg
Registered Nurse (RN) Info RNs hold the highest nursing license and can assess residents, interpret test results, and direct care plans. More RN hours per day often signals stronger clinical oversight and faster response to health changes. 16m per day ▼ 59% State avg: 39m per day · National avg: 41m per day
LPN / LVN Info Licensed Practical Nurses (LPNs) or Licensed Vocational Nurses (LVNs) deliver routine hands-on care — medication administration, wound dressing, and monitoring vital signs. They work under RN supervision and make up a large share of daily bedside care. 1h 18m per day ▲ 7% State avg: 1h 13m per day · National avg: 52m per day
Nurse Aide Info Certified Nurse Aides (CNAs) provide the most direct day-to-day assistance: bathing, dressing, feeding, and mobility. Nurse aide hours are typically the largest staffing category and directly affect residents' quality of life. 2h 31m per day ▼ 5% State avg: 2h 39m per day · National avg: 2h 21m per day
Total Nursing (Weekend) Info Combined nursing hours (RN + LPN + Nurse Aide) per resident per day on weekends. Staffing often drops on weekends — this figure reveals whether the facility maintains adequate coverage outside of weekday hours. 3h 41m per day ▼ 10% State avg: 4h 5m per day · National avg: 3h 26m per day
Physical Therapist Info Hours per resident per day provided by licensed Physical Therapists (PTs) or PT Assistants. PT services help residents recover mobility after injury or illness and are especially important for post-acute (short-stay) rehabilitation. 2m per day ▼ 60% State avg: 5m per day · National avg: 4m per day
RN (Weekend) Info Registered nurse hours specifically on weekends. Facilities sometimes reduce RN presence on Saturdays and Sundays — a low weekend RN figure compared to weekday hours can indicate reduced clinical oversight when most administrative staff are absent. 10m per day ▼ 67% State avg: 30m per day · National avg: 29m per day

Capacity and availability

This home usually has availability

Occupancy lower than 85% suggests more openings may be available.

Lower occupancy than the California average: 84.7%
Occupancy rate 49.6% Rank #290 / 301Occupancy rate — state benchmarkedThis home is ranked 290th out of 301 homes in California.Shows this facility's occupancy rate versus the California average, with its statewide rank out of 301. Higher occupancy signals strong local demand and financial stability.
Avg. Length of Stay 88 days
Occupancy rate
49.6% Rank #290 / 301Occupancy rate — state benchmarkedThis home is ranked 290th out of 301 homes in California.Shows this facility's occupancy rate versus the California average, with its statewide rank out of 301. Higher occupancy signals strong local demand and financial stability.
Avg. Length of Stay
88 days

Who this home usually serves

TYPE OF STAY

Mostly short-term rehab stays

Most residents typically stay for a few weeks or months before returning home or moving on.

Might be optimal for
Short stays Recovery Medicare-covered care

Breakdown by payment type

Medicare

72% of new residents, usually for short-term rehab.

Typical stay 12 days

Private pay

13% of new residents, often for short stays.

Typical stay 1 - 2 months

Medicaid

14% of new residents, often for long-term daily care.

Typical stay 9 - 10 months

Finances and operations

Privately-owned community
Operated by a business corporation.
Home revenue
$4.2M
Operating loss
-$954.8K
Privately-owned community Operated by a business corporation.
Home revenue
$4.2M Rank #289 / 299Revenue — state benchmarkedThis home is ranked 289th out of 299 homes in California.Shows this facility's annual revenue compared to the California SNF average. Higher revenue generally means more resources for staffing and capital — read alongside Payroll %.
Operating loss
-$954.8K
Payroll costs Info The portion of the home's budget spent on staff, including nurses, caregivers, and other employees who support care and operations. Rank #298 / 299Payroll — state benchmarkedThis home is ranked 298th out of 299 homes in California.Shows total annual staff payroll benchmarked to the California average. Higher payroll investment relative to peers often signals better staffing and less reliance on cheaper contract labor.
$1.1M
24.9% of revenue Rank #295 / 299Payroll % — state benchmarkedThis home is ranked 295th out of 299 homes in California.Shows payroll as a percentage of revenue versus the California average. Well-run SNFs often land around 55–65%. Below 25% may signal understaffing or heavy agency use — read with Staffing ratings.
Other operating costs Info All remaining costs needed to run the home, such as food, utilities, building maintenance, supplies and administrative expenses.
$4.1M
Total costs $5.2M
Walk Score
Walk Score: 23 / 100 Rank #227 / 243Walk Score — state benchmarkedThis home is ranked 227th out of 243 homes in California.Shows how walkable this facility's neighborhood is compared to the average Walk Score across California SNFs. Higher scores benefit residents, families, and staff.
Car-dependent. Most errands require a car, with limited nearby walkable options.

About this community

Therapy & Rehabilitation

3 services
Rehabilitation Services
Respite Care
Short-Term Rehab

Staffing & Medical

1 service
24-Hour Staffing

Additional Services

1 service
Memory Support

Amenities & Lifestyle

Specific ProgramsSkilled Nursing Care, Rehabilitation Therapy, Respite Stays, Supplementary Care Options

Contact Golden Sonora Care Center

Health Inspection History

Inspections
Total health inspections 28

California average 12.5


Last Health inspection on Sep 2025

Total health citations
96 Rank #278 / 298Health citations — state benchmarkedThis home is ranked 278th out of 298 homes in California.Shows this facility's total health deficiency citations benchmarked to the California state average, with a ranking across all 298 CA SNFs. Lower citation counts earn a better rank.

California average 50.2

Citations per inspection
3.43

California average 4.65


Health citations are formal notices following inspections when they fail to comply with safety and care standards.

61 of 96 citations resulted from standard inspections; 33 of 96 resulted from complaint investigations; and 2 of 96 came from combined inspections (standard and complaint).

Breakdown of citation severity (last 3 years)
Critical Health citations More info
0 Rank #81 / 147Severe citations — state benchmarkedThis home is ranked 81st out of 147 homes in California.Shows citations where actual resident harm occurred, compared to the California average and ranked across 147 SNFs statewide. Even a single severe citation is significant — lower is always better.
100% better than California average

California average: 0.4


Serious Health citations More info 2
100% worse than California average

California average: 1

0 critical citations More info California average: 0.4

2 serious citations More info California average: 1

94 moderate citations More info California average: 47.2

0 minor citations More info California average: 1.5
Citations history (last 3 years)
Resident Rights moderate citation Info Issues related to resident's rights, including dignity, privacy, and the ability to make decisions about their care. Sep 02, 2025
Corrected

Environmental moderate citation Info Issues related to building safety, cleanliness, maintenance, and overall living conditions. Aug 07, 2025
Corrected

Infection Control moderate citation Info Issues related to preventing and controlling infections, including hygiene practices and safety protocols. Aug 07, 2025
Corrected

Infection Control moderate citation Info Issues related to preventing and controlling infections, including hygiene practices and safety protocols. Aug 07, 2025
Corrected

Compare Nursing Homes around California The information below is reported by the California Department of Social Services and Department of Public Health.

4 facilities compared · CMS & CA Dept. of Health data · Updated Apr 2026

Filter by care type
Carlsbad By The Sea Care Center
NH

Nursing Home Licensed facility providing 24/7 skilled nursing care for residents with complex, ongoing medical needs. Staffed by RNs, LPNs, and CNAs. Inspected and star-rated annually by CMS. Accepts Medicare (short-term rehab) and Medicaid (long-term care).

Carlsbad (Carlsbad Village)224 84.8% 0%5.00 +30%+18%0124.0026A+ 96 Digerness, Paula$26.0M$7.4M28.4%56496
Claremont Manor Care Center
HC

Home Care Professional care delivered in the person's own home — from companionship and errands to skilled nursing and therapy. Allows seniors to age in place. Medicare covers skilled home health when medically necessary.

NH

Nursing Home Licensed facility providing 24/7 skilled nursing care for residents with complex, ongoing medical needs. Staffed by RNs, LPNs, and CNAs. Inspected and star-rated annually by CMS. Accepts Medicare (short-term rehab) and Medicaid (long-term care).

Claremont360 0.0% -100%5.55 -10%+31%1673.9133- 90 Japenga, Diana$41.4M$15.1M36.5%555085
Golden Sonora Care Center
NH

Nursing Home Licensed facility providing 24/7 skilled nursing care for residents with complex, ongoing medical needs. Staffed by RNs, LPNs, and CNAs. Inspected and star-rated annually by CMS. Accepts Medicare (short-term rehab) and Medicaid (long-term care).

Sonora210 49.6% -41%4.54 -42%+8%2963.42181- 23 -$4.2M$1.1M24.9%555736
El Monte Convalescent Hospital
AL

Assisted Living A licensed, long-term care setting for seniors or individuals with disabilities who need help with daily activities — like bathing, dressing, and medication management — but not 24-hour skilled nursing. Offers housing, meals, and around-the-clock support while aiming to maximize resident independence.

HC

Home Care Professional care delivered in the person's own home — from companionship and errands to skilled nursing and therapy. Allows seniors to age in place. Medicare covers skilled home health when medically necessary.

IL

Independent Living Lifestyle-focused communities for older adults offering dining, activities, and transportation with minimal personal care. Best for active, independent seniors who want community without medical support.

NH

Nursing Home Licensed facility providing 24/7 skilled nursing care for residents with complex, ongoing medical needs. Staffed by RNs, LPNs, and CNAs. Inspected and star-rated annually by CMS. Accepts Medicare (short-term rehab) and Medicaid (long-term care).

El Monte93 65.2% -23%3.93 -58%-7%3755.4293- 56 Ahm Trust$3.5M$1.2M33.8%55202

Financial Assistance for
Nursing Home in California

Get Financial aid guidance

Multipurpose Senior Services Program

MSSP (Medi-Cal Waiver)

Age 65+
General California resident, Medi-Cal eligible, nursing home risk.
Income Limits (2025) ~$2,829/month 300% FBR, individual
Asset Limits $2,000 (individual), $3,000 (couple).
CA

County-managed; waitlists possible.

Benefits
In-home support (4-6 hours/day) Respite care (14 days/year) Meals (~$6/meal) Transportation (8 trips/month) Care management

In-Home Supportive Services (IHSS)

California IHSS

Age 65+
General California resident, Medicaid-eligible or low-income.
Income Limits ~$1,732/month individual, Medi-Cal threshold
Asset Limits $2,000 individual
CA

Can hire family as caregivers.

Benefits
Personal care (up to 283 hours/month) Homemaker services Respite (varies)

Multipurpose Senior Services Program (MSSP)

CA MSSP

Age 65+
General California resident, Medi-Cal-eligible, nursing home-eligible but community-capable.
Income Limits ~$2,829/month 300% FBR, individual
Asset Limits $2,000 individual
CA

Available in 38 counties; waitlists common.

Benefits
Case management Respite care (up to 10 days/year) Minor home mods (avg. $500) Adult day care (~$50/day)

Property Tax Postponement Program (PTP)

CA PTP

Age 62+
General California resident, own and live in home, 40% equity.
Income Limits (2025) ~$51,500/year household, adjusted annually
Asset Limits Equity-based; no strict asset cap.
CA

Deferred taxes accrue interest (5% as of 2024); repaid upon sale/death.

Benefits
Property tax deferral (avg. $1,000-$3,000/year, varies by county)

Assisted Living Waiver (ALW)

CA ALW

Age 65+ or disabled
General California resident, Medi-Cal-eligible, nursing home-eligible.
Income Limits ~$2,829/month 300% FBR, individual
Asset Limits $2,000 individual
CA

Available in 15 counties (e.g., LA, Sacramento); waitlists common.

Benefits
Personal care in ALFs (5-7 hours/day) Medication management Social services

California CARES Program

CA CARES

Age
General Caregivers of California residents 60+ needing help with 3+ daily activities; no caregiver age limit.
Income Limits No strict limit; cost-sharing above ~$2,500/month threshold.
Asset Limits Not applicable; need-based.
CA

High demand in urban areas; complements IHSS respite.

Benefits
Respite care (up to 10 days/year) Counseling (4-6 sessions/year) Training (2-3 workshops/year) Supplies (~$200/year)

Low-Income Home Energy Assistance Program (LIHEAP)

CA LIHEAP

Age 60+ priority
General California resident, low-income, utility/heating need.
Income Limits (2025) ~$2,510/month 200% of poverty level, individual
Asset Limits Not applicable; income-focused.
CA

High demand in inland/coastal extremes; weatherization capped at $5,000/home.

Benefits
Utility payments (avg. $500-$1,000/year) Weatherization (e.g., insulation, avg. $1,000-$3,000 savings)

Places of interest near Golden Sonora Care Center

Address 1.6 miles from city center Info Estimated distance in miles from Sonora's city center to Golden Sonora Care Center's address, calculated via Google Maps. — 0.26 miles to nearest hospital (UCSF Pediatric Cardiology Clinic)

Calculate Travel Distance to Golden Sonora Care Center

Add your location

Address

Staffing Data (Q2 2025)

This data corresponds to Q2 2025 and is based on CMS Payroll-Based Journal.

Total staff 358
Employees 160
Contractors 198
Staff to resident ratio 2.08:1
2081295% better than California average

California average ratio: 0.00:1

Avg staff/day 88
Average shift 9 hours
17% better than California average

California average: 7.7 hours

Total staff hours (quarter) 72,251
Nursing staff breakdown
Registered Nurse

Manages medical care and health needs.

Total count 18
Average shift length Info Average shift length. Calculated as total hours divided by days worked and average staff per day. 7.4 hours

This role is partially covered by contractors.

Licensed Practical Nurse

Assists with medical care and medications.

Total count 73
Average shift length Info Average shift length. Calculated as total hours divided by days worked and average staff per day. 9.2 hours

This role is partially covered by contractors.

Certified Nursing Assistant

Helps with daily care and mobility.

Total count 218
Average shift length Info Average shift length. Calculated as total hours divided by days worked and average staff per day. 9.7 hours

This role is partially covered by contractors.

Contractor staffing

Total hours from contractors

26.4%

19,063 contractor hours this quarter

Certified Nursing Assistant: 140 Licensed Practical Nurse: 22 Registered Nurse: 9 Speech Language Pathologist: 7 Physical Therapy Aide: 5 Respiratory Therapy Technician: 4 Physical Therapy Assistant: 4 RN Director of Nursing: 3 Occupational Therapy Aide: 1 Clinical Nurse Specialist: 1 Medical Director: 1 Qualified Social Worker: 1
Staff by category
Certified Nursing Assistant7814021840,92791100%9.7
Licensed Practical Nurse51227316,78691100%9.2
RN Director of Nursing6392,8258189%8.8
Registered Nurse99182,32091100%7.4
Other Dietary Services Staff5051,6169099%7.6
Physical Therapy Aide0551,5506673%7.6
Dental Services Staff3031,3798088%7.6
Clinical Nurse Specialist5161,1627380%6.9
Speech Language Pathologist0777576167%6.7
Respiratory Therapy Technician0445907481%6.1
Occupational Therapy Aide0115206875%7.7
Nurse Practitioner1015206571%8
Administrator1014806066%8
Mental Health Service Worker1014125864%7.1
Physical Therapy Assistant0443076369%4.3
Medical Director011522629%2
Qualified Social Worker011501213%4.1
218 Certified Nursing Assistant
% of Days 100%
73 Licensed Practical Nurse
% of Days 100%
9 RN Director of Nursing
% of Days 89%
18 Registered Nurse
% of Days 100%
5 Other Dietary Services Staff
% of Days 99%
5 Physical Therapy Aide
% of Days 73%
3 Dental Services Staff
% of Days 88%
6 Clinical Nurse Specialist
% of Days 80%
7 Speech Language Pathologist
% of Days 67%
4 Respiratory Therapy Technician
% of Days 81%
1 Occupational Therapy Aide
% of Days 75%
1 Nurse Practitioner
% of Days 71%
1 Administrator
% of Days 66%
1 Mental Health Service Worker
% of Days 64%
4 Physical Therapy Assistant
% of Days 69%
1 Medical Director
% of Days 29%
1 Qualified Social Worker
% of Days 13%

Facility Characteristics

Source: CMS Long-Term Care Facility Characteristics (Data as of Jan 2026)

Total residents 172
Medicare
26
15.1% of residents
Medicaid
118
68.6% of residents
Private pay or other
28
16.3% of residents
Programs & Services
Residents Group

Residents meet regularly to discuss policies, care quality, and activities

Nurse Aide Training

State-approved Nurse Aide Training and Competency Evaluation Program on-site

Active Resident Council

Organized group of residents that meets regularly to discuss facility policies, quality of life, and activities.

Quality of care over time

These measures show how residents usually do over time at this home, based on health outcomes and preventive care.

High-risk clinical events score Info A composite score based on pressure ulcers, falls with injury, weight loss, walking ability decline, and activities of daily living decline. 15.4
132% worse than California average

California average: 6.6

Functional decline score Info A composite score based on activities of daily living decline, walking ability decline, and incontinence. 26.6
135% worse than California average

California average: 11.3

Long-stay resident measures
Significantly below average California avg: 4.2 Info CMS star rating based on long-stay quality measure performance. 5 stars = significantly above average, 1 star = significantly below average.
Need for Help with Daily Activities Increased Info Percent of long-stay residents whose need for help with daily activities has increased 27.8%
151% worse than California average

California average: 11.1%

Walking Ability Worsened Info Percent of long-stay residents whose ability to move independently worsened 28.4%
137% worse than California average

California average: 12.0%

Low Risk Residents with Bowel/Bladder Incontinence Info Percent of low risk long-stay residents who lose control of their bowels or bladder 23.6%
109% worse than California average

California average: 11.3%

Falls with Major Injury Info Percent of long-stay residents experiencing one or more falls with major injury 4.9%
195% worse than California average

California average: 1.7%

High Risk Residents with Pressure Ulcers Info Percent of long-stay high risk residents with pressure ulcers 8.3%
67% worse than California average

California average: 5.0%

Urinary Tract Infection Info Percent of long-stay residents with a urinary tract infection 0.7%
44% better than California average

California average: 1.2%

Lost Too Much Weight Info Percent of long-stay residents who lose too much weight 7.5%
78% worse than California average

California average: 4.2%

Depressive Symptoms Info Percent of long-stay residents who have depressive symptoms 1.1%
83% better than California average

California average: 6.7%

Antipsychotic Use Info Percent of long-stay residents who received an antipsychotic medication 20.4%
102% worse than California average

California average: 10.1%

Pneumococcal Vaccine Info Percent of long-stay residents assessed and appropriately given the pneumococcal vaccine 95.1%
In line with California average

California average: 98.5%

Influenza Vaccine Info Percent of long-stay residents assessed and appropriately given the seasonal influenza vaccine 95.1%
In line with California average

California average: 98.2%

Hospitalizations per 1,000 days Info Number of hospitalizations per 1,000 long-stay resident days. 1.89
16% better than California average

California average: 2.25

ED visits per 1,000 days Info Number of outpatient emergency department visits per 1,000 long-stay resident days. 2.77
74% worse than California average

California average: 1.59

Short-stay resident measures
Significantly below average California avg: 3.5 Info CMS star rating based on short-stay quality measure performance. 5 stars = much above average, 1 star = much below average.
Pneumococcal Vaccine Info Percent of short-stay residents assessed and appropriately given the pneumococcal vaccine 91.1%
In line with California average

California average: 94.0%

Antipsychotic medication increase Info Percent of short-stay residents who newly received an antipsychotic medication 1.6%
8% worse than California average

California average: 1.5%

Influenza Vaccine Info Percent of short-stay residents assessed and appropriately given the seasonal influenza vaccine 82.2%
12% worse than California average

California average: 93.2%

Re-hospitalized after SNF stay Info Percentage of short-stay residents who were re-hospitalized after their nursing home admission. 26.6%
15% worse than California average

California average: 23.2%

Emergency department visits Info Percentage of short-stay residents who had an outpatient emergency department visit. 19.6%
75% worse than California average

California average: 11.2%

Falls with major injury Info Percentage of SNF residents who experience falls with major injury during their stay. 1.4%
84% worse than California average

California average: 0.8%

Ability to care for self at discharge Info Percentage of residents at or above expected ability to care for themselves at discharge. 53.3%
In line with California average

California average: 53.7%

Successful return to home or community Info Rate of successful return to home or community from a skilled nursing facility. 54.1%
7% better than California average

California average: 50.6%

Penalties and fines

Federal penalties imposed by CMS for regulatory violations, including civil money penalties (fines) and denials of payment for new Medicare/Medicaid admissions.

Source: CMS Penalties Database (Data as of Jan 2026)

Total fines amount $93K
71% higher than California average

California average: $55K

Number of fines 2 Rank #73 / 135Federal fines — state benchmarkedThis home is ranked 73rd out of 135 homes in California.Shows this facility's CMS fine count alongside the California average, and where it ranks among all 135 skilled nursing facilities in the state. Fewer fines mean a better rank.
15% fewer fines than California average

California average: 2.4

Payment Denials Info Serious action where Medicare and/or Medicaid temporarily stops payments for new residents until issues are fixed. 1
102% more payment denials than California average

California average: 0.5

Fines amount comparison
This facility $93K
California average $55K
Penalty History

Penalties are imposed by CMS for violations of federal nursing home regulations.

Civil Money Penalty Info Fines imposed for noncompliance, which can be assessed per day or per instance of violation. Feb 26, 2024
$57K
Payment Denial Info Serious action where Medicare and/or Medicaid temporarily stops payments for new residents until issues are fixed. Feb 26, 2024
21 days
Civil Money Penalty Info Fines imposed for noncompliance, which can be assessed per day or per instance of violation. Jun 22, 2023
$36K

Last updated: Jan 2026

Guides for Better Senior Living

Care Cost Calculator: See Prices in Your Area

Nursing Home Data Explorer

Don’t Wait Too Long: 7 Red Flag Signs Your Parent Needs Assisted Living Now

The True Cost of Assisted Living in 2025 – And How Families Are Paying For It

Understanding Senior Living Costs: Pricing Models, Discounts & Financial Assistance

Tour Icon
Planning a tour? Check our touring checklist.
Chat Icon
Thinking of living here? We can help you speak to a current resident
Explore Open Rooms
1 Contact details
2 What type of senior care service are you looking for?
3 What budget do you have in mind for senior care?
4 How soon do you need to find care?
5 Additional details

Thank you for your interest!

Our team will be in touch shortly to help with next steps.