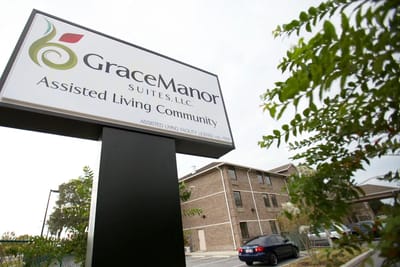
Grace Manor Suites
Nursing Home, Assisted Living & Respite Care · Lakeland, FL
CMS overall rating Info CMS (the Centers for Medicare & Medicaid Services) is the federal agency that rates nursing home quality. Its Overall Rating runs from 1 to 5 stars, combining health inspections, staffing, and quality measures, with inspections weighted most heavily.

Grace Manor Suites

Nursing Home, Assisted Living & Respite Care · Lakeland, FL
CMS overall rating Info CMS (the Centers for Medicare & Medicaid Services) is the federal agency that rates nursing home quality. Its Overall Rating runs from 1 to 5 stars, combining health inspections, staffing, and quality measures, with inspections weighted most heavily.
Calculator: See prices in your area
Grace Manor Suites accepts Insurance and/or HMO, Medicaid, Veteran Affairs Benefits, Medicare, and private pay.

Overview of Grace Manor Suites

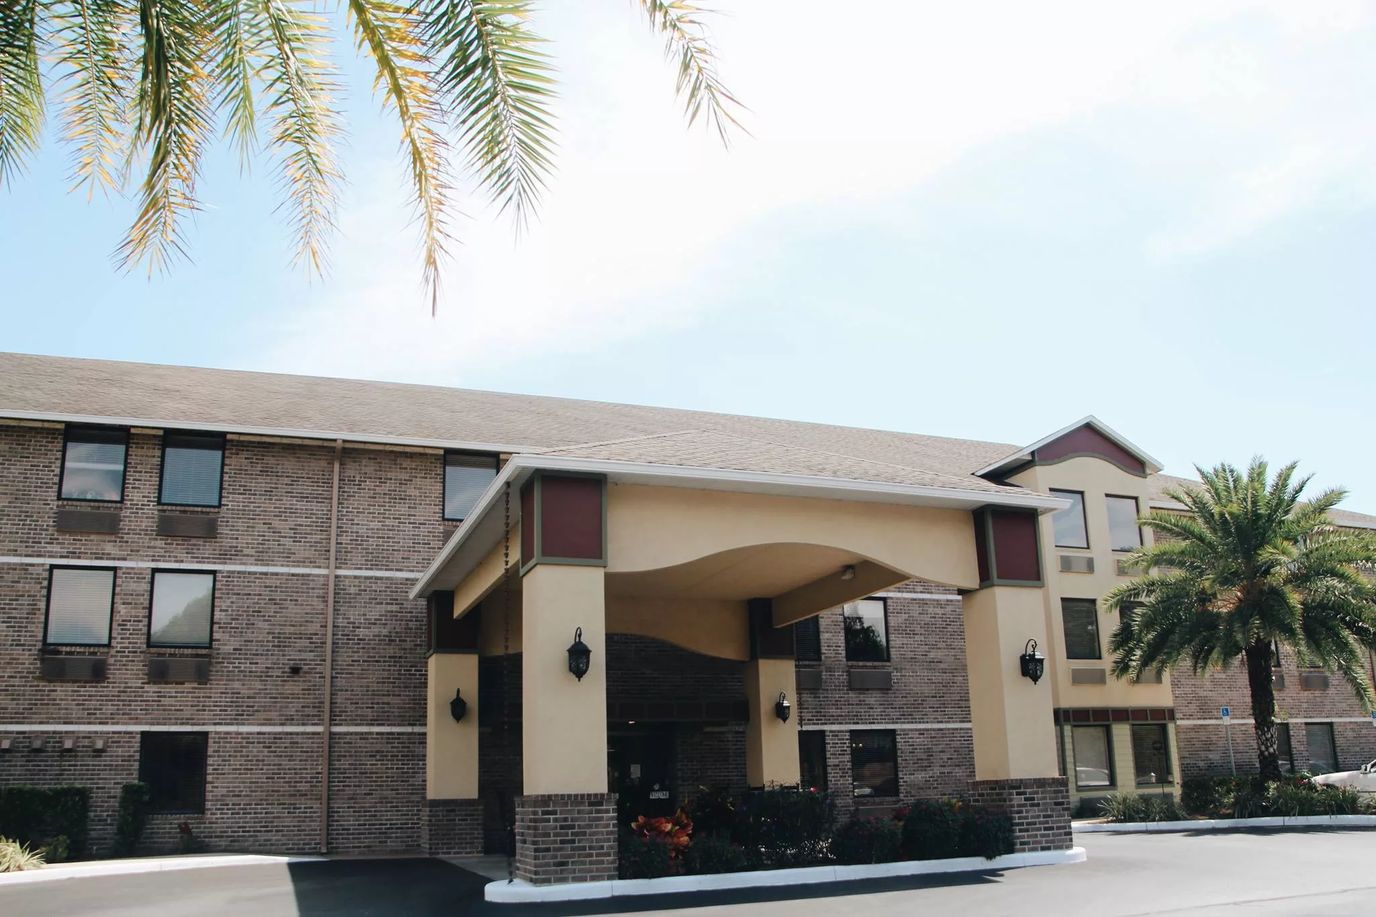
Grace Manor Suites is a senior living community located in Lakeland, FL, providing assisted living services to its residents. This senior living community offers studio-type, one bedroom suite and apartment, as well as double suite accommodations. All units have non-slip flooring to ensure safety and reduce slipping and fall risks, ample closet space, refrigerator units, and walk-in showers with grab bars. Their residents also benefit from their on-site health services included in their assisted living program, including their personal emergency response systems, medication management and assistance, respite care, and assistance with daily living activities.

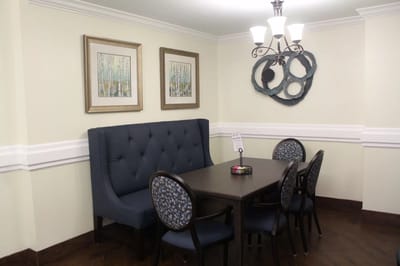
To ensure that the residents of Grace Manor are well taken care of, they also provide meals prepared by their dining services department where each meal is approved by a licensed nutritionist and is prepared with consideration to dietary restrictions. The residents of Grace Manor are also able to enjoy a myriad of amenities in the community such as salon and barber services, resident transportation for outings and medical appointments, housekeeping and laundry services, and programs designed to promote engagement, physical fitness, and mental well being.

Quality ratings

Measured by Centers for Medicare & Medicaid Services (CMS)

Overall rating Info The Overall CMS Rating combines results from health inspections, staffing levels and quality measures. Health inspections carry the most weight. Staffing and quality scores can increase or decrease the final rating based on performance compared to state and national standards.
▼ 37.0% Below FL avg. ▼ 37.0% Below FL avg.FL average: 3.2Click the badge to see the full State ranking.Click here to see the full State ranking.
Health Inspection Info Based on the results of the facility's three most recent standard inspections and any complaint investigations. CMS reviews the number, scope, and severity of deficiencies, with more recent findings weighted more heavily.
▼ 28.9% Below FL avg. ▼ 28.9% Below FL avg.FL average: 2.8Click the badge to see the full State ranking.Click here to see the full State ranking.
Staffing Info Measures average nursing staff hours per resident per day, including Registered Nurses (RNs) and total nursing staff. Ratings are adjusted based on the level of care residents require and are compared to state and national benchmarks.
▼ 40.9% Below FL avg. ▼ 40.9% Below FL avg.FL average: 3.4Click the badge to see the full State ranking.Click here to see the full State ranking.
Quality Measures Info Based on clinical and physical health indicators reported to CMS, such as hospital readmissions, falls, pressure ulcers, and improvements in mobility. These measures reflect how well residents' health needs are being managed.
▼ 26.1% Below FL avg. ▼ 26.1% Below FL avg.FL average: 4.1Click the badge to see the full State ranking.Click here to see the full State ranking.

Staffing hours breakdown

Info Daily nursing hours per resident by staff type, reported to CMS. Higher is generally better — compare this facility to state and national averages to see where staffing stands.

Hours per resident per day — compared to Florida state averages

Total nursing care / resident Info This home is ranked 233rd out of 253 homes in Florida for nurse hours. Total adjusted nursing hours per resident per day, combining RN, LPN, and aide time. CMS adjusts this for case-mix so facilities can be fairly compared.
3h 26m per day
Rank #233 / 253Nurse hours — State benchmarkedThis home is ranked 233rd out of 253 homes in Florida. Shows adjusted nurse hours per resident per day benchmarked to the Florida average, with a ranking across 253 Florida facilities. More hours mean more direct care. The national average is about 3.5 hrs; below 3.0 is a red flag.Rankings are based only on facilities in Florida that report data for that category. Facilities without available data are excluded from the ranking.Click the rank badge to see the full State ranking.Click here to see the full State ranking.
This facility Florida avg (4h 2m per day)
vs Florida avg
-15%

5 of 6 metrics below state avg

Standout metric LPN / LVN is +22% above state avg
Staff typeHours / Day / Residentvs state avg
Registered Nurse (RN) Info RNs hold the highest nursing license and can assess residents, interpret test results, and direct care plans. More RN hours per day often signals stronger clinical oversight and faster response to health changes. 25m per day ▼ 44% State avg: 44m per day · National avg: 41m per day
LPN / LVN Info Licensed Practical Nurses (LPNs) or Licensed Vocational Nurses (LVNs) deliver routine hands-on care — medication administration, wound dressing, and monitoring vital signs. They work under RN supervision and make up a large share of daily bedside care. 58m per day ▲ 22% State avg: 47m per day · National avg: 52m per day
Nurse Aide Info Certified Nurse Aides (CNAs) provide the most direct day-to-day assistance: bathing, dressing, feeding, and mobility. Nurse aide hours are typically the largest staffing category and directly affect residents' quality of life. 2h 11m per day ▼ 7% State avg: 2h 20m per day · National avg: 2h 20m per day
Weekend Total Nursing Info Combined nursing hours (RN + LPN + Nurse Aide) per resident per day on weekends. Staffing often drops on weekends — this figure reveals whether the facility maintains adequate coverage outside of weekday hours. 3h 20m per day ▼ 5% State avg: 3h 32m per day · National avg: 3h 27m per day
Physical Therapist Info Hours per resident per day provided by licensed Physical Therapists (PTs) or PT Assistants. PT services help residents recover mobility after injury or illness and are especially important for post-acute (short-stay) rehabilitation. 3m per day ▼ 54% State avg: 6m per day · National avg: 4m per day
Weekend RN Info Registered nurse hours specifically on weekends. Facilities sometimes reduce RN presence on Saturdays and Sundays — a low weekend RN figure compared to weekday hours can indicate reduced clinical oversight when most administrative staff are absent. 22m per day ▼ 32% State avg: 32m per day · National avg: 29m per day

Capacity and availability

Avg. Length of Stay
99 days
Bed community size
77-bed community Rank #608 / 1074Bed count — State benchmarkedThis home is ranked 608th out of 1074 homes in Florida. Shows this facility's certified or reported bed count compared to other Florida facilities. Larger communities may offer more amenities, programs, and on-site services for residents and families.Rankings are based only on facilities in Florida that report data for that category. Facilities without available data are excluded from the ranking.Click the rank badge to see the full State ranking.Click here to see the full State ranking.
A larger shared setting that may offer more common spaces and organized community services.
Walk Score
Walk Score: 37 / 100 Rank #787 / 1486Walk Score — State benchmarkedThis home is ranked 787th out of 1486 homes in Florida. Shows how walkable this facility's neighborhood is compared to the average Walk Score across Florida facilities. Higher scores benefit residents, families, and staff.Rankings are based only on facilities in Florida that report data for that category. Facilities without available data are excluded from the ranking.Click the rank badge to see the full State ranking.Click here to see the full State ranking.
Somewhat walkable. A few nearby services may be reachable on foot, but most trips require transportation.

About this community

Occupancy

Occupancy rate
83%
Rank #179 / 258Occupancy rate — State benchmarkedThis home is ranked 179th out of 258 homes in Florida. Shows this facility's occupancy rate versus the Florida average, with its Statewide rank out of 258. Higher occupancy signals strong local demand and financial stability.Rankings are based only on facilities in Florida that report data for that category. Facilities without available data are excluded from the ranking.Click the rank badge to see the full State ranking.Click here to see the full State ranking.
Similar to the Florida average: 84.3%
Occupied beds
64 / 77
Average occupied beds in Florida homes 108 beds

License Details

Facility TypeAssisted Living Facility
StatusLicensed
IssuanceAugust 1, 2025
ExpirationJuly 31, 2027
CountyPolk
License Number11995

Ownership & Operating Entity

Grace Manor Suites is legally operated by Grace Manor Suites Llc, and administered by Barry Sanders.

Profit StatusFor-profit

Type Of Units

Private
77 units
Total beds
77 units

Staffing

Key information about the people who lead and staff this community.

Languages Spoken

English Spanish

Amenities & Lifestyle

Specific ProgramsOther Communities

Contact Grace Manor Suites

Inspection History

In Florida, the Agency for Health Care Administration (AHCA) is the primary authority that conducts unannounced inspections and completes official health quality reports for all healthcare facilities.

Since 2012 · 14 years of data 31 citations 24 inspections 1 fine $2.0K fined
Inspection Score Info A composite 0–100 score combining this facility's inspections, citations, complaints, and enforcement actions relative to the Florida state average. The score below shows how many points this facility sits above or below the typical Florida assisted living residence score (the benchmark); higher is better.

6 points above the Florida average for assisted living residences (83/100)

Rank #342 / 876 in Florida Inspection Score — State benchmarked This home is ranked 342nd out of 876 homes in Florida. Shows this facility's inspection score compared to the Florida average among 876 comparable communities in the ranking pool. Rankings are based only on facilities in Florida that report data for that category. Facilities without available data are excluded from the ranking. Inspection score: 89 out of 100. Letter grade B+. 6 points above the Florida average for assisted living residences (83/100)

Inspection Scorecard Info This scorecard compares key inspection, citation, and complaint metrics at this facility against the Florida state average. Metrics rated ≥15% worse than average are highlighted in red; those ≥15% better are highlighted in green.

Since 2012 vs. Florida state average
Overall vs. FL average 0 Worse No metrics in this bucket. 1 At Avg Metrics at Florida average:
• Citations per inspection (at FL avg)
5 Better Metrics better than Florida average:
• Total citations (6% below)
• Citations per year (8% below)
• Total inspections (8% below)
• Inspections with citations (25% below)
• Inspection citation rate (19% below)
Latest Inspection September 11, 2025 Standard

Citations Info Citations are formal regulatory issues recorded during state inspections.

This FacilityFL Averagevs. FL Avg
Total citations Info Formal regulatory issues recorded by inspectors across all inspection types. 3133 This facility has 6% fewer total citations than a typical Florida assisted living residence (31 vs. FL avg 33).↓ 6% better Rank #492 / 919 Total citations — State benchmarked This home is ranked 492nd out of 919 homes in Florida. Shows this facility's total citations compared to the Florida average among 919 comparable communities in the ranking pool. Rankings are based only on facilities in Florida that report data for that category. Facilities without available data are excluded from the ranking.
Citations per year Info Average citations per year since 2012. 2.22.4 This facility has 8% fewer citations per year than a typical Florida assisted living residence (2.2 vs. FL avg 2.4).↓ 8% better
Citations per inspection Info Average citations per inspection. 1.31.3 This facility has citations per inspection in line with the Florida average (1.3 vs. FL avg 1.3).— At avg Rank #557 / 919 Citations per inspection — State benchmarked This home is ranked 557th out of 919 homes in Florida. Shows this facility's citations per inspection compared to the Florida average among 919 comparable communities in the ranking pool. Rankings are based only on facilities in Florida that report data for that category. Facilities without available data are excluded from the ranking.

Inspections Info State inspections evaluate whether the facility meets health and safety standards.

This FacilityFL Averagevs. FL Avg
Total inspections Info Combined count of all routine and focused inspections. Excludes complaint investigations. 2426 This facility has 8% fewer total inspections than a typical Florida assisted living residence (24 vs. FL avg 26).↓ 8% better
Inspections with citations Info Inspections that resulted in at least one regulatory citation. 1216 This facility has 25% fewer inspections with citations than a typical Florida assisted living residence (12 vs. FL avg 16).↓ 25% better
Inspection citation rate Info Percentage of inspections that resulted in at least one citation. 50%62% This facility has 12 percentage points lower inspection citation rate than a typical Florida assisted living residence (50% vs. FL avg 62%).↓ 12% better Rank #341 / 919 Inspection citation rate — State benchmarked This home is ranked 341st out of 919 homes in Florida. Shows this facility's % of inspections with citations compared to the Florida average among 919 comparable communities in the ranking pool. Rankings are based only on facilities in Florida that report data for that category. Facilities without available data are excluded from the ranking.

Inspection Reports Summary Info An editor-reviewed summary of the themes and findings across this facility's recent inspection reports.

  • The most recent inspection on September 11, 2025, included cited deficiencies, some of which were corrected on site.
  • The July 31, 2025 inspection found three Class 3 deficiencies in training, resident records, and Alzheimer’s/dementia training.
  • Deficiencies have consistently involved staff training and records across multiple inspections from 2012 through 2025, showing a recurring compliance theme.

Health Inspection History

Inspections since 2021
Total health inspections 5

Florida average 4.3


Last Health inspection on May 2025

Total health citations
34 Rank #225 / 252Health citations — State benchmarkedThis home is ranked 225th out of 252 homes in Florida. Shows this facility's total health deficiency citations benchmarked to the Florida State average, with a ranking across all 252 FL facilities. Lower citation counts earn a better rank.Rankings are based only on facilities in Florida that report data for that category. Facilities without available data are excluded from the ranking.Click the rank badge to see the full State ranking.Click here to see the full State ranking.

Florida average 19.7

Citations per inspection
6.8 Rank #215 / 252Citations per inspection — State benchmarkedThis home is ranked 215th out of 252 homes in Florida. Shows average deficiency citations per CMS inspection for this facility versus the Florida mean across 252 facilities with citation data. Lower is better.Rankings are based only on facilities in Florida that report data for that category. Facilities without available data are excluded from the ranking.Click the rank badge to see the full State ranking.Click here to see the full State ranking.

Florida average 4.48


Health citations are formal notices following inspections when they fail to comply with safety and care standards.

29 of 34 citations resulted from standard inspections; 4 of 34 resulted from complaint investigations; and 1 of 34 came from combined inspections (standard and complaint).

Breakdown of citation severity (last 5 years)
Critical health citations
0
100% better than Florida average

Florida average: 0.8


Serious health citations
0
100% better than Florida average

Florida average: 0.4

0 critical citations Florida average: 0.8

0 serious citations Florida average: 0.4

34 moderate citations Florida average: 18.4

0 minor citations Florida average: 0.2
Citations history (last 5 years)
Nutrition moderate citation May 08, 2025
Corrected

Pharmacy moderate citation May 08, 2025
Corrected

Pharmacy moderate citation May 08, 2025
Corrected

Pharmacy moderate citation May 08, 2025
Corrected

Staffing Data

Reporting period: October 1 – December 31, 2025 (Q4 2025). Source: CMS Payroll-Based Journal report.

Total staff 147
Employees 146
Contractors 1
Staff to resident ratio 1.31 : 1
11% fewer staff per resident than Florida average
Florida average ratio: 1.47 : 1 Florida average ratio: 1.47 : 1See full Florida ranking
Avg staff/day 67
Average shift 7.3 hours
8% worse than Florida average
Florida average: 7.9 hours Florida average shift: 7.9 hoursSee full Florida ranking
Total staff hours (quarter) 44,974

Nursing staff breakdown

Q4 2025 · Oct 1 – Dec 31 More info This data comes from the CMS Payroll-Based Journal report covering October 1 – December 31, 2025.
Registered Nurse

Manages medical care and health needs.

RN Staff Info All 11 RN Staff are full-time employees. No contractors work on this role. 11
Average shift length Info Average shift length. Calculated as total hours divided by days worked and average staff per day. 7.1 hours
Licensed Practical Nurse

Assists with medical care and medications.

LPN Staff Info All 22 LPN Staff are full-time employees. No contractors work on this role. 22
Average shift length Info Average shift length. Calculated as total hours divided by days worked and average staff per day. 8.4 hours
Certified Nursing Assistant

Helps with daily care and mobility.

CNA Staff Info All 86 CNA Staff are full-time employees. No contractors work on this role. 86
Average shift length Info Average shift length. Calculated as total hours divided by days worked and average staff per day. 7.1 hours

Contractor staffing

Q4 2025 · Oct 1 – Dec 31 More info This data comes from the CMS Payroll-Based Journal report covering October 1 – December 31, 2025.

Total hours from contractors

1.1%

494 contractor hours this quarter

Clinical Nurse Specialist: 1

Staff by category

Q4 2025 · Oct 1 – Dec 31 More info This data comes from the CMS Payroll-Based Journal report covering October 1 – December 31, 2025.
Certified Nursing Assistant8608623,36392100%7.1
Licensed Practical Nurse220227,97992100%8.4
Registered Nurse110112,94192100%7.1
RN Director of Nursing5052,3298188%8.1
Physical Therapy Assistant5051,3868896%5.4
Speech Language Pathologist3031,3397177%7.2
Dietitian2029878087%7.6
Physical Therapy Aide4049609199%5.9
Clinical Nurse Specialist1129488795%8.5
Mental Health Service Worker2028516470%6.9
Nurse Practitioner1015096672%7.7
Administrator1015026571%7.7
Respiratory Therapy Technician2024705661%7.8
Qualified Social Worker1014115459%7.6
86 Certified Nursing Assistant
% of Days 100%
22 Licensed Practical Nurse
% of Days 100%
11 Registered Nurse
% of Days 100%
5 RN Director of Nursing
% of Days 88%
5 Physical Therapy Assistant
% of Days 96%
3 Speech Language Pathologist
% of Days 77%
2 Dietitian
% of Days 87%
4 Physical Therapy Aide
% of Days 99%
2 Clinical Nurse Specialist
% of Days 95%
2 Mental Health Service Worker
% of Days 70%
1 Nurse Practitioner
% of Days 72%
1 Administrator
% of Days 71%
2 Respiratory Therapy Technician
% of Days 61%
1 Qualified Social Worker
% of Days 59%

Penalties and fines

Includes penalties issued in 2023

Federal penalties imposed by CMS for regulatory violations, including civil money penalties (fines) and denials of payment for new Medicare/Medicaid admissions.

Source: CMS Penalties Database (Data as of Jan 2026)

Total fines amount $6K Rank #167 / 258Federal fines — State benchmarkedThis home is ranked 167th out of 258 homes in Florida. Shows this facility's cumulative CMS federal fine dollars versus the Florida average among facilities with fines, and where it ranks among 258 facilities in the pool. Lower total dollars mean a better rank.Rankings are based only on facilities in Florida that report data for that category. Facilities without available data are excluded from the ranking.Click the rank badge to see the full State ranking.Click here to see the full State ranking.
91% lower than Florida average

Florida average: $72K

Number of fines 1
62% fewer fines than Florida average

Florida average: 2.6

Payment Denials Info Serious action where Medicare and/or Medicaid temporarily stops payments for new residents until issues are fixed. 0
100% fewer payment denials than Florida average

Florida average: 0.1

Fines amount comparison
This facility $6K
Florida average $72K
Penalty History

Penalties are imposed by CMS for violations of federal nursing home regulations.

1 penalty in the past 3 years

Jul 17, 2023 · $6K

Civil Money Penalty Info Fines imposed for noncompliance, which can be assessed per day or per instance of violation. Jul 17, 2023
$6K

Last updated: Jan 2026

Quality of care over time

These measures show how residents usually do over time at this home, based on health outcomes and preventive care.

High-risk clinical events score Info A composite score based on pressure ulcers, falls with injury, weight loss, walking ability decline, and activities of daily living decline. 8.4
13% worse than Florida average

Florida average: 7.4

Functional decline score Info A composite score based on activities of daily living decline, walking ability decline, and incontinence. 11.4
8% better than Florida average

Florida average: 12.4

Long-stay resident measures
Need for Help with Daily Activities Increased Info Percent of long-stay residents whose need for help with daily activities has increased 10.8%
In line with Florida average

Florida average: 10.5%

Walking Ability Worsened Info Percent of long-stay residents whose ability to move independently worsened 12.4%
In line with Florida average

Florida average: 12.9%

Low Risk Residents with Bowel/Bladder Incontinence Info Percent of low risk long-stay residents who lose control of their bowels or bladder 11.0%
19% better than Florida average

Florida average: 13.5%

Falls with Major Injury Info Percent of long-stay residents experiencing one or more falls with major injury 3.5%
30% worse than Florida average

Florida average: 2.6%

High Risk Residents with Pressure Ulcers Info Percent of long-stay high risk residents with pressure ulcers 6.0%
12% worse than Florida average

Florida average: 5.4%

Urinary Tract Infection Info Percent of long-stay residents with a urinary tract infection 0.6%
37% better than Florida average

Florida average: 0.9%

Lost Too Much Weight Info Percent of long-stay residents who lose too much weight 9.4%
57% worse than Florida average

Florida average: 6.0%

Depressive Symptoms Info Percent of long-stay residents who have depressive symptoms 7.9%
136% worse than Florida average

Florida average: 3.3%

Antipsychotic Use Info Percent of long-stay residents who received an antipsychotic medication 4.3%
47% better than Florida average

Florida average: 8.0%

Pneumococcal Vaccine Info Percent of long-stay residents assessed and appropriately given the pneumococcal vaccine 97.9%
In line with Florida average

Florida average: 97.7%

Influenza Vaccine Info Percent of long-stay residents assessed and appropriately given the seasonal influenza vaccine 100.0%
In line with Florida average

Florida average: 99.2%

Short-stay resident measures
Pneumococcal Vaccine Info Percent of short-stay residents assessed and appropriately given the pneumococcal vaccine 97.0%
In line with Florida average

Florida average: 94.0%

Antipsychotic medication increase Info Percent of short-stay residents who newly received an antipsychotic medication 1.7%
14% worse than Florida average

Florida average: 1.5%

Influenza Vaccine Info Percent of short-stay residents assessed and appropriately given the seasonal influenza vaccine 99.0%
In line with Florida average

Florida average: 94.7%

Breakdown by payment type

Medicare

18% of new residents, usually for short-term rehab.

Typical stay 26 days

Private pay

53% of new residents, often for short stays.

Typical stay 1 - 2 months

Medicaid

29% of new residents, often for long-term daily care.

Typical stay 7 - 8 months

Facility Characteristics

Source: CMS Long-Term Care Facility Characteristics (Data as of Jan 2026)

Total residents 112
Medicare
25
22.3% of residents
Medicaid
68
60.7% of residents
Private pay or other
19
17% of residents
Programs & Services
Residents Group

Residents meet regularly to discuss policies, care quality, and activities

Active Resident Council

Organized group of residents that meets regularly to discuss facility policies, quality of life, and activities.

Finances and operations

Based on CMS SNF Cost Report for fiscal year ending in 12/2023.

For-profit
Operated by a single business entity.
Net patient revenue Info Net patient revenue — what the home actually collects for resident care, after contractual allowances, bad debt and discounts are subtracted from its gross charges (CMS cost report, Worksheet G-3). It covers resident care only; money the home earns from other sources is shown separately as "Other income."
$10.0M
Net patient income Info Net patient income: net patient revenue minus the home's total operating expenses. A positive figure means it earns more from resident care than it spends to deliver it; a negative figure means the opposite. It excludes non-operating "other income."
-$2.5M
For-profit Operated by a single business entity.
Net patient revenue Info Net patient revenue — what the home actually collects for resident care, after contractual allowances, bad debt and discounts are subtracted from its gross charges (CMS cost report, Worksheet G-3). It covers resident care only; money the home earns from other sources is shown separately as "Other income."
$10.0M Rank #215 / 257Revenue — State benchmarkedThis home is ranked 215th out of 257 homes in Florida. Shows this facility's annual revenue compared to the Florida average. Higher revenue generally means more resources for staffing and capital — read alongside Payroll %.Rankings are based only on facilities in Florida that report data for that category. Facilities without available data are excluded from the ranking.Click the rank badge to see the full State ranking.Click here to see the full State ranking.
Net patient income Info Net patient income: net patient revenue minus the home's total operating expenses. A positive figure means it earns more from resident care than it spends to deliver it; a negative figure means the opposite. It excludes non-operating "other income."
-$2.5M
Other income Info Money the home earns outside of resident care — such as investments, grants, rentals and other non-operating sources (CMS cost report, Worksheet G-3). It is tracked separately from net patient revenue: it is not part of that figure, and it is not included in net patient income.
$2.0K
Payroll costs Info Staff salaries plus wage-related costs — benefits such as payroll taxes, health insurance and retirement — from the home's own accounting records (CMS cost report, Worksheet A). Contract or agency labor is counted separately, under other operating costs. Rank #203 / 257Payroll — State benchmarkedThis home is ranked 203rd out of 257 homes in Florida. Shows total annual staff payroll benchmarked to the Florida average. Higher payroll investment relative to peers often signals better staffing and less reliance on cheaper contract labor.Rankings are based only on facilities in Florida that report data for that category. Facilities without available data are excluded from the ranking.Click the rank badge to see the full State ranking.Click here to see the full State ranking.
$4.8M 48.2% of net patient revenue Info Payroll as a share of revenue: staff salaries and wage-related benefits divided by net patient revenue. A higher figure means more of each revenue dollar goes to staff pay. Rank #54 / 257Payroll % — State benchmarkedThis home is ranked 54th out of 257 homes in Florida. Shows payroll as a percentage of revenue versus the Florida average. Well-run Florida facilities typically land around 49–56% — the top third Statewide. Below 25% may signal understaffing or heavy agency use — read with Staffing ratings.Rankings are based only on facilities in Florida that report data for that category. Facilities without available data are excluded from the ranking.Click the rank badge to see the full State ranking.Click here to see the full State ranking.
Other operating costs Info Everything it costs to run the home apart from payroll — food, utilities, supplies, maintenance, contract labor and administration. Calculated as total operating expense minus payroll (staff salaries and wage-related benefits).
$7.7M
Total costs Info The home's total operating expense for the year — all the costs of running it, salaries included (CMS cost report, Worksheet G-3).
$12.6M

What does this home offer?

Pets allowed icon
Pets allowed icon

Pets Allowed

Housing options icon

Housing Options: Studio / Suite / 1 Bed

Building type icon
Building type icon

Building Type: Apartment

Transportation services icon

Transportation Services

Fitness and recreation icon

Fitness and Recreation

Who this home usually serves

TYPE OF STAY

Mix of rehab and long-term care

This home supports both short-term rehab and long-term care, with residents staying for a wide range of durations.

Most new residents arrive under private pay (53% of admissions), and a typical private pay stay runs around 1 - 2 months.

Admissions
391 total

Coverage residents most often arrive under.

Medicare 18%
Private pay 53%
Medicaid 29%
Discharges
364 total

Coverage residents most often leave under.

Medicare 15%
Private pay 48%
Medicaid 37%

Managed by Barry Sanders

Executive Director

Activities in this home

Places of interest near Grace Manor Suites

Address 4.9 miles from city center Info Estimated distance in miles from Lakeland's city center to Grace Manor Suites's address, calculated via Google Maps.

Calculate Travel Distance to Grace Manor Suites

Add your location

Address

Compare Assisted Living around Lakeland

The information below is reported by the Florida Agency for Health Care Administration (AHCA).

Grace Manor Suites
AL
NH
RC
Lakeland (North Socrum Loop Road) -
77
Facility 77
FL AVG 89
Rank #608 / 1074
-
37
Facility 37
FL AVG 40
Rank #787 / 1486
Studio / Suite / 1 Bed
The Estates At Carpenters
AL
IL
NH
Lakeland -
72
Facility 72
FL AVG 89
Rank #633 / 1074
A+
68
Facility 68
FL AVG 40
Rank #234 / 1486
-
Florida Presbyterian Homes Inc. D.b.a. Westminster Lakeland
AL
IL
NC
NH
Lakeland (Lake Somerset) -
136
Facility 136
FL AVG 89
Rank #189 / 1074
-
55
Facility 55
FL AVG 40
Rank #426 / 1486
-
Highlands Lake Center
AL
NH
PC
RC
Lakeland -
179
Facility 179
FL AVG 89
Rank #78 / 1074
-
9
Facility 9
FL AVG 40
Rank #1282 / 1486
-
Bridgewalk on Harden
AL
HC
NH
PC
RC
Lakeland -
120
Facility 120
FL AVG 89
Rank #256 / 1074
-
24
Facility 24
FL AVG 40
Rank #1015 / 1486
-

Financial Assistance for
Assisted Living in Florida

Grace Manor Suites is located in Lakeland, Florida.
Here are the financial assistance programs available to residents in Florida.

Get Financial aid guidance

Long-Term Care Waiver

Florida Medicaid LTC Waiver

Age 65+ or 21+ disabled
General Florida resident, Medicaid- eligible, nursing home-level care need.
Income Limits (2025) ~$2,829/month 300% FBR, individual
Asset Limits $2,000 (individual), $3,000 (couple).
FL

High demand; waitlists common.

Benefits
In-home care (6-8 hours/day) Assisted living Respite (240 hours/year) Case management

Community Care for the Elderly (CCE)

Florida CCE

Age 60+
General Florida resident, at risk of nursing home.
Income Limits ~$2,000/month varies
Asset Limits $5,000 individual
FL

Limited funding; regional variation.

Benefits
Homemaker services (3-5 hours/week) Adult day care (~$60/day) Respite (up to 10 days/year)

Home Care for the Elderly (HCE)

Florida Home Care for the Elderly

Age 60+
General Florida resident, at risk of nursing home placement; caregiver must be approved.
Income Limits (2025) ~$2,829/month individual, aligned with Medicaid thresholds
Asset Limits ~$2,000 (individual); varies by case manager discretion.
FL

Limited funding (~3,500 served annually); prioritizes low-income frail seniors.

Benefits
Basic subsidy (~$160/month) for housing/medical costs; special subsidies for supplies/services (e.g., incontinence supplies, ~$50-$200/month)

Program of All-Inclusive Care for the Elderly (PACE)

Florida Medicaid PACE

Age 55+
General Florida resident, nursing home-level care need, safe with PACE support.
Income Limits (2025) ~$2,829/month 300% FBR
Asset Limits $2,000 (individual), $3,000 (couple).
FL

Limited to specific counties (e.g., Hillsborough, Miami-Dade); ~10 sites statewide.

Benefits
Personal care (5-7 hours/day) Medical care Meals Transportation Therapy

Optional State Supplementation (OSS)

Florida Optional State Supplementation

Age 65+ or disabled
General Florida resident, living in approved facility, receiving SSI or low-income.
Income Limits (2025) ~$1,004/month individual, including SSI
Asset Limits $2,000 (individual), $3,000 (couple).
FL

Limited to specific facility types; ~$78.40/month max supplement.

Benefits
Cash payment (~$78.40/month) for room/board or personal needs in facilities

Frequently Asked Questions about Grace Manor Suites

What neighborhood is Grace Manor Suites in?

Grace Manor Suites is in the North Socrum Loop Road neighborhood of Lakeland.

What languages are spoken at Grace Manor Suites?

The team at Grace Manor Suites speaks English and Spanish.

Is Grace Manor Suites in a walkable area?

Grace Manor Suites has a walk score of 37. Somewhat walkable. A few nearby services may be reachable on foot, but most trips require transportation.

What is the license number of Grace Manor Suites?

According to FL state health department records, Grace Manor Suites's license number is 11995.

When does Grace Manor Suites's license expire?

According to FL state health department records, Grace Manor Suites's license expires on July 31, 2027.

What is the occupancy rate at Grace Manor Suites?

Grace Manor Suites's occupancy is 83%.

What payment types does Grace Manor Suites accept?

Grace Manor Suites accepts Insurance and/or HMO, Medicaid, and VA.

Guides for Better Senior Living

Care Cost Calculator: See Prices in Your Area

Nursing Home Data Explorer

Don’t Wait Too Long: 7 Red Flag Signs Your Parent Needs Assisted Living Now

The True Cost of Assisted Living in 2025 – And How Families Are Paying For It

Understanding Senior Living Costs: Pricing Models, Discounts & Financial Assistance