


Total staff
146
Employees
139
Contractors
7
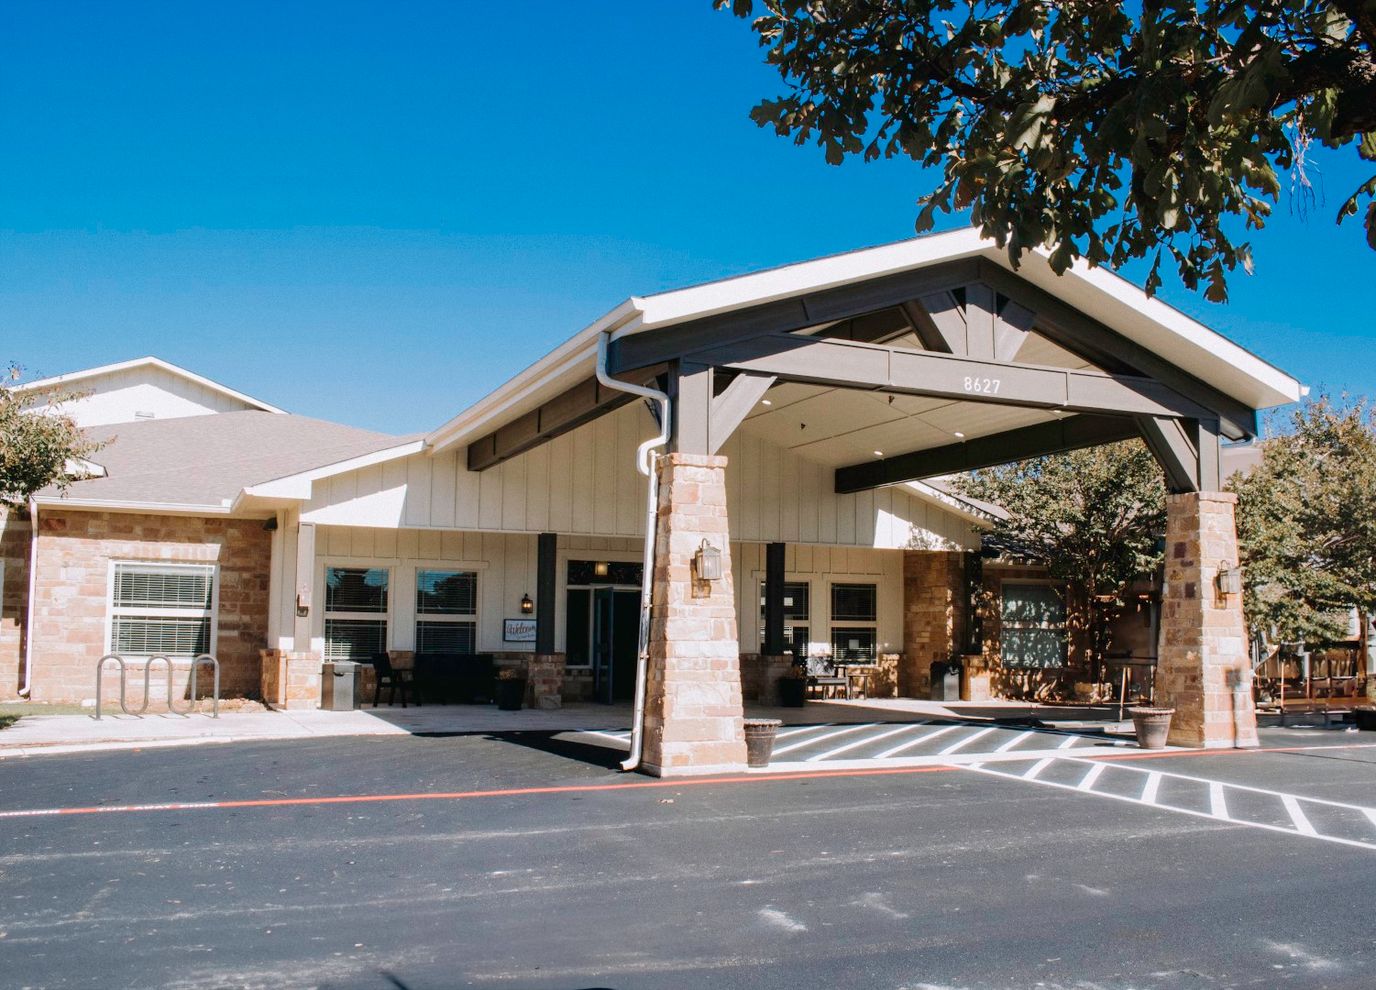
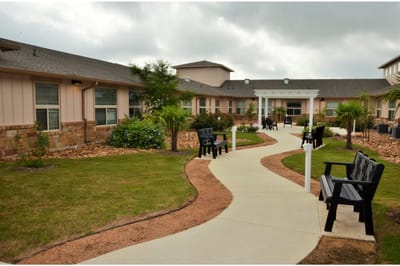
Conveniently located in the harmonious neighborhood of San Antonio, TX, Grandview of Westover Hills is a trusted community that offers assisted living and memory care. Residents, including those with cognitive conditions, enjoy the highest quality of care for their unique needs with a respectful and highly trained team available around the clock. The community strives to meet residents’ needs with a registered nurse on site.
Here, residents will not feel lonely with plenty of fun recreational activities and engaging programs for their leisure and wellness. Delightful and healthy meals are also served for residents to have the finest dining experience that caters to their dietary needs and preferences. Amenities include a barber shop, a fitness center, a theater, and a beauty parlor, creating the perfect setting for residents to live a worry-free retirement.
| Staff type | Hours / Day / Resident | vs state avg |
|---|---|---|
|
Registered Nurse (RN)
| 27m per day | ▲ 6% State avg: 25m per day · National avg: 41m per day |
|
LPN / LVN
| 1h 10m per day | ▲ 24% State avg: 57m per day · National avg: 52m per day |
|
Nurse Aide
| 1h 50m per day | ▼ 9% State avg: 2h 1m per day · National avg: 2h 20m per day |
|
Weekend Total Nursing
| 3h 2m per day | ■ Avg State avg: 3h 0m per day · National avg: 3h 27m per day |
|
Physical Therapist
| 4m per day | ▲ 10% State avg: 4m per day · National avg: 4m per day |
|
Weekend RN
| 16m per day | ▼ 22% State avg: 20m per day · National avg: 29m per day |
Reporting period: October 1 – December 31, 2025 (Q4 2025). Source: CMS Payroll-Based Journal report.
Manages medical care and health needs.
Assists with medical care and medications.
Helps with daily care and mobility.
Total hours from contractors
492 contractor hours this quarter
| Certified Nursing Assistant | 50 | 0 | 50 | 16,219 | 92 | 100% | 8 |
| Licensed Practical Nurse | 30 | 1 | 31 | 9,753 | 92 | 100% | 8.9 |
| Registered Nurse | 15 | 3 | 18 | 2,823 | 92 | 100% | 8.5 |
| RN Director of Nursing | 3 | 1 | 4 | 1,721 | 91 | 99% | 8.9 |
| Medication Aide/Technician | 6 | 0 | 6 | 1,658 | 88 | 96% | 8.2 |
| Speech Language Pathologist | 6 | 0 | 6 | 1,243 | 84 | 91% | 5.9 |
| Clinical Nurse Specialist | 3 | 0 | 3 | 1,139 | 73 | 79% | 8.7 |
| Administrator | 2 | 0 | 2 | 1,025 | 65 | 71% | 8.9 |
| Physical Therapy Assistant | 6 | 0 | 6 | 958 | 67 | 73% | 7.4 |
| Respiratory Therapy Technician | 3 | 0 | 3 | 716 | 87 | 95% | 5.4 |
| Physical Therapy Aide | 9 | 0 | 9 | 569 | 74 | 80% | 5.3 |
| Mental Health Service Worker | 1 | 0 | 1 | 515 | 57 | 62% | 9 |
| Nurse Practitioner | 1 | 0 | 1 | 444 | 47 | 51% | 9.4 |
| Dietitian | 1 | 0 | 1 | 423 | 52 | 57% | 8.1 |
| Qualified Social Worker | 3 | 0 | 3 | 314 | 59 | 64% | 4.5 |
| Occupational Therapy Aide | 0 | 1 | 1 | 120 | 16 | 17% | 7.5 |
| Occupational Therapy Assistant | 0 | 1 | 1 | 31 | 3 | 3% | 10.3 |
Includes penalties issued in 2025
Federal penalties imposed by CMS for regulatory violations, including civil money penalties (fines) and denials of payment for new Medicare/Medicaid admissions.
Source: CMS Penalties Database (Data as of Jan 2026)
Texas average: $80K
Texas average: 2.5
Texas average: 0.2
Penalties are imposed by CMS for violations of federal nursing home regulations.
1 penalty in the past 3 years
Apr 16, 2025 · $8K
Last updated: Jan 2026
These measures show how residents usually do over time at this home, based on health outcomes and preventive care.
Texas average: 8.6
Texas average: 16.0
Texas average: 16.2%
Texas average: 16.2%
Texas average: 15.7%
Texas average: 3.2%
Texas average: 4.4%
Texas average: 0.8%
Texas average: 3.5%
Texas average: 2.9%
Texas average: 7.9%
Texas average: 97.3%
Texas average: 97.9%
Texas average: 90.4%
Texas average: 1.4%
Texas average: 88.0%
Quality measures are calculated from Minimum Data Set (MDS) assessments. For most measures, lower percentages indicate better care quality.
56% of new residents, usually for short-term rehab.
33% of new residents, often for short stays.
11% of new residents, often for long-term daily care.
Source: CMS Long-Term Care Facility Characteristics (Data as of Jan 2026)
Residents meet regularly to discuss policies, care quality, and activities
Organized group of residents that meets regularly to discuss facility policies, quality of life, and activities.
Data sourced from CMS Long-Term Care Facility Characteristics quarterly report. Payer mix reflects the current resident census by primary payment source.
Historical financial and operational data for Grandview of Westover Hills from 2017–2022, based on CMS SNF Cost Reports.
Key figures below are for fiscal year ending in 09/2022 — the home's most recent complete cost report, an older period than most facilities report.
Based on the home's most recent complete CMS SNF Cost Report — fiscal year ending in 09/2022. This is an older period than most facilities report, so compare with that in mind.
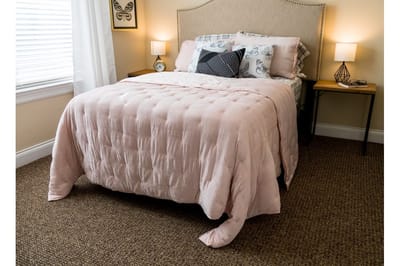
Housing Options: Studio / 1 Bed / 2 Bed / Semi-Private Rooms
Building Type: Single-story
Beauty Services
Social and Recreational Activities
Exercise Programs
Most residents typically stay for a few weeks or months before returning home or moving on.
Most new residents arrive under Medicare (56% of admissions), and a typical Medicare stay runs around 29 days.
Coverage residents most often arrive under.
Coverage residents most often leave under.
![]() 9.7 miles from city center
9.7 miles from city center
![]() Estimated distance in miles from San Antonio's city center to Grandview of Westover Hills's address, calculated via Google Maps.
Estimated distance in miles from San Antonio's city center to Grandview of Westover Hills's address, calculated via Google Maps.
Add your location
The information below is reported by the Texas Health and Human Services Commission.
| Saint Francis Nursing Home | NH AL IL | San Antonio (Midtown) | 116
Facility
116
TX AVG
80
Rank
#270 / 976 | - | - | 3.93
Facility
3.93
TX AVG
3.63
Rank
#75 / 273 | - | +8% | $0
Facility
$0
TX AVG
$81.8k
Rank
#1 / 278 | - | - | - | 92 | - |
71
Facility
71
TX AVG
41
Rank
#124 / 1389 | - | - | - | - | 45F410 | ||||
| The Army Residence Community Health Care Center | NH AL IL MC SNF | San Antonio (Northeast Side) | 30
Facility
30
TX AVG
80
Rank
#771 / 976 | - | - | 4.74
Facility
4.74
TX AVG
3.63
Rank
#34 / 273 | -10% | +31% | $0
Facility
$0
TX AVG
$81.8k
Rank
#1 / 278 | 18
Facility
18
TX AVG
25.9
Rank
#94 / 274 | 4.5
Facility
4.5
TX AVG
3.7
Rank
#230 / 274 | - | 59 | - |
6
Facility
6
TX AVG
41
Rank
#1284 / 1389 | Army Retirement Residence Foundation San Antonio | $33.5MFiscal year ending 06/2024
Facility
$33.5MFiscal year ending 06/2024
TX AVG
$8.4M
Rank
#6 / 280 | $16.5MFiscal year ending 06/2024
Facility
$16.5MFiscal year ending 06/2024
TX AVG
$3.5M
Rank
#6 / 280 | 49.4%Fiscal year ending 06/2024
Facility
49.4%Fiscal year ending 06/2024
TX AVG
47%
Rank
#249 / 280 | 675697 | ||||
| Blue Skies of Texas East | NH AL HOS IL MC SNF | San Antonio (Valley High North) | 24
Facility
24
TX AVG
80
Rank
#786 / 976 | - | - | 6.51
Facility
6.51
TX AVG
3.63
Rank
#3 / 273 | -7% | +79% | $17.3k
Facility
$17.3k
TX AVG
$81.8k
Rank
#120 / 278 | 31
Facility
31
TX AVG
25.9
Rank
#206 / 274 | 3.1
Facility
3.1
TX AVG
3.7
Rank
#124 / 274 | 2 | 53 | - |
47
Facility
47
TX AVG
41
Rank
#585 / 1389 | Air Force Village Inc | $10.3MFiscal year ending 06/2024
Facility
$10.3MFiscal year ending 06/2024
TX AVG
$8.4M
Rank
#58 / 280 | $5.4MFiscal year ending 06/2024
Facility
$5.4MFiscal year ending 06/2024
TX AVG
$3.5M
Rank
#43 / 280 | 52.2%Fiscal year ending 06/2024
Facility
52.2%Fiscal year ending 06/2024
TX AVG
47%
Rank
#78 / 280 | 676041 | ||||
| Westover Hills Rehabilitation and Healthcare Center | NH MC SNF | San Antonio (Far West Side) | 124
Facility
124
TX AVG
80
Rank
#174 / 976 |
84.5%
Facility
84.5%
TX AVG
67.5
Rank
#51 / 200 | +25% | 3.87
Facility
3.87
TX AVG
3.63
Rank
#75 / 273 | +6% | +7% | $20.2k
Facility
$20.2k
TX AVG
$81.8k
Rank
#129 / 278 | 29
Facility
29
TX AVG
25.9
Rank
#196 / 274 | 2.6
Facility
2.6
TX AVG
3.7
Rank
#68 / 274 | 2 | 105 | - |
32
Facility
32
TX AVG
41
Rank
#900 / 1389 | Sage Terrace Healthcare LLC | $13.1MFiscal year ending 12/2023
Facility
$13.1MFiscal year ending 12/2023
TX AVG
$8.4M
Rank
#64 / 280 | $7.8MFiscal year ending 12/2023
Facility
$7.8MFiscal year ending 12/2023
TX AVG
$3.5M
Rank
#50 / 280 | 60.1%Fiscal year ending 12/2023
Facility
60.1%Fiscal year ending 12/2023
TX AVG
47%
Rank
#83 / 280 | 676281 | ||||
| Grandview of Westover Hills | NH AL MC | San Antonio (Far West Side) | 112
Facility
112
TX AVG
80
Rank
#293 / 976 |
94.9%
Facility
94.9%
TX AVG
67.5
Rank
#7 / 200 | +41% | 3.32
Facility
3.32
TX AVG
3.63
Rank
#181 / 273 | +61% | -8% | $8.3k
Facility
$8.3k
TX AVG
$81.8k
Rank
#82 / 278 | 23
Facility
23
TX AVG
25.9
Rank
#157 / 274 | 4.6
Facility
4.6
TX AVG
3.7
Rank
#236 / 274 | 2 | 106 | - |
33
Facility
33
TX AVG
41
Rank
#882 / 1389 | Westover Continuing Care Center Ltd. Co | $8.5M*Fiscal year ending 09/2022These figures are from this home's most recent complete cost report — an older period than most facilities report. Compare with that in mind.
Facility
$8.5M*Fiscal year ending 09/2022These figures are from this home's most recent complete cost report — an older period than most facilities report. Compare with that in mind.
TX AVG
$8.4M
Rank
#108 / 280 | $4.8M*Fiscal year ending 09/2022These figures are from this home's most recent complete cost report — an older period than most facilities report. Compare with that in mind.
Facility
$4.8M*Fiscal year ending 09/2022These figures are from this home's most recent complete cost report — an older period than most facilities report. Compare with that in mind.
TX AVG
$3.5M
Rank
#162 / 280 | 55.7%*Fiscal year ending 09/2022These figures are from this home's most recent complete cost report — an older period than most facilities report. Compare with that in mind.
Facility
55.7%*Fiscal year ending 09/2022These figures are from this home's most recent complete cost report — an older period than most facilities report. Compare with that in mind.
TX AVG
47%
Rank
#225 / 280 | 676402 |
Grandview of Westover Hills is located in San Antonio, Texas.
Here are the financial assistance programs available to residents in Texas.
Grandview of Westover Hills is in the Far West Side neighborhood.
Grandview of Westover Hills has a walk score of 33. Somewhat walkable. A few nearby services may be reachable on foot, but most trips require transportation.
Grandview of Westover Hills's occupancy is 80.1%.
Grandview of Westover Hills is a government-operated nursing facility.
Yes — there are 6 photos of Grandview of Westover Hills in the photo gallery on this page.
Grandview of Westover Hills is located at 8627 Lakeside Pkwy, San Antonio, TX 20141.
(210) 810-4900 will put you in contact with the team at Grandview of Westover Hills.
Care Cost Calculator: See Prices in Your Area
Nursing Home Data Explorer
Don’t Wait Too Long: 7 Red Flag Signs Your Parent Needs Assisted Living Now
The True Cost of Assisted Living in 2025 – And How Families Are Paying For It
Understanding Senior Living Costs: Pricing Models, Discounts & Financial Assistance


