Greenbriar at the Altamont
Nursing Home, Assisted Living, Hospice Care, Independent Living, Nursing Care & Respite Care · Birmingham, AL
CMS overall rating Info CMS (the Centers for Medicare & Medicaid Services) is the federal agency that rates nursing home quality. Its Overall Rating runs from 1 to 5 stars, combining health inspections, staffing, and quality measures, with inspections weighted most heavily.

Greenbriar at the Altamont

Nursing Home, Assisted Living, Hospice Care, Independent Living, Nursing Care & Respite Care · Birmingham, AL
CMS overall rating Info CMS (the Centers for Medicare & Medicaid Services) is the federal agency that rates nursing home quality. Its Overall Rating runs from 1 to 5 stars, combining health inspections, staffing, and quality measures, with inspections weighted most heavily.
Calculator: See prices in your area
Greenbriar at the Altamont accepts Medicare, Medicaid, and private pay.

Overview of Greenbriar at the Altamont

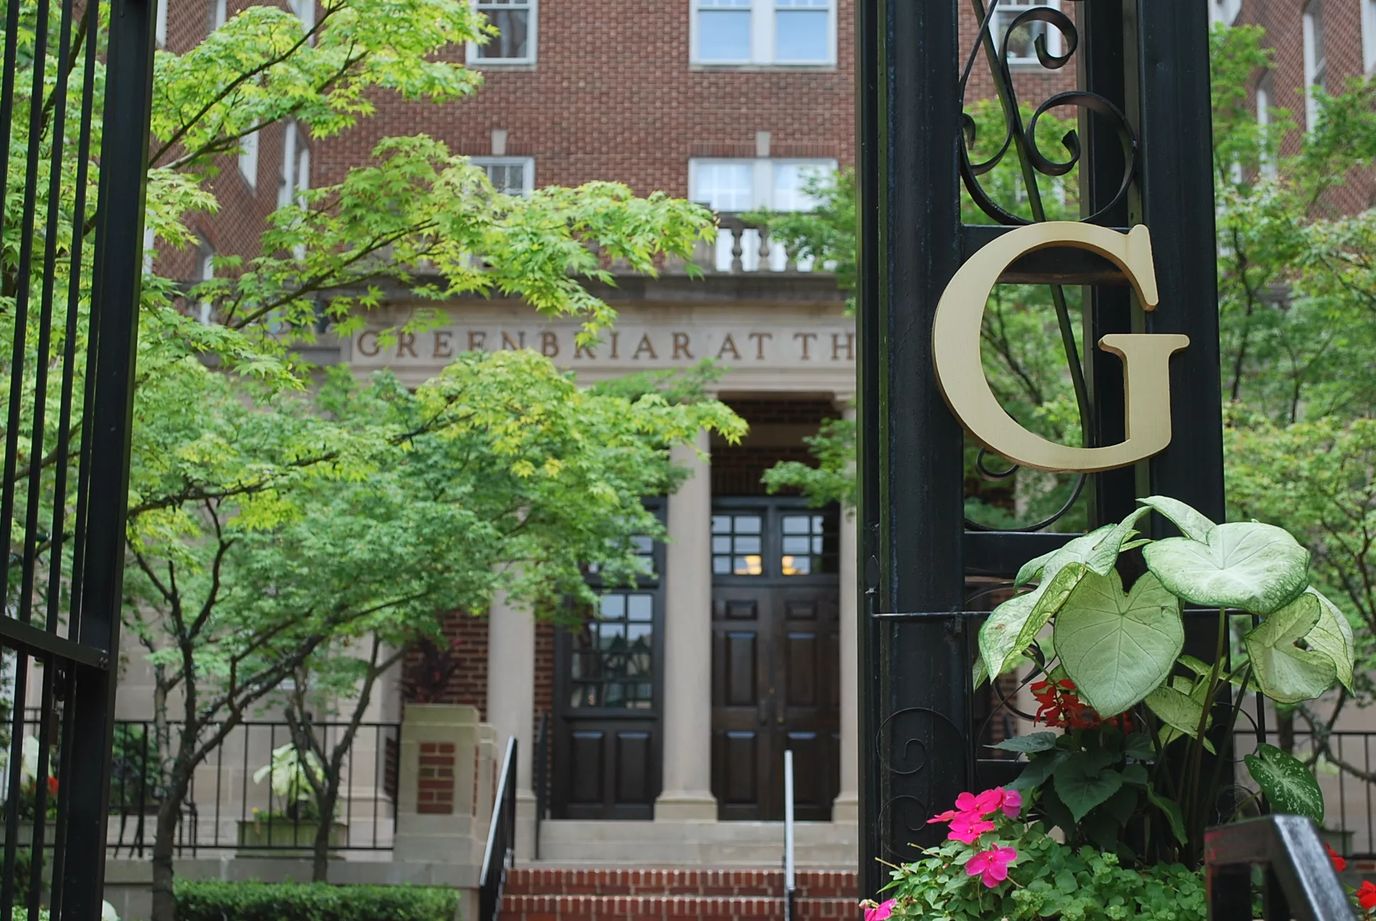
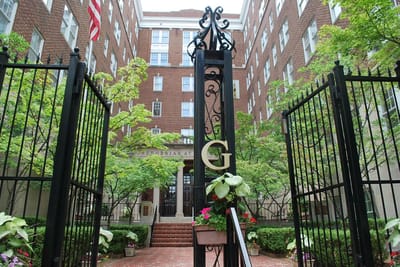
Greenbriar at the Altamont is a senior living community located in the heart of Birmingham, Alabama. The community prides itself on fostering genuine connections and positive culture among its residents. The residents of Greenbriar at the Altamont have diverse backgrounds and fascinating stories to share, creating a unique and enriching experience. Located on historic Highland Avenue, the home offers a range of living options, including rehabilitation, skilled nursing, and assisted living, to meet the individual needs of each resident. 
The community’s 1920s-style luxury lobby exudes elegance and charm, creating a warm and welcoming environment for residents. Unlike many senior living communities, Greenbriar at the Altamont does not require large upfront buy-ins or long-term leases, allowing residents to live life on their terms. Their amenities include fast Wi-Fi, a library, a grand lobby, a salon, and a barbershop. The community’s beautiful landscaping and spectacular views provide a peaceful setting for residents to relax and unwind. At Greenbriar at the Altamont, the focus is on creating a community that celebrates life and fosters personal connections. 

Quality ratings

Measured by Centers for Medicare & Medicaid Services (CMS)

Overall rating Info The Overall CMS Rating combines results from health inspections, staffing levels and quality measures. Health inspections carry the most weight. Staffing and quality scores can increase or decrease the final rating based on performance compared to state and national standards.
▲ 2.0% Above AL avg. ▲ 2.0% Above AL avg.AL average: 2.9Click the badge to see the full State ranking.Click here to see the full State ranking.
Health Inspection Info Based on the results of the facility's three most recent standard inspections and any complaint investigations. CMS reviews the number, scope, and severity of deficiencies, with more recent findings weighted more heavily.
▲ 5.9% Above AL avg. ▲ 5.9% Above AL avg.AL average: 2.8Click the badge to see the full State ranking.Click here to see the full State ranking.
Staffing Info Measures average nursing staff hours per resident per day, including Registered Nurses (RNs) and total nursing staff. Ratings are adjusted based on the level of care residents require and are compared to state and national benchmarks.
▲ 12.9% Above AL avg. ▲ 12.9% Above AL avg.AL average: 3.5Click the badge to see the full State ranking.Click here to see the full State ranking.
Quality Measures Info Based on clinical and physical health indicators reported to CMS, such as hospital readmissions, falls, pressure ulcers, and improvements in mobility. These measures reflect how well residents' health needs are being managed.
▲ 34.3% Above AL avg. ▲ 34.3% Above AL avg.AL average: 3.0Click the badge to see the full State ranking.Click here to see the full State ranking.

Staffing hours breakdown

Info Daily nursing hours per resident by staff type, reported to CMS. Higher is generally better — compare this facility to state and national averages to see where staffing stands.

Hours per resident per day — compared to Alabama state averages

Total nursing care / resident Info This home is ranked 97th out of 136 homes in Alabama for nurse hours. Total adjusted nursing hours per resident per day, combining RN, LPN, and aide time. CMS adjusts this for case-mix so facilities can be fairly compared.
4h 2m per day
Rank #97 / 136Nurse hours — State benchmarkedThis home is ranked 97th out of 136 homes in Alabama. Shows adjusted nurse hours per resident per day benchmarked to the Alabama average, with a ranking across 136 Alabama facilities. More hours mean more direct care. The national average is about 3.5 hrs; below 3.0 is a red flag.Rankings are based only on facilities in Alabama that report data for that category. Facilities without available data are excluded from the ranking.Click the rank badge to see the full State ranking.Click here to see the full State ranking.
This facility Alabama avg (4h 22m per day)
vs Alabama avg
-8%

4 of 6 metrics below state avg

Standout metric Physical Therapist is +5% above state avg
Staff typeHours / Day / Residentvs state avg
Registered Nurse (RN) Info RNs hold the highest nursing license and can assess residents, interpret test results, and direct care plans. More RN hours per day often signals stronger clinical oversight and faster response to health changes. 37m per day ▼ 3% State avg: 38m per day · National avg: 41m per day
LPN / LVN Info Licensed Practical Nurses (LPNs) or Licensed Vocational Nurses (LVNs) deliver routine hands-on care — medication administration, wound dressing, and monitoring vital signs. They work under RN supervision and make up a large share of daily bedside care. 45m per day ▼ 5% State avg: 47m per day · National avg: 52m per day
Nurse Aide Info Certified Nurse Aides (CNAs) provide the most direct day-to-day assistance: bathing, dressing, feeding, and mobility. Nurse aide hours are typically the largest staffing category and directly affect residents' quality of life. 2h 30m per day ■ Avg State avg: 2h 30m per day · National avg: 2h 21m per day
Weekend Total Nursing Info Combined nursing hours (RN + LPN + Nurse Aide) per resident per day on weekends. Staffing often drops on weekends — this figure reveals whether the facility maintains adequate coverage outside of weekday hours. 3h 1m per day ▼ 8% State avg: 3h 17m per day · National avg: 3h 26m per day
Physical Therapist Info Hours per resident per day provided by licensed Physical Therapists (PTs) or PT Assistants. PT services help residents recover mobility after injury or illness and are especially important for post-acute (short-stay) rehabilitation. 2m per day ▲ 5% State avg: 2m per day · National avg: 4m per day
Weekend RN Info Registered nurse hours specifically on weekends. Facilities sometimes reduce RN presence on Saturdays and Sundays — a low weekend RN figure compared to weekday hours can indicate reduced clinical oversight when most administrative staff are absent. 17m per day ▼ 22% State avg: 22m per day · National avg: 29m per day

Capacity and availability

Avg. Length of Stay
131 days
Bed community size
46-bed community Rank #195 / 245Bed count — State benchmarkedThis home is ranked 195th out of 245 homes in Alabama. Shows this facility's certified or reported bed count compared to other Alabama facilities. Larger communities may offer more amenities, programs, and on-site services for residents and families.Rankings are based only on facilities in Alabama that report data for that category. Facilities without available data are excluded from the ranking.Click the rank badge to see the full State ranking.Click here to see the full State ranking.
A moderately sized community that may balance personal attention with shared amenities and social activities.
Walk Score
Walk Score: 71 / 100 Rank #21 / 418Walk Score — State benchmarkedThis home is ranked 21st out of 418 homes in Alabama. Shows how walkable this facility's neighborhood is compared to the average Walk Score across Alabama facilities. Higher scores benefit residents, families, and staff.Rankings are based only on facilities in Alabama that report data for that category. Facilities without available data are excluded from the ranking.Click the rank badge to see the full State ranking.Click here to see the full State ranking.
Very walkable. Most errands can be accomplished on foot, and many essentials are within a short walk.

About this community

Occupancy

Occupancy rate
100%
Rank #1 / 138Occupancy rate — State benchmarkedThis home is ranked 1st out of 138 homes in Alabama. Shows this facility's occupancy rate versus the Alabama average, with its Statewide rank out of 138. Higher occupancy signals strong local demand and financial stability.Rankings are based only on facilities in Alabama that report data for that category. Facilities without available data are excluded from the ranking.Click the rank badge to see the full State ranking.Click here to see the full State ranking.
Higher than the Alabama average: 80.8%
Occupied beds
46 / 46
Average occupied beds in Alabama homes 97 beds

License Details

Facility TypeAssisted Living Facility
StatusRegular
CountyJefferson
Business TypeLimited Liability Company
CMS Certification Number15446

Ownership & Operating Entity

Greenbriar at the Altamont is administered by Jennifer Shunnarah.

Contact Greenbriar at the Altamont

Inspection History

In Alabama, the Department of Public Health, Bureau of Health Provider Standards conducts unannounced surveys to ensure facilities meet state licensing and federal certification safety standards.

Since 2018 · 8 years of data 11 deficiencies

Inspection Scorecard Info This scorecard compares key inspection, deficiency, and complaint metrics at this facility against the Alabama state average. Metrics rated ≥15% worse than average are highlighted in red; those ≥15% better are highlighted in green.

Since 2018 vs. Alabama state average
Overall vs. AL average 0 Worse No metrics in this bucket. 2 Better Metrics better than Alabama average:
• Total deficiencies (35% below)
• Deficiencies per year (33% below)
Latest Inspection April 8, 2021 Routine

Deficiencies Info Deficiencies are formal regulatory issues recorded during state inspections.

This FacilityAL Averagevs. AL Avg
Total deficiencies Info Formal regulatory issues recorded by inspectors across all inspection types. 1117 This facility has 35% fewer total deficiencies than a typical Alabama nursing home (11 vs. AL avg 17).↓ 35% better
Deficiencies per year Info Average deficiencies per year since 2018. 1.42.1 This facility has 33% fewer deficiencies per year than a typical Alabama nursing home (1.4 vs. AL avg 2.1).↓ 33% better

Inspection Reports Summary Info An editor-reviewed summary of the themes and findings across this facility's recent inspection reports.

  • April 8, 2021 inspection found one deficiency for a rough, uneven kitchen floor that accumulated dirt and posed contamination risks.
  • February 6, 2020 complaint investigation cited failure to timely report abuse allegations for three residents and failure to label and date frozen food items.
  • December 12, 2018 inspection found three deficiencies including inaccessible survey results, missing medication destruction signatures, and an LPN not washing hands before and after topical medication.

Health Inspection History

Inspections since 2018
Total health inspections 3

Alabama average 2.9


Last Health inspection on Apr 2021

Total health citations
6 Rank #31 / 136Health citations — State benchmarkedThis home is ranked 31st out of 136 homes in Alabama. Shows this facility's total health deficiency citations benchmarked to the Alabama State average, with a ranking across all 136 AL facilities. Lower citation counts earn a better rank.Rankings are based only on facilities in Alabama that report data for that category. Facilities without available data are excluded from the ranking.Click the rank badge to see the full State ranking.Click here to see the full State ranking.

Alabama average 10.4

Citations per inspection
2 Rank #15 / 136Citations per inspection — State benchmarkedThis home is ranked 15th out of 136 homes in Alabama. Shows average deficiency citations per CMS inspection for this facility versus the Alabama mean across 136 facilities with citation data. Lower is better.Rankings are based only on facilities in Alabama that report data for that category. Facilities without available data are excluded from the ranking.Click the rank badge to see the full State ranking.Click here to see the full State ranking.

Alabama average 3.46


Health citations are formal notices following inspections when they fail to comply with safety and care standards.

All 6 citations resulted from standard inspections.

Breakdown of citation severity (last 8 years)
Critical health citations
0
100% better than Alabama average

Alabama average: 0.7


Serious health citations
0
100% better than Alabama average

Alabama average: 0.2

0 critical citations Alabama average: 0.7

0 serious citations Alabama average: 0.2

5 moderate citations Alabama average: 9.1

1 minor citation Alabama average: 0.4
Citations history (last 8 years)
Nutrition moderate citation Apr 08, 2021
Corrected

Abuse/Neglect moderate citation Feb 06, 2020
Corrected

Nutrition moderate citation Feb 06, 2020
Corrected

Infection Control moderate citation Dec 12, 2018
Corrected

Staffing Data

Reporting period: October 1 – December 31, 2025 (Q4 2025). Source: CMS Payroll-Based Journal report.

Total staff 128
Employees 96
Contractors 32
Staff to resident ratio 1.64 : 1
5% more staff per resident than Alabama average
Alabama average ratio: 1.56 : 1 Alabama average ratio: 1.56 : 1See full Alabama ranking
Avg staff/day 52
Average shift 7.6 hours
0% compared with Alabama average
Alabama average: 7.9 hours Alabama average shift: 7.9 hoursSee full Alabama ranking
Total staff hours (quarter) 36,524

Nursing staff breakdown

Q4 2025 · Oct 1 – Dec 31 More info This data comes from the CMS Payroll-Based Journal report covering October 1 – December 31, 2025.
Registered Nurse

Manages medical care and health needs.

RN Staff Info All 11 RN Staff are full-time employees. No contractors work on this role. 11
Average shift length Info Average shift length. Calculated as total hours divided by days worked and average staff per day. 8.3 hours
Licensed Practical Nurse

Assists with medical care and medications.

LPN Staff Info All 15 LPN Staff are full-time employees. No contractors work on this role. 15
Average shift length Info Average shift length. Calculated as total hours divided by days worked and average staff per day. 8.2 hours
Certified Nursing Assistant

Helps with daily care and mobility.

CNA Staff Info All 53 CNA Staff are full-time employees. No contractors work on this role. 53
Average shift length Info Average shift length. Calculated as total hours divided by days worked and average staff per day. 7.7 hours

Contractor staffing

Q4 2025 · Oct 1 – Dec 31 More info This data comes from the CMS Payroll-Based Journal report covering October 1 – December 31, 2025.

Total hours from contractors

6.3%

2,308 contractor hours this quarter

Physical Therapy Assistant: 8 Qualified Social Worker: 7 Physical Therapy Aide: 7 Speech Language Pathologist: 6 Respiratory Therapy Technician: 2 Medical Director: 1 Occupational Therapy Assistant: 1

Staff by category

Q4 2025 · Oct 1 – Dec 31 More info This data comes from the CMS Payroll-Based Journal report covering October 1 – December 31, 2025.
Certified Nursing Assistant5305319,10692100%7.7
Licensed Practical Nurse150156,15792100%8.2
Registered Nurse110113,52692100%8.3
Nurse Aide in Training6061,6408795%7.2
Clinical Nurse Specialist5051,0737177%8
Qualified Social Worker0776707177%5.4
Physical Therapy Aide0775246672%5.6
Other Dietary Services Staff1015216470%8.1
Nurse Practitioner1015045964%8.5
Mental Health Service Worker1014966267%8
Speech Language Pathologist0664817784%5.5
Administrator1014726065%7.9
Dietitian1014635155%9.1
Respiratory Therapy Technician0222896368%4.6
Occupational Therapy Aide1012603639%7.2
Physical Therapy Assistant0881905459%3.2
Medical Director0111121415%8
Occupational Therapy Assistant01142910%4.7
53 Certified Nursing Assistant
% of Days 100%
15 Licensed Practical Nurse
% of Days 100%
11 Registered Nurse
% of Days 100%
6 Nurse Aide in Training
% of Days 95%
5 Clinical Nurse Specialist
% of Days 77%
7 Qualified Social Worker
% of Days 77%
7 Physical Therapy Aide
% of Days 72%
1 Other Dietary Services Staff
% of Days 70%
1 Nurse Practitioner
% of Days 64%
1 Mental Health Service Worker
% of Days 67%
6 Speech Language Pathologist
% of Days 84%
1 Administrator
% of Days 65%
1 Dietitian
% of Days 55%
2 Respiratory Therapy Technician
% of Days 68%
1 Occupational Therapy Aide
% of Days 39%
8 Physical Therapy Assistant
% of Days 59%
1 Medical Director
% of Days 15%
1 Occupational Therapy Assistant
% of Days 10%

Penalties and fines

Federal penalties imposed by CMS for regulatory violations, including civil money penalties (fines) and denials of payment for new Medicare/Medicaid admissions.

Source: CMS Penalties Database

No penalties in the past 3 years

No civil money penalties or payment denials were reported in the last 3 years.

Quality of care over time

These measures show how residents usually do over time at this home, based on health outcomes and preventive care.

High-risk clinical events score Info A composite score based on pressure ulcers, falls with injury, weight loss, walking ability decline, and activities of daily living decline. 6.5
28% better than Alabama average

Alabama average: 8.9

Functional decline score Info A composite score based on activities of daily living decline, walking ability decline, and incontinence. 7.2
50% better than Alabama average

Alabama average: 14.5

Long-stay resident measures
Average Alabama avg: 3.3 Info CMS star rating based on long-stay quality measure performance. 5 stars = significantly above average, 1 star = significantly below average.
Need for Help with Daily Activities Increased Info Percent of long-stay residents whose need for help with daily activities has increased 7.8%
44% better than Alabama average

Alabama average: 13.9%

Walking Ability Worsened Info Percent of long-stay residents whose ability to move independently worsened 11.1%
31% better than Alabama average

Alabama average: 16.1%

Low Risk Residents with Bowel/Bladder Incontinence Info Percent of low risk long-stay residents who lose control of their bowels or bladder 2.7%
80% better than Alabama average

Alabama average: 13.6%

Falls with Major Injury Info Percent of long-stay residents experiencing one or more falls with major injury 3.4%
In line with Alabama average

Alabama average: 3.4%

High Risk Residents with Pressure Ulcers Info Percent of long-stay high risk residents with pressure ulcers 3.4%
42% better than Alabama average

Alabama average: 5.9%

Urinary Tract Infection Info Percent of long-stay residents with a urinary tract infection 3.1%
14% worse than Alabama average

Alabama average: 2.7%

Lost Too Much Weight Info Percent of long-stay residents who lose too much weight 6.6%
21% worse than Alabama average

Alabama average: 5.4%

Depressive Symptoms Info Percent of long-stay residents who have depressive symptoms 0.0%
100% better than Alabama average

Alabama average: 1.2%

Antipsychotic Use Info Percent of long-stay residents who received an antipsychotic medication 19.1%
7% better than Alabama average

Alabama average: 20.7%

Pneumococcal Vaccine Info Percent of long-stay residents assessed and appropriately given the pneumococcal vaccine 94.3%
In line with Alabama average

Alabama average: 91.5%

Influenza Vaccine Info Percent of long-stay residents assessed and appropriately given the seasonal influenza vaccine 96.3%
In line with Alabama average

Alabama average: 94.8%

Hospitalizations per 1,000 days Info Number of hospitalizations per 1,000 long-stay resident days. 3.21
61% worse than Alabama average

Alabama average: 2.00

ED visits per 1,000 days Info Number of outpatient emergency department visits per 1,000 long-stay resident days. 2.21
23% worse than Alabama average

Alabama average: 1.79

Short-stay resident measures
Below average Alabama avg: 2.1 Info CMS star rating based on short-stay quality measure performance. 5 stars = much above average, 1 star = much below average.
Pneumococcal Vaccine Info Percent of short-stay residents assessed and appropriately given the pneumococcal vaccine 60.4%
28% worse than Alabama average

Alabama average: 83.7%

Antipsychotic medication increase Info Percent of short-stay residents who newly received an antipsychotic medication 1.8%
13% better than Alabama average

Alabama average: 2.1%

Influenza Vaccine Info Percent of short-stay residents assessed and appropriately given the seasonal influenza vaccine 68.5%
15% worse than Alabama average

Alabama average: 80.3%

Re-hospitalized after SNF stay Info Percentage of short-stay residents who were re-hospitalized after their nursing home admission. 24.5%
In line with Alabama average

Alabama average: 24.5%

Emergency department visits Info Percentage of short-stay residents who had an outpatient emergency department visit. 8.7%
24% better than Alabama average

Alabama average: 11.5%

Falls with major injury Info Percentage of SNF residents who experience falls with major injury during their stay. 0.0%
100% better than Alabama average

Alabama average: 0.8%

Ability to care for self at discharge Info Percentage of residents at or above expected ability to care for themselves at discharge. 37.9%
29% worse than Alabama average

Alabama average: 53.7%

Successful return to home or community Info Rate of successful return to home or community from a skilled nursing facility. 52.8%
In line with Alabama average

Alabama average: 50.6%

Breakdown by payment type

Medicare

24% of new residents, usually for short-term rehab.

Typical stay 30 days

Private pay

52% of new residents, often for short stays.

Typical stay 2 - 3 months

Medicaid

24% of new residents, often for long-term daily care.

Typical stay 11 - 12 months

Facility Characteristics

Source: CMS Long-Term Care Facility Characteristics (Data as of Jan 2026)

Total residents 78
Medicare
4
5.1% of residents
Medicaid
50
64.1% of residents
Private pay or other
24
30.8% of residents
Programs & Services
Residents Group

Residents meet regularly to discuss policies, care quality, and activities

Family Member Group

Family members meet regularly to discuss policies, care quality, and activities

CCRC

Part of a Continuing Care Retirement Community offering multiple care levels

Active Family Council

Organized group of family members that meets regularly to discuss facility policies, resident care, and activities.

Active Resident Council

Organized group of residents that meets regularly to discuss facility policies, quality of life, and activities.

Finances and operations

Based on CMS SNF Cost Report for fiscal year ending in 06/2024.

Nonprofit
Nonprofit Corporation
Net patient revenue Info Net patient revenue — what the home actually collects for resident care, after contractual allowances, bad debt and discounts are subtracted from its gross charges (CMS cost report, Worksheet G-3). It covers resident care only; money the home earns from other sources is shown separately as "Other income."
$9.7M
Net patient income Info Net patient income: net patient revenue minus the home's total operating expenses. A positive figure means it earns more from resident care than it spends to deliver it; a negative figure means the opposite. It excludes non-operating "other income."
$661.9K
Nonprofit Nonprofit Corporation
Net patient revenue Info Net patient revenue — what the home actually collects for resident care, after contractual allowances, bad debt and discounts are subtracted from its gross charges (CMS cost report, Worksheet G-3). It covers resident care only; money the home earns from other sources is shown separately as "Other income."
$9.7M Rank #56 / 135Revenue — State benchmarkedThis home is ranked 56th out of 135 homes in Alabama. Shows this facility's annual revenue compared to the Alabama average. Higher revenue generally means more resources for staffing and capital — read alongside Payroll %.Rankings are based only on facilities in Alabama that report data for that category. Facilities without available data are excluded from the ranking.Click the rank badge to see the full State ranking.Click here to see the full State ranking.
Net patient income Info Net patient income: net patient revenue minus the home's total operating expenses. A positive figure means it earns more from resident care than it spends to deliver it; a negative figure means the opposite. It excludes non-operating "other income."
$661.9K
Other income Info Money the home earns outside of resident care — such as investments, grants, rentals and other non-operating sources (CMS cost report, Worksheet G-3). It is tracked separately from net patient revenue: it is not part of that figure, and it is not included in net patient income.
$80.1K
Payroll costs Info Staff salaries plus wage-related costs — benefits such as payroll taxes, health insurance and retirement — from the home's own accounting records (CMS cost report, Worksheet A). Contract or agency labor is counted separately, under other operating costs. Rank #56 / 135Payroll — State benchmarkedThis home is ranked 56th out of 135 homes in Alabama. Shows total annual staff payroll benchmarked to the Alabama average. Higher payroll investment relative to peers often signals better staffing and less reliance on cheaper contract labor.Rankings are based only on facilities in Alabama that report data for that category. Facilities without available data are excluded from the ranking.Click the rank badge to see the full State ranking.Click here to see the full State ranking.
$5.6M 57.6% of net patient revenue Info Payroll as a share of revenue: staff salaries and wage-related benefits divided by net patient revenue. A higher figure means more of each revenue dollar goes to staff pay. Rank #86 / 133Payroll % — State benchmarkedThis home is ranked 86th out of 133 homes in Alabama. Shows payroll as a percentage of revenue versus the Alabama average. Well-run Alabama facilities typically land around 54–69% — the top third Statewide. Below 25% may signal understaffing or heavy agency use — read with Staffing ratings.Rankings are based only on facilities in Alabama that report data for that category. Facilities without available data are excluded from the ranking.Click the rank badge to see the full State ranking.Click here to see the full State ranking.
Other operating costs Info Everything it costs to run the home apart from payroll — food, utilities, supplies, maintenance, contract labor and administration. Calculated as total operating expense minus payroll (staff salaries and wage-related benefits).
$3.5M
Total costs Info The home's total operating expense for the year — all the costs of running it, salaries included (CMS cost report, Worksheet G-3).
$9.0M

Who this home usually serves

TYPE OF STAY

Mix of rehab and long-term care

This home supports both short-term rehab and long-term care, with residents staying for a wide range of durations.

Most new residents arrive under private pay (52% of admissions), and a typical private pay stay runs around 2 - 3 months.

Admissions
232 total

Coverage residents most often arrive under.

Medicare 24%
Private pay 52%
Medicaid 24%
Discharges
238 total

Coverage residents most often leave under.

Medicare 15%
Private pay 56%
Medicaid 29%

Places of interest near Greenbriar at the Altamont

Address 1.8 miles from city center Info Estimated distance in miles from Birmingham's city center to Greenbriar at the Altamont's address, calculated via Google Maps.

Calculate Travel Distance to Greenbriar at the Altamont

Add your location

Address

Compare Nursing Homes around Birmingham

The information below is reported by the Alabama Department of Public Health, Bureau of Health Provider Standards.

5 facilities compared · CMS & AL Dept. of Health data

Greenbriar at the Altamont
NH
AL
HC
IL
NC
RC
Birmingham (Highland Park)
46
Facility 46
AL AVG 90
Rank #195 / 245
100.0%
Facility 100.0%
AL AVG 80.8%
Rank #1 / 138
+24%
4.03
Facility 4.03
AL AVG 4.37
Rank #97 / 136
-16%-8%
$0
Facility $0
AL AVG $59.8k
Rank #1 / 137
6
Facility 6
AL AVG 10.4
Rank #31 / 136
2.0
Facility 2.0
AL AVG 3.5
Rank #15 / 136
-90-
71
Facility 71
AL AVG 36
Rank #21 / 418
Jennifer Shunnara
$9.7M
Facility $9.7M
AL AVG $11.1M
Rank #56 / 135
$5.6M
Facility $5.6M
AL AVG $4.7M
Rank #56 / 135
57.6%
Facility 57.6%
AL AVG 45%
Rank #86 / 133
15446
Galleria Woods
NH
AL
IL
NC
RC
Birmingham
24
Facility 24
AL AVG 90
Rank #234 / 245
88.5%
Facility 88.5%
AL AVG 80.8%
Rank #40 / 138
+10%
5.15
Facility 5.15
AL AVG 4.37
Rank #17 / 136
+56%+18%
$0
Facility $0
AL AVG $59.8k
Rank #1 / 137
10
Facility 10
AL AVG 10.4
Rank #67 / 136
3.3
Facility 3.3
AL AVG 3.5
Rank #66 / 136
-26A+
28
Facility 28
AL AVG 36
Rank #255 / 418
Ccrc Opco Ventures LLC
$4.0M
Facility $4.0M
AL AVG $11.1M
Rank #36 / 135
$5.3M
Facility $5.3M
AL AVG $4.7M
Rank #61 / 135
132.4%
Facility 132.4%
AL AVG 45%
Rank #128 / 133
15459
Eastview Rehabilitation & Healthcare Center
NH
Birmingham (South Eastlake)
92
Facility 92
AL AVG 90
Rank #101 / 245
67.4%
Facility 67.4%
AL AVG 80.8%
Rank #106 / 138
-17%
4.39
Facility 4.39
AL AVG 4.37
Rank #68 / 136
-8%+1%
$0
Facility $0
AL AVG $59.8k
Rank #1 / 137
8
Facility 8
AL AVG 10.4
Rank #49 / 136
2.0
Facility 2.0
AL AVG 3.5
Rank #15 / 136
-70-
58
Facility 58
AL AVG 36
Rank #71 / 418
Clarence Ball
$8.9M
Facility $8.9M
AL AVG $11.1M
Rank #95 / 135
$4.7M
Facility $4.7M
AL AVG $4.7M
Rank #67 / 135
52.8%
Facility 52.8%
AL AVG 45%
Rank #26 / 133
15014
Birmingham Nursing and Rehabilitation Center East
NH
Birmingham
132
Facility 132
AL AVG 90
Rank #47 / 245
80.0%
Facility 80.0%
AL AVG 80.8%
Rank #82 / 138
-1%
2.89
Facility 2.89
AL AVG 4.37
Rank #132 / 136
-51%-34%
$24.8k
Facility $24.8k
AL AVG $59.8k
Rank #119 / 137
14
Facility 14
AL AVG 10.4
Rank #106 / 136
4.7
Facility 4.7
AL AVG 3.5
Rank #105 / 136
5119-
12
Facility 12
AL AVG 36
Rank #332 / 418
Melody Burch
$9.1M
Facility $9.1M
AL AVG $11.1M
Rank #83 / 135
$5.1M
Facility $5.1M
AL AVG $4.7M
Rank #63 / 135
56.5%
Facility 56.5%
AL AVG 45%
Rank #40 / 133
15134
St. Martin’s in the Pines
NH
AL
HC
IL
MC
NC
Birmingham (Eastwood)
71
Facility 71
AL AVG 90
Rank #142 / 245
39.3%
Facility 39.3%
AL AVG 80.8%
Rank #132 / 138
-51%
4.00
Facility 4.00
AL AVG 4.37
Rank #97 / 136
-19%-9%
$0
Facility $0
AL AVG $59.8k
Rank #1 / 137
13
Facility 13
AL AVG 10.4
Rank #98 / 136
3.3
Facility 3.3
AL AVG 3.5
Rank #66 / 136
195A+
39
Facility 39
AL AVG 36
Rank #195 / 418
Trina Vines
$4.2M
Facility $4.2M
AL AVG $11.1M
Rank #33 / 135
$2.3M
Facility $2.3M
AL AVG $4.7M
Rank #24 / 135
55.7%
Facility 55.7%
AL AVG 45%
Rank #50 / 133
15433

Financial Assistance for
Nursing Home in Alabama

Greenbriar at the Altamont is located in Birmingham, Alabama.
Here are the financial assistance programs available to residents in Alabama.

Get Financial aid guidance

Elderly and Disabled Waiver

Alabama Medicaid E&D Waiver

Age 65+ or disabled
General Alabama resident, Medicaid-eligible, requires nursing home-level care but can live in community with support.
Income Limits (2025) ~$2,829/month 300% FBR, individual
Asset Limits $2,000 (individual), $3,000 (couple) (excludes home, car).
AL

Must be assessed by a nurse for nursing home-level care need.

Benefits
In-home personal care (4-6 hours/day, e.g., bathing, dressing) Respite care (up to 240 hours/year) Adult day care (~$50/day avg.) Home-delivered meals Case management

Alabama Respite for Caregivers Program

Alabama Respite (via NFCSP)

Age Caregiver of someone 60+ (or with dementia)
General Alabama resident.
Income Limits No strict limit; prioritizes low-income.
Asset Limits Not applicable.
AL

Focus on rural caregivers; limited funding.

Benefits
In-home respite (4-6 hours/day) Adult day care (~$50/day) Short-term facility care (up to 5 days)

SenioRx Prescription Assistance Program

AL SenioRx

Age 55+
General Alabama resident, chronic illness requiring daily medication, not fully covered by other drug plans.
Income Limits ~$3,000/month individual, varies by AAA
Asset Limits Not strictly enforced; income-focused.
AL

High ROI; saved $43.5M for 6,825 participants in FY 2022.

Benefits
Prescription cost reduction (avg. $6,300/year savings per participant) Medication management support

Weatherization Assistance Program (WAP)

AL WAP

Age 60+ priority
General Alabama resident, own or rent home, low-income status.
Income Limits (2025) ~$2,510/month 200% of poverty level, individual
Asset Limits Not applicable; income-driven.
AL

Prioritizes seniors and disabled; limited annual funding.

Benefits
Insulation Weather stripping HVAC repairs (avg. $500-$1,000 in annual energy savings)

Section 202 Supportive Housing for the Elderly

AL Section 202

Age 62+
General Alabama resident, very low income, able to live independently with support.
Income Limits (2025) ~$1,500/month 50% of area median income, individual, varies by county
Asset Limits $10,000 individual, excludes home if owned
AL

High demand in urban areas like Birmingham; limited units statewide.

Benefits
Subsidized rent (30% of income, e.g., $300-$500/month) On-site services (housekeeping, transportation, ~$200/month value)

Alabama CARES Program

AL CARES

Age
General Caregivers of Alabama residents aged 60+ needing assistance with 3+ daily activities; no age limit for caregivers.
Income Limits No strict limit; cost-sharing based on recipient’s income e.g., ~$2,500/month threshold
Asset Limits Not applicable; focus on need.
AL

Prioritizes caregivers with greatest economic/social need; complements respite programs like AL Lifespan Respite.

Benefits
Respite care (up to 10 days/year) Counseling (4-6 sessions/year) Training (2-3 workshops/year) Supplemental supplies (e.g., $200/year avg.)

Frequently Asked Questions about Greenbriar at the Altamont

What neighborhood is Greenbriar at the Altamont in?

Greenbriar at the Altamont is in the Highland Park neighborhood of Birmingham.

Is Greenbriar at the Altamont in a walkable area?

Greenbriar at the Altamont has a walk score of 71. Very walkable. Most errands can be accomplished on foot, and many essentials are within a short walk.

What is the occupancy rate at Greenbriar at the Altamont?

Greenbriar at the Altamont's occupancy is 100%.

Does Greenbriar at the Altamont operate as a for-profit or non-profit?

Greenbriar at the Altamont is registered as a non-profit in AL.

Who is the administrator of Greenbriar at the Altamont?

Jennifer Shunnarah is the administrator of Greenbriar at the Altamont.

How many beds does Greenbriar at the Altamont have?

Greenbriar at the Altamont has 46 beds.

Are there photos of Greenbriar at the Altamont?

Yes — there are 6 photos of Greenbriar at the Altamont in the photo gallery on this page.

Guides for Better Senior Living

Care Cost Calculator: See Prices in Your Area

Nursing Home Data Explorer

Don’t Wait Too Long: 7 Red Flag Signs Your Parent Needs Assisted Living Now

The True Cost of Assisted Living in 2025 – And How Families Are Paying For It

Understanding Senior Living Costs: Pricing Models, Discounts & Financial Assistance