Northway Health and Rehabilitation, LLC
Nursing Home · Birmingham, AL
CMS overall rating Info The Overall CMS Rating is scored from 1 to 5 stars and combines results from health inspections, staffing levels, and quality measures. Health inspections carry the most weight. Staffing and quality scores can increase or decrease the final rating based on performance compared to state and national standards.

Northway Health and Rehabilitation, LLC

Nursing Home · Birmingham, AL
CMS overall rating Info The Overall CMS Rating is scored from 1 to 5 stars and combines results from health inspections, staffing levels, and quality measures. Health inspections carry the most weight. Staffing and quality scores can increase or decrease the final rating based on performance compared to state and national standards.
Calculator: See prices in your area
Northway Health and Rehabilitation, LLC accepts Medicare, Medicaid, and private pay.

Overview of Northway Health and Rehabilitation, LLC

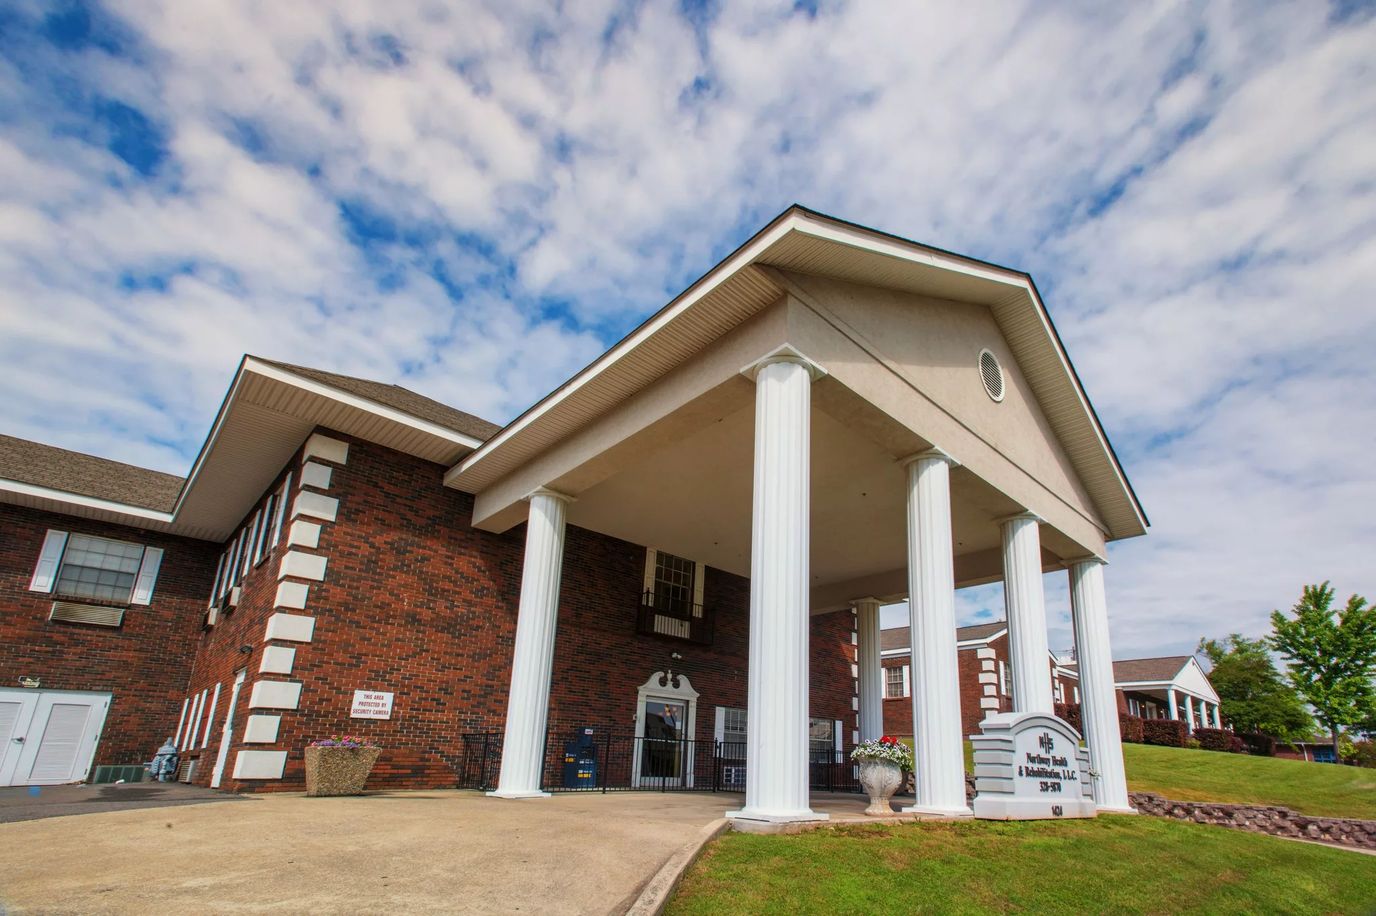
Northway Health and Rehabilitation LLC provides the comfortable and carefree lifestyle that seniors want and deserve. The facility offers a range of services, including skilled nursing, rehabilitation, rapid recovery, and memory care. Their team of highly trained nurses and certified therapists renders a myriad of clinical capabilities, including pain management, fall prevention, wound management, swallowing disorders, and cardiac recovery, to name a few.
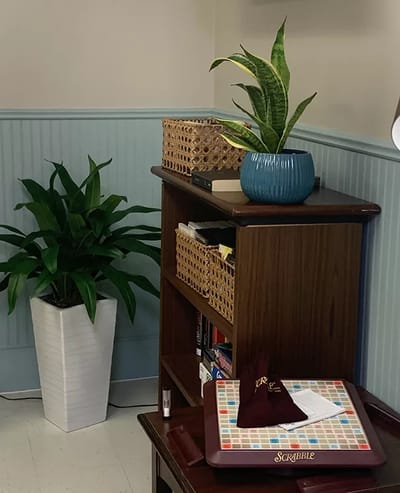
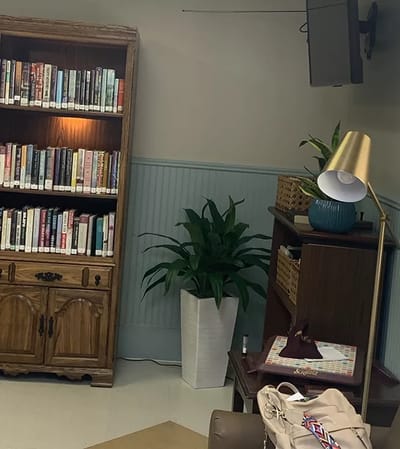
In Northway Health and Rehabilitation LLC, they understand the importance of healthy and delicious meals, and that’s why they offer an eclectic mix of cuisine options to their residents. The facility also provides amenities such as WiFi, laundry, and a beautician, ensuring that residents have everything they need. Moreover, their common areas are crafted to be pleasant and welcoming, making it easy for seniors to find respite from the challenges of aging.

(205) 328-5870

Quality ratings

Measured by Centers for Medicare & Medicaid Services (CMS)

Overall rating Info The Overall CMS Rating combines results from health inspections, staffing levels and quality measures. Health inspections carry the most weight. Staffing and quality scores can increase or decrease the final rating based on performance compared to state and national standards.
▼ 31.3% Below AL avg. ▼ 31.3% Below AL avg.Click the badge to see the full State ranking.Click here to see the full State ranking.
Health Inspection Info Based on the results of the facility's three most recent standard inspections and any complaint investigations. CMS reviews the number, scope, and severity of deficiencies, with more recent findings weighted more heavily.
▼ 30.1% Below AL avg. ▼ 30.1% Below AL avg.Click the badge to see the full State ranking.Click here to see the full State ranking.
Staffing Info Measures average nursing staff hours per resident per day, including Registered Nurses (RNs) and total nursing staff. Ratings are adjusted based on the level of care residents require and are compared to state and national benchmarks.
▲ 11.1% Above AL avg. ▲ 11.1% Above AL avg.Click the badge to see the full State ranking.Click here to see the full State ranking.
Quality Measures Info Based on clinical and physical health indicators reported to CMS, such as hospital readmissions, falls, pressure ulcers, and improvements in mobility. These measures reflect how well residents' health needs are being managed.
At AL avg. At AL avg.Click the badge to see the full State ranking.Click here to see the full State ranking.

Staffing hours breakdown

Info Daily nursing hours per resident by staff type, reported to CMS. Higher is generally better — compare this facility to state and national averages to see where staffing stands.

Hours per resident per day — compared to Alabama state averages

Total nursing care / resident Info This home is ranked 12th out of 130 homes in Alabama. Total adjusted nursing hours per resident per day, combining RN, LPN, and aide time. CMS adjusts this for case-mix so facilities can be fairly compared.
5h 13m per day
Rank #12 / 130Nurse hours — State benchmarkedThis home is ranked 12th out of 130 homes in Alabama. Shows adjusted nurse hours per resident per day benchmarked to the Alabama average, with a ranking across 130 Alabama SNFs. More hours mean more direct care. The national average is about 3.5 hrs; below 3.0 is a red flag.Click the rank badge to see the full State ranking.Click here to see the full State ranking.
This facility Alabama avg (4h 23m per day)
vs Alabama avg
+19%

4 of 6 metrics below state avg

Standout metric Nurse Aide is +14% above state avg
Staff typeHours / Day / Residentvs state avg
Registered Nurse (RN) Info RNs hold the highest nursing license and can assess residents, interpret test results, and direct care plans. More RN hours per day often signals stronger clinical oversight and faster response to health changes. 18m per day ▼ 53% State avg: 38m per day · National avg: 41m per day
LPN / LVN Info Licensed Practical Nurses (LPNs) or Licensed Vocational Nurses (LVNs) deliver routine hands-on care — medication administration, wound dressing, and monitoring vital signs. They work under RN supervision and make up a large share of daily bedside care. 40m per day ▼ 15% State avg: 47m per day · National avg: 52m per day
Nurse Aide Info Certified Nurse Aides (CNAs) provide the most direct day-to-day assistance: bathing, dressing, feeding, and mobility. Nurse aide hours are typically the largest staffing category and directly affect residents' quality of life. 2h 51m per day ▲ 14% State avg: 2h 30m per day · National avg: 2h 21m per day
Weekend Total Nursing Info Combined nursing hours (RN + LPN + Nurse Aide) per resident per day on weekends. Staffing often drops on weekends — this figure reveals whether the facility maintains adequate coverage outside of weekday hours. 3h 7m per day ▼ 5% State avg: 3h 17m per day · National avg: 3h 26m per day
Physical Therapist Info Hours per resident per day provided by licensed Physical Therapists (PTs) or PT Assistants. PT services help residents recover mobility after injury or illness and are especially important for post-acute (short-stay) rehabilitation. 2m per day ■ Avg State avg: 2m per day · National avg: 4m per day
Weekend RN Info Registered nurse hours specifically on weekends. Facilities sometimes reduce RN presence on Saturdays and Sundays — a low weekend RN figure compared to weekday hours can indicate reduced clinical oversight when most administrative staff are absent. 11m per day ▼ 50% State avg: 22m per day · National avg: 29m per day

Capacity and availability

Avg. Length of Stay
298 days
Bed community size
113-bed community Rank #76 / 247Bed count — State benchmarkedThis home is ranked 76th out of 247 homes in Alabama. Shows this facility's certified or reported bed count compared to other Alabama SNFs. Larger communities may offer more amenities, programs, and on-site services for residents and families.Click the rank badge to see the full State ranking.Click here to see the full State ranking.
A larger shared setting that may offer more common spaces and organized community services.
Walk Score
Walk Score: 44 / 100 Rank #171 / 419Walk Score — State benchmarkedThis home is ranked 171st out of 419 homes in Alabama. Shows how walkable this facility's neighborhood is compared to the average Walk Score across Alabama SNFs. Higher scores benefit residents, families, and staff.Click the rank badge to see the full State ranking.Click here to see the full State ranking.
Somewhat walkable. A few nearby services may be reachable on foot, but most trips require transportation.

About this community

License Details

Facility TypeNursing Home
StatusRegular
CountyJefferson
Business TypeLimited Liability Company

Ownership & Operating Entity

Northway Health and Rehabilitation, LLC is administrated by Derek Patterson (Interim).

Type Of Units

SNF (Skilled Nursing)
113 units
Total beds
113 units

Therapy & Rehabilitation

1 service
Rehabilitation Services

Amenities & Lifestyle

Beautician Services
Laundry Services
Cable Television
Complimentary Wi-Fi
Outdoor Courtyards
Specific ProgramsWeekly Menu, Take A Tour

Dining & Nutrition

Food DescriptionResidents can dine in the comfort of their room or in a restaurant-style dining area.

Contact Northway Health and Rehabilitation, LLC

Inspection History

In Alabama, the Department of Public Health, Bureau of Health Provider Standards conducts unannounced surveys to ensure facilities meet state licensing and federal certification safety standards.

Since 2018 · 8 years of data 33 deficiencies

Inspection Scorecard Info This scorecard compares key inspection, citation, and complaint metrics at this facility against the Alabama state average. Metrics rated ≥15% worse than average are highlighted in red; those ≥15% better are highlighted in green.

Since 2018 vs. Alabama state average
Overall vs. AL average 2 Worse Metrics worse than Alabama average:
• Total deficiencies (94% above)
• Deficiencies per year (95% above)
0 Better No metrics in this bucket.
Latest Inspection April 17, 2024 Complaint Investigation

Deficiencies Info Deficiencies are formal regulatory issues recorded during state inspections.

This FacilityAL Averagevs. AL Avg
Total deficiencies Info Formal regulatory issues recorded by inspectors across all inspection types. 3317 This facility has 94% more total deficiencies than a typical Alabama nursing home (33 vs. AL avg 17).↑ 94% worse
Deficiencies per year Info Average deficiencies per year since 2018. 4.12.1 This facility has 95% more deficiencies per year than a typical Alabama nursing home (4.1 vs. AL avg 2.1).↑ 95% worse

Inspection Reports Summary Info An editor-reviewed summary of the themes and findings across this facility's recent inspection reports.

The facility’s inspection record is problematic due to multiple substantiated deficiencies found on April 17, 2024, including seven citations for medication misappropriation, falsified medication records, poor infection control, delayed mail delivery, and maintenance issues. Inspectors substantiated that a Licensed Practical Nurse signed out but did not administer medications to a resident, and staff failed to follow hand hygiene and glucometer disinfection protocols. Earlier inspections in 2018 and 2019 also flagged infection control and environmental maintenance problems, showing persistent compliance challenges.

Read the full inspection reports for this facility, including detailed findings and corrective actions.

Show Inspection Reports

Health Inspection History

Inspections since 2018
Total health inspections 3

Alabama average 2.9


Last Health inspection on Apr 2024

Total health citations
11 Rank #77 / 130Health citations — State benchmarkedThis home is ranked 77th out of 130 homes in Alabama. Shows this facility's total health deficiency citations benchmarked to the Alabama State average, with a ranking across all 130 AL SNFs. Lower citation counts earn a better rank.Click the rank badge to see the full State ranking.Click here to see the full State ranking.

Alabama average 10.4

Citations per inspection
3.67 Rank #82 / 130Citations per inspection — State benchmarkedThis home is ranked 82nd out of 130 homes in Alabama. Shows average deficiency citations per CMS inspection for this facility versus the Alabama mean across 130 SNFs with citation data. Lower is better.Click the rank badge to see the full State ranking.Click here to see the full State ranking.

Alabama average 3.46


Health citations are formal notices following inspections when they fail to comply with safety and care standards.

4 of 11 citations resulted from standard inspections; 1 of 11 resulted from complaint investigations; and 6 of 11 came from combined inspections (standard and complaint).

Breakdown of citation severity (last 8 years)
Critical health citations
0
100% better than Alabama average

Alabama average: 0.7


Serious health citations
0
100% better than Alabama average

Alabama average: 0.2

0 critical citations Alabama average: 0.7

0 serious citations Alabama average: 0.2

10 moderate citations Alabama average: 9.1

1 minor citation Alabama average: 0.4
Citations history (last 8 years)
Abuse/Neglect moderate citation Apr 17, 2024
Corrected

Infection Control moderate citation Apr 17, 2024
Corrected

Care Planning moderate citation Apr 17, 2024
Corrected

Care Planning moderate citation Apr 17, 2024
Corrected

Staffing Data

Reporting period: October 1 – December 31, 2025 (Q4 2025). Source: CMS Payroll-Based Journal report.

Total staff 125
Employees 106
Contractors 19
Staff to resident ratio 1.15:1
26% worse than Alabama average
Alabama average ratio: 1.56:1 Alabama average ratio: 1.56:1See full Alabama ranking
Avg staff/day 58
Average shift 7.9 hours
0% compared with Alabama average
Alabama average: 7.9 hours Alabama average shift: 7.9 hoursSee full Alabama ranking
Total staff hours (quarter) 41,926

Nursing staff breakdown

Q4 2025 · Oct 1 – Dec 31 More info This data comes from the CMS Payroll-Based Journal report covering October 1 – December 31, 2025.
Registered Nurse

Manages medical care and health needs.

RN Staff 8
Average shift length Info Average shift length. Calculated as total hours divided by days worked and average staff per day. 7.4 hours

No contractors work on this role.

Licensed Practical Nurse

Assists with medical care and medications.

LPN Staff 12
Average shift length Info Average shift length. Calculated as total hours divided by days worked and average staff per day. 7.9 hours

No contractors work on this role.

Certified Nursing Assistant

Helps with daily care and mobility.

CNA Staff 47
Average shift length Info Average shift length. Calculated as total hours divided by days worked and average staff per day. 7.6 hours

No contractors work on this role.

Contractor staffing

Q4 2025 · Oct 1 – Dec 31 More info This data comes from the CMS Payroll-Based Journal report covering October 1 – December 31, 2025.

Total hours from contractors

6%

2,496 contractor hours this quarter

Qualified Social Worker: 6 Physical Therapy Assistant: 5 Speech Language Pathologist: 3 Respiratory Therapy Technician: 3 Physical Therapy Aide: 2

Staff by category

Q4 2025 · Oct 1 – Dec 31 More info This data comes from the CMS Payroll-Based Journal report covering October 1 – December 31, 2025.
Certified Nursing Assistant4704719,36892100%7.6
Licensed Practical Nurse120125,17992100%7.9
Nurse Aide in Training190194,73992100%7.5
Medication Aide/Technician7074,63292100%10.9
Registered Nurse8081,88592100%7.4
RN Director of Nursing4041,3767885%7.9
Qualified Social Worker0667776773%5.6
Clinical Nurse Specialist4047636672%7.7
Physical Therapy Assistant0557386773%7
Speech Language Pathologist0335676470%6.8
Nurse Practitioner1014886166%8
Mental Health Service Worker1014725964%8
Dietitian1014255863%7.3
Respiratory Therapy Technician0333555762%6.2
Administrator101961213%8
Physical Therapy Aide022592123%2.8
Occupational Therapy Aide101822%4
47 Certified Nursing Assistant
% of Days 100%
12 Licensed Practical Nurse
% of Days 100%
19 Nurse Aide in Training
% of Days 100%
7 Medication Aide/Technician
% of Days 100%
8 Registered Nurse
% of Days 100%
4 RN Director of Nursing
% of Days 85%
6 Qualified Social Worker
% of Days 73%
4 Clinical Nurse Specialist
% of Days 72%
5 Physical Therapy Assistant
% of Days 73%
3 Speech Language Pathologist
% of Days 70%
1 Nurse Practitioner
% of Days 66%
1 Mental Health Service Worker
% of Days 64%
1 Dietitian
% of Days 63%
3 Respiratory Therapy Technician
% of Days 62%
1 Administrator
% of Days 13%
2 Physical Therapy Aide
% of Days 23%
1 Occupational Therapy Aide
% of Days 2%

Penalties and fines

Federal penalties imposed by CMS for regulatory violations, including civil money penalties (fines) and denials of payment for new Medicare/Medicaid admissions.

Source: CMS Penalties Database

No penalties in the past 3 years

No civil money penalties or payment denials were reported in the last 3 years.

Quality of care over time

These measures show how residents usually do over time at this home, based on health outcomes and preventive care.

High-risk clinical events score Info A composite score based on pressure ulcers, falls with injury, weight loss, walking ability decline, and activities of daily living decline. 10.1
13% worse than Alabama average

Alabama average: 8.9

Functional decline score Info A composite score based on activities of daily living decline, walking ability decline, and incontinence. 16.1
11% worse than Alabama average

Alabama average: 14.5

Long-stay resident measures
Average Alabama avg: 3.3 Info CMS star rating based on long-stay quality measure performance. 5 stars = significantly above average, 1 star = significantly below average.
Need for Help with Daily Activities Increased Info Percent of long-stay residents whose need for help with daily activities has increased 20.2%
46% worse than Alabama average

Alabama average: 13.9%

Walking Ability Worsened Info Percent of long-stay residents whose ability to move independently worsened 18.9%
17% worse than Alabama average

Alabama average: 16.1%

Low Risk Residents with Bowel/Bladder Incontinence Info Percent of low risk long-stay residents who lose control of their bowels or bladder 9.2%
32% better than Alabama average

Alabama average: 13.6%

Falls with Major Injury Info Percent of long-stay residents experiencing one or more falls with major injury 2.1%
37% better than Alabama average

Alabama average: 3.4%

High Risk Residents with Pressure Ulcers Info Percent of long-stay high risk residents with pressure ulcers 4.5%
25% better than Alabama average

Alabama average: 5.9%

Urinary Tract Infection Info Percent of long-stay residents with a urinary tract infection 0.5%
82% better than Alabama average

Alabama average: 2.7%

Lost Too Much Weight Info Percent of long-stay residents who lose too much weight 4.6%
15% better than Alabama average

Alabama average: 5.4%

Depressive Symptoms Info Percent of long-stay residents who have depressive symptoms 0.0%
100% better than Alabama average

Alabama average: 1.2%

Antipsychotic Use Info Percent of long-stay residents who received an antipsychotic medication 34.0%
65% worse than Alabama average

Alabama average: 20.7%

Pneumococcal Vaccine Info Percent of long-stay residents assessed and appropriately given the pneumococcal vaccine 49.3%
46% worse than Alabama average

Alabama average: 91.5%

Influenza Vaccine Info Percent of long-stay residents assessed and appropriately given the seasonal influenza vaccine 95.4%
In line with Alabama average

Alabama average: 94.8%

Hospitalizations per 1,000 days Info Number of hospitalizations per 1,000 long-stay resident days. 1.67
17% better than Alabama average

Alabama average: 2.00

ED visits per 1,000 days Info Number of outpatient emergency department visits per 1,000 long-stay resident days. 2.30
28% worse than Alabama average

Alabama average: 1.79

Short-stay resident measures
Pneumococcal Vaccine Info Percent of short-stay residents assessed and appropriately given the pneumococcal vaccine 36.9%
56% worse than Alabama average

Alabama average: 83.7%

Antipsychotic medication increase Info Percent of short-stay residents who newly received an antipsychotic medication 0.0%
100% better than Alabama average

Alabama average: 2.1%

Influenza Vaccine Info Percent of short-stay residents assessed and appropriately given the seasonal influenza vaccine 76.0%
5% worse than Alabama average

Alabama average: 80.3%

Breakdown by payment type

Medicare

14% of new residents, usually for short-term rehab.

Typical stay 28 days

Private pay

35% of new residents, often for short stays.

Typical stay 2 - 3 months

Medicaid

52% of new residents, often for long-term daily care.

Typical stay 1 - 2 years

Facility Characteristics

Source: CMS Long-Term Care Facility Characteristics (Data as of Jan 2026)

Total residents 109
Medicare
3
2.8% of residents
Medicaid
97
89% of residents
Private pay or other
9
8.3% of residents
Programs & Services
Residents Group

Residents meet regularly to discuss policies, care quality, and activities

Nurse Aide Training

State-approved Nurse Aide Training and Competency Evaluation Program on-site

Active Resident Council

Organized group of residents that meets regularly to discuss facility policies, quality of life, and activities.

Finances and operations

Privately-owned community
Operated by a business corporation.
Home revenue
$11.6M
Profit
$689.6K
Privately-owned community Operated by a business corporation.
Home revenue
$11.6M Rank #56 / 129Revenue — State benchmarkedThis home is ranked 56th out of 129 homes in Alabama. Shows this facility's annual revenue compared to the Alabama SNF average. Higher revenue generally means more resources for staffing and capital — read alongside Payroll %.Click the rank badge to see the full State ranking.Click here to see the full State ranking.
Profit
$689.6K
Payroll costs Info The portion of the home's budget spent on staff, including nurses, caregivers, and other employees who support care and operations. Rank #55 / 129Payroll — State benchmarkedThis home is ranked 55th out of 129 homes in Alabama. Shows total annual staff payroll benchmarked to the Alabama average. Higher payroll investment relative to peers often signals better staffing and less reliance on cheaper contract labor.Click the rank badge to see the full State ranking.Click here to see the full State ranking.
$5.5M
47.5% of revenue Rank #80 / 127Payroll % — State benchmarkedThis home is ranked 80th out of 127 homes in Alabama. Shows payroll as a percentage of revenue versus the Alabama average. Well-run Alabama SNFs typically land around 54–69% — the top third Statewide. Below 25% may signal understaffing or heavy agency use — read with Staffing ratings.Click the rank badge to see the full State ranking.Click here to see the full State ranking.
Other operating costs Info All remaining costs needed to run the home, such as food, utilities, building maintenance, supplies and administrative expenses.
$5.4M
Total costs $10.9M

Who this home usually serves

TYPE OF STAY

Mostly long-term care residents

Most residents stay for extended periods and receive ongoing daily care.

Places of interest near Northway Health and Rehabilitation, LLC

Address 1.1 miles from city center Info Estimated distance in miles from Birmingham's city center to Northway Health and Rehabilitation, LLC's address, calculated via Google Maps. — 1.93 miles to nearest hospital (University Alabama Hospital Emr)

Calculate Travel Distance to Northway Health and Rehabilitation, LLC

Add your location

Address

Financial Assistance for
Nursing Home in Alabama

Northway Health and Rehabilitation, LLC is located in Birmingham, Alabama.
Here are the financial assistance programs available to residents in Alabama.

Get Financial aid guidance

Elderly and Disabled Waiver

Alabama Medicaid E&D Waiver

Age 65+ or disabled
General Alabama resident, Medicaid-eligible, requires nursing home-level care but can live in community with support.
Income Limits (2025) ~$2,829/month 300% FBR, individual
Asset Limits $2,000 (individual), $3,000 (couple) (excludes home, car).
AL

Must be assessed by a nurse for nursing home-level care need.

Benefits
In-home personal care (4-6 hours/day, e.g., bathing, dressing) Respite care (up to 240 hours/year) Adult day care (~$50/day avg.) Home-delivered meals Case management

Alabama Respite for Caregivers Program

Alabama Respite (via NFCSP)

Age Caregiver of someone 60+ (or with dementia)
General Alabama resident.
Income Limits No strict limit; prioritizes low-income.
Asset Limits Not applicable.
AL

Focus on rural caregivers; limited funding.

Benefits
In-home respite (4-6 hours/day) Adult day care (~$50/day) Short-term facility care (up to 5 days)

SenioRx Prescription Assistance Program

AL SenioRx

Age 55+
General Alabama resident, chronic illness requiring daily medication, not fully covered by other drug plans.
Income Limits ~$3,000/month individual, varies by AAA
Asset Limits Not strictly enforced; income-focused.
AL

High ROI; saved $43.5M for 6,825 participants in FY 2022.

Benefits
Prescription cost reduction (avg. $6,300/year savings per participant) Medication management support

Weatherization Assistance Program (WAP)

AL WAP

Age 60+ priority
General Alabama resident, own or rent home, low-income status.
Income Limits (2025) ~$2,510/month 200% of poverty level, individual
Asset Limits Not applicable; income-driven.
AL

Prioritizes seniors and disabled; limited annual funding.

Benefits
Insulation Weather stripping HVAC repairs (avg. $500-$1,000 in annual energy savings)

Section 202 Supportive Housing for the Elderly

AL Section 202

Age 62+
General Alabama resident, very low income, able to live independently with support.
Income Limits (2025) ~$1,500/month 50% of area median income, individual, varies by county
Asset Limits $10,000 individual, excludes home if owned
AL

High demand in urban areas like Birmingham; limited units statewide.

Benefits
Subsidized rent (30% of income, e.g., $300-$500/month) On-site services (housekeeping, transportation, ~$200/month value)

Alabama CARES Program

AL CARES

Age
General Caregivers of Alabama residents aged 60+ needing assistance with 3+ daily activities; no age limit for caregivers.
Income Limits No strict limit; cost-sharing based on recipient’s income e.g., ~$2,500/month threshold
Asset Limits Not applicable; focus on need.
AL

Prioritizes caregivers with greatest economic/social need; complements respite programs like AL Lifespan Respite.

Benefits
Respite care (up to 10 days/year) Counseling (4-6 sessions/year) Training (2-3 workshops/year) Supplemental supplies (e.g., $200/year avg.)

Compare Nursing Home around Birmingham

The information below is reported by the Alabama Department of Public Health, Bureau of Health Provider Standards.

5 facilities compared · CMS & AL Dept. of Health data

Filter by care type
Columbiana Health and Rehabilitation, LLC
NH

Nursing Home Licensed facility providing 24/7 skilled nursing care for residents with complex, ongoing medical needs. Staffed by RNs, LPNs, and CNAs. Inspected and star-rated annually by CMS. Accepts Medicare (short-term rehab) and Medicaid (long-term care).

AL

Assisted Living A licensed, long-term care setting for seniors or individuals with disabilities who need help with daily activities — like bathing, dressing, and medication management — but not 24-hour skilled nursing. Offers housing, meals, and around-the-clock support while aiming to maximize resident independence.

Columbiana63 95.2% +18%4.33 -24%-1%$8.0k41.3160 1 Columbiana Health Realty, LLC$6.3M$3.3M51.3%15453
Greenbriar at the Altamont
NH

Nursing Home Licensed facility providing 24/7 skilled nursing care for residents with complex, ongoing medical needs. Staffed by RNs, LPNs, and CNAs. Inspected and star-rated annually by CMS. Accepts Medicare (short-term rehab) and Medicaid (long-term care).

AL

Assisted Living A licensed, long-term care setting for seniors or individuals with disabilities who need help with daily activities — like bathing, dressing, and medication management — but not 24-hour skilled nursing. Offers housing, meals, and around-the-clock support while aiming to maximize resident independence.

Birmingham (Highland Park)46 169.6% +110%4.03 -16%-8%$062.0-88 71 Jennifer Shunnara$12.2M$5.6M45.7%15446
Eastview Rehabilitation & Healthcare Center
NH

Nursing Home Licensed facility providing 24/7 skilled nursing care for residents with complex, ongoing medical needs. Staffed by RNs, LPNs, and CNAs. Inspected and star-rated annually by CMS. Accepts Medicare (short-term rehab) and Medicaid (long-term care).

Birmingham (South Eastlake)90 68.9% -15%4.39 -8%+1%$082.0-62 58 Clarence Ball$8.7M$5.1M59.2%15014
Northway Health and Rehabilitation, LLC
NH

Nursing Home Licensed facility providing 24/7 skilled nursing care for residents with complex, ongoing medical needs. Staffed by RNs, LPNs, and CNAs. Inspected and star-rated annually by CMS. Accepts Medicare (short-term rehab) and Medicaid (long-term care).

Birmingham (Druid Hills)113 5.3% -93%5.22 -37%+19%$0113.7-6 44 Letchernique Holmes$11.6M$5.5M47.5%15047
Birmingham Nursing and Rehabilitation Center East
NH

Nursing Home Licensed facility providing 24/7 skilled nursing care for residents with complex, ongoing medical needs. Staffed by RNs, LPNs, and CNAs. Inspected and star-rated annually by CMS. Accepts Medicare (short-term rehab) and Medicaid (long-term care).

Birmingham132 80.0% -1%2.89 -51%-34%$24.8k144.75116 12 Melody Burch$9.6M$5.3M54.8%15134

Frequently Asked Questions about Northway Health and Rehabilitation, LLC

What neighborhood is Northway Health and Rehabilitation, LLC in?

Northway Health and Rehabilitation, LLC is in the Druid Hills neighborhood of Birmingham.

Is Northway Health and Rehabilitation, LLC in a walkable area?

Northway Health and Rehabilitation, LLC has a walk score of 44. Somewhat walkable. A few nearby services may be reachable on foot, but most trips require transportation.

Who is the administrator of Northway Health and Rehabilitation, LLC?

Derek Patterson (Interim) is the administrator of Northway Health and Rehabilitation, LLC.

How many beds does Northway Health and Rehabilitation, LLC have?

Northway Health and Rehabilitation, LLC has 113 beds.

What is the phone number of Northway Health and Rehabilitation, LLC?

(205) 328-5870 will put you in contact with the team at Northway Health and Rehabilitation, LLC.

What county is Northway Health and Rehabilitation, LLC located in?

Northway Health and Rehabilitation, LLC is in Jefferson County.

Is Northway Health and Rehabilitation, LLC Medicare or Medicaid certified?

Yes — Northway Health and Rehabilitation, LLC is a CMS-certified provider of Medicare and Medicaid.

Guides for Better Senior Living

Care Cost Calculator: See Prices in Your Area

Nursing Home Data Explorer

Don’t Wait Too Long: 7 Red Flag Signs Your Parent Needs Assisted Living Now

The True Cost of Assisted Living in 2025 – And How Families Are Paying For It

Understanding Senior Living Costs: Pricing Models, Discounts & Financial Assistance

Explore Open Rooms
1 Contact details
2 What type of senior care service are you looking for?
3 What budget do you have in mind for senior care?
4 How soon do you need to find care?
5 Additional details

Thank you for your interest!

Our team will be in touch shortly to help with next steps.