Greenwood Center
CMS overall rating Info CMS (the Centers for Medicare & Medicaid Services) is the federal agency that rates nursing home quality. Its Overall Rating runs from 1 to 5 stars, combining health inspections, staffing, and quality measures, with inspections weighted most heavily.

Greenwood Center

CMS overall rating Info CMS (the Centers for Medicare & Medicaid Services) is the federal agency that rates nursing home quality. Its Overall Rating runs from 1 to 5 stars, combining health inspections, staffing, and quality measures, with inspections weighted most heavily.
Calculator: See prices in your area
Greenwood Center accepts Medicare, Medicaid, and private pay.

Overview of Greenwood Center

Welcome to Greenwood Care and Rehabilitation Center, an assisted living community located in Warwick, Rhode Island. This care facility specializes in offering Nursing Home services to residents in need of skilled nursing and short-term rehabilitation therapy. With a capacity to accommodate up to 123 residents and patients, Greenwood Care and Rehabilitation Center takes a personalized approach to meet the unique needs of each individual. The experienced staff ensures compassionate care and a comfortable living environment for all residents.
Since 1964, Greenwood Care and Rehabilitation Center has been serving the community of Kent County, establishing itself as a trusted provider of comprehensive care. The center accepts Medicare and Medicaid, furthering its dedication to accessible healthcare services. Experience the warmth and professionalism of Greenwood Care and Rehabilitation Center, where residents’ well-being and satisfaction are paramount. 

(610) 444-6350

Quality ratings

Measured by Centers for Medicare & Medicaid Services (CMS)

Overall rating Info The Overall CMS Rating combines results from health inspections, staffing levels and quality measures. Health inspections carry the most weight. Staffing and quality scores can increase or decrease the final rating based on performance compared to state and national standards.
▼ 31.0% Below RI avg. ▼ 31.0% Below RI avg.Click the badge to see the full State ranking.Click here to see the full State ranking.
Health Inspection Info Based on the results of the facility's three most recent standard inspections and any complaint investigations. CMS reviews the number, scope, and severity of deficiencies, with more recent findings weighted more heavily.
▼ 25.1% Below RI avg. ▼ 25.1% Below RI avg.Click the badge to see the full State ranking.Click here to see the full State ranking.
Staffing Info Measures average nursing staff hours per resident per day, including Registered Nurses (RNs) and total nursing staff. Ratings are adjusted based on the level of care residents require and are compared to state and national benchmarks.
▲ 9.6% Above RI avg. ▲ 9.6% Above RI avg.Click the badge to see the full State ranking.Click here to see the full State ranking.
Quality Measures Info Based on clinical and physical health indicators reported to CMS, such as hospital readmissions, falls, pressure ulcers, and improvements in mobility. These measures reflect how well residents' health needs are being managed.
▲ 28.2% Above RI avg. ▲ 28.2% Above RI avg.Click the badge to see the full State ranking.Click here to see the full State ranking.

Staffing hours breakdown

Info Daily nursing hours per resident by staff type, reported to CMS. Higher is generally better — compare this facility to state and national averages to see where staffing stands.

Hours per resident per day — compared to Rhode Island state averages

Total nursing care / resident Info This home is ranked 48th out of 56 homes in Rhode Island for nurse hours. Total adjusted nursing hours per resident per day, combining RN, LPN, and aide time. CMS adjusts this for case-mix so facilities can be fairly compared.
3h 16m per day
Rank #48 / 56Nurse hours — State benchmarkedThis home is ranked 48th out of 56 homes in Rhode Island. Shows adjusted nurse hours per resident per day benchmarked to the Rhode Island average, with a ranking across 56 Rhode Island facilities. More hours mean more direct care. The national average is about 3.5 hrs; below 3.0 is a red flag.Click the rank badge to see the full State ranking.Click here to see the full State ranking.
This facility Rhode Island avg (4h 6m per day)
vs Rhode Island avg
-20%

2 of 6 metrics below state avg

Standout metric LPN / LVN is +38% above state avg
Staff typeHours / Day / Residentvs state avg
Registered Nurse (RN) Info RNs hold the highest nursing license and can assess residents, interpret test results, and direct care plans. More RN hours per day often signals stronger clinical oversight and faster response to health changes. 55m per day ▲ 19% State avg: 46m per day · National avg: 41m per day
LPN / LVN Info Licensed Practical Nurses (LPNs) or Licensed Vocational Nurses (LVNs) deliver routine hands-on care — medication administration, wound dressing, and monitoring vital signs. They work under RN supervision and make up a large share of daily bedside care. 40m per day ▲ 38% State avg: 29m per day · National avg: 52m per day
Nurse Aide Info Certified Nurse Aides (CNAs) provide the most direct day-to-day assistance: bathing, dressing, feeding, and mobility. Nurse aide hours are typically the largest staffing category and directly affect residents' quality of life. 2h 4m per day ▼ 16% State avg: 2h 28m per day · National avg: 2h 21m per day
Weekend Total Nursing Info Combined nursing hours (RN + LPN + Nurse Aide) per resident per day on weekends. Staffing often drops on weekends — this figure reveals whether the facility maintains adequate coverage outside of weekday hours. 3h 17m per day ■ Avg State avg: 3h 18m per day · National avg: 3h 26m per day
Physical Therapist Info Hours per resident per day provided by licensed Physical Therapists (PTs) or PT Assistants. PT services help residents recover mobility after injury or illness and are especially important for post-acute (short-stay) rehabilitation. 1m per day ▼ 65% State avg: 3m per day · National avg: 4m per day
Weekend RN Info Registered nurse hours specifically on weekends. Facilities sometimes reduce RN presence on Saturdays and Sundays — a low weekend RN figure compared to weekday hours can indicate reduced clinical oversight when most administrative staff are absent. 44m per day ▲ 28% State avg: 34m per day · National avg: 29m per day

Capacity and availability

Avg. Length of Stay
82 days
Bed community size
130-bed community Rank #32 / 109Bed count — State benchmarkedThis home is ranked 32nd out of 109 homes in Rhode Island. Shows this facility's certified or reported bed count compared to other Rhode Island facilities. Larger communities may offer more amenities, programs, and on-site services for residents and families.Click the rank badge to see the full State ranking.Click here to see the full State ranking.
A larger shared setting that may offer more common spaces and organized community services.
Years in operation
11 years in operation Rank #47 / 89Years in operation — State benchmarkedThis home is ranked 47th out of 89 homes in Rhode Island. Shows how long this facility has been in operation compared to other Rhode Island facilities. Longer operating histories may benefit residents, families, and staff.Click the rank badge to see the full State ranking.Click here to see the full State ranking.
A community with a solid operating history and experience delivering ongoing care.
Walk Score
Walk Score: 58 / 100 Rank #47 / 118Walk Score — State benchmarkedThis home is ranked 47th out of 118 homes in Rhode Island. Shows how walkable this facility's neighborhood is compared to the average Walk Score across Rhode Island facilities. Higher scores benefit residents, families, and staff.Click the rank badge to see the full State ranking.Click here to see the full State ranking.
Moderately walkable. Some errands can be accomplished on foot, with a mix of nearby amenities.

About this community

License Details

Facility TypeNursing Facility
StatusActive
IssuanceFebruary 2, 2015
ExpirationDecember 31, 2026
License NumberLTC00793

Ownership & Operating Entity

Greenwood Center is legally operated by Michael Lopes, Administrator.

Type Of Units

Nursing Home
130 units
Total beds
130 units

Contact Information

Fax(401) 738-0310

Amenities & Lifestyle

Specific ProgramsYour Stay, Happenings, Business Partners

Contact Greenwood Center

Inspection History

In Rhode Island, the Department of Health, Center for Health Facilities Regulation is the primary authority for inspecting, licensing, and reporting on all long-term care facilities.

Since 2023 · 3 years of data 49 deficiencies

Inspection Scorecard Info This scorecard compares key inspection, citation, and complaint metrics at this facility against the Rhode Island state average. Metrics rated ≥15% worse than average are highlighted in red; those ≥15% better are highlighted in green.

Since 2023 vs. Rhode Island state average
Overall vs. RI average 2 Worse Metrics worse than Rhode Island average:
• Total deficiencies (44% above)
• Deficiencies per year (44% above)
0 Better No metrics in this bucket.
Latest Inspection December 12, 2025 Complaint Investigation

Deficiencies Info Deficiencies are formal regulatory issues recorded during state inspections.

This FacilityRI Averagevs. RI Avg
Total deficiencies Info Formal regulatory issues recorded by inspectors across all inspection types. 4934 This facility has 44% more total deficiencies than a typical Rhode Island nursing home (49 vs. RI avg 34).↑ 44% worse
Deficiencies per year Info Average deficiencies per year since 2023. 16.311.3 This facility has 44% more deficiencies per year than a typical Rhode Island nursing home (16.3 vs. RI avg 11.3).↑ 44% worse

Inspection Reports Summary Info An editor-reviewed summary of the themes and findings across this facility's recent inspection reports.

  • December 12, 2025 inspection substantiated failure to administer 17 doses of prescribed insulin, causing resident clinical decline and hospital transfer.
  • September 11, 2025 investigation found substantiated physical and verbal abuse by intoxicated CNA, with failure to remove staff immediately.
  • March 6, 2025 routine survey cited 11 deficiencies including medication errors, infection control breaches, food safety violations, and unsafe environment maintenance.

Health Inspection History

Inspections since 2023
Total health inspections 9

Rhode Island average 8.3


Last Health inspection on Sep 2025
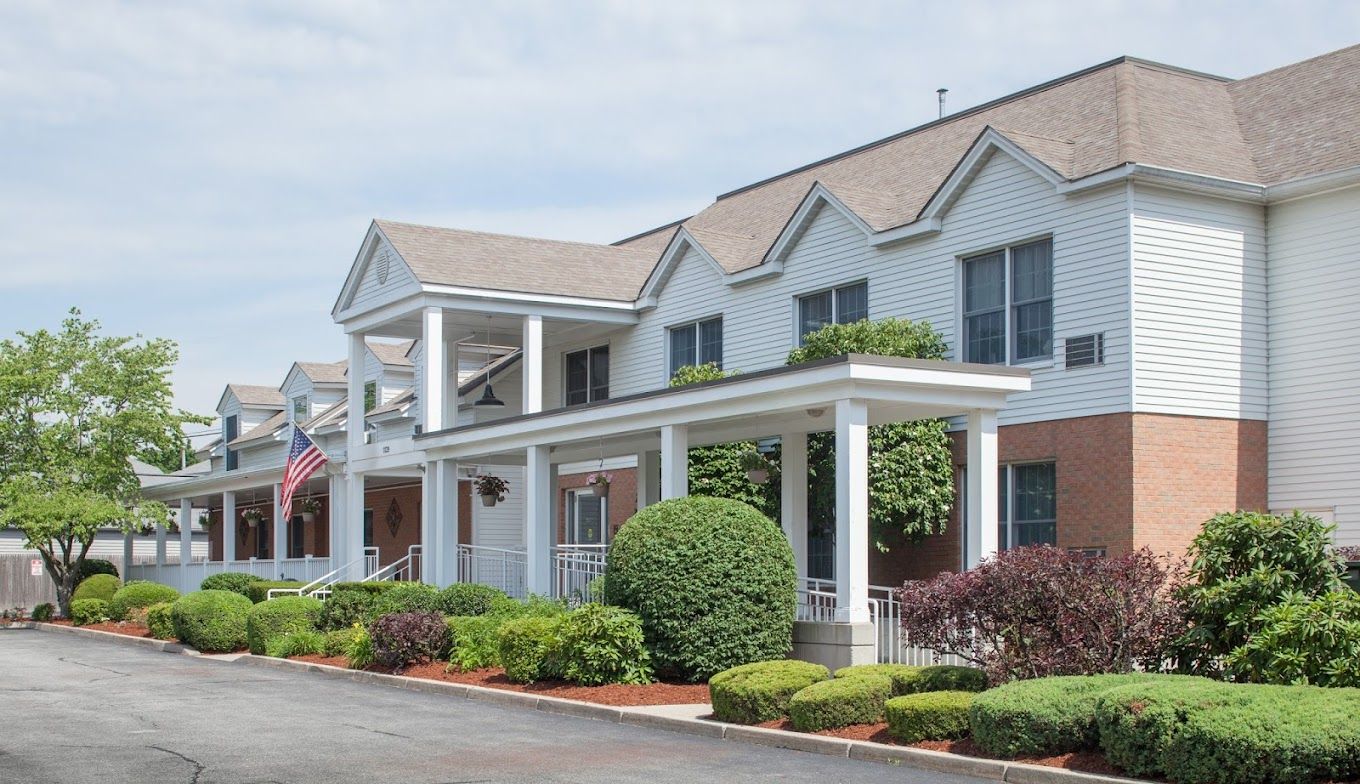
Total health citations
36 Rank #45 / 58Health citations — State benchmarkedThis home is ranked 45th out of 58 homes in Rhode Island. Shows this facility's total health deficiency citations benchmarked to the Rhode Island State average, with a ranking across all 58 RI facilities. Lower citation counts earn a better rank.Click the rank badge to see the full State ranking.Click here to see the full State ranking.

Rhode Island average 28.1

Citations per inspection
4 Rank #37 / 58Citations per inspection — State benchmarkedThis home is ranked 37th out of 58 homes in Rhode Island. Shows average deficiency citations per CMS inspection for this facility versus the Rhode Island mean across 58 facilities with citation data. Lower is better.Click the rank badge to see the full State ranking.Click here to see the full State ranking.

Rhode Island average 3.48


Health citations are formal notices following inspections when they fail to comply with safety and care standards.

17 of 36 citations resulted from standard inspections; 8 of 36 resulted from complaint investigations; and 11 of 36 came from combined inspections (standard and complaint).

Breakdown of citation severity (last 3 years)
Critical health citations
1
38% better than Rhode Island average

Rhode Island average: 1.6


Serious health citations
2
18% worse than Rhode Island average

Rhode Island average: 1.7

1 critical citation Rhode Island average: 1.6

2 serious citations Rhode Island average: 1.7

33 moderate citations Rhode Island average: 24.3

0 minor citations Rhode Island average: 0.5
Citations history (last 3 years)
Abuse/Neglect moderate citation Sep 11, 2025
Corrected

Abuse/Neglect moderate citation Sep 11, 2025
Corrected

Care Planning moderate citation Sep 04, 2025
Corrected

Care Planning moderate citation Sep 04, 2025
Corrected

Staffing Data

Reporting period: October 1 – December 31, 2025 (Q4 2025). Source: CMS Payroll-Based Journal report.

Total staff 207
Employees 112
Contractors 95
Staff to resident ratio 1.90 : 1
0% compared with Rhode Island average
Rhode Island average ratio: 1.85 : 1 Rhode Island average ratio: 1.85 : 1See full Rhode Island ranking
Avg staff/day 54
Average shift 7.9 hours
0% compared with Rhode Island average
Rhode Island average: 7.6 hours Rhode Island average shift: 7.6 hoursSee full Rhode Island ranking
Total staff hours (quarter) 39,106

Nursing staff breakdown

Q4 2025 · Oct 1 – Dec 31 More info This data comes from the CMS Payroll-Based Journal report covering October 1 – December 31, 2025.
Registered Nurse

Manages medical care and health needs.

RN Staff Info 32 total: 21 full-time employees and 11 contractors. 32
Average shift length Info Average shift length. Calculated as total hours divided by days worked and average staff per day. 8.5 hours
Licensed Practical Nurse

Assists with medical care and medications.

LPN Staff Info 40 total: 17 full-time employees and 23 contractors. 40
Average shift length Info Average shift length. Calculated as total hours divided by days worked and average staff per day. 7.7 hours
Certified Nursing Assistant

Helps with daily care and mobility.

CNA Staff Info 107 total: 46 full-time employees and 61 contractors. 107
Average shift length Info Average shift length. Calculated as total hours divided by days worked and average staff per day. 7.9 hours

Contractor staffing

Q4 2025 · Oct 1 – Dec 31 More info This data comes from the CMS Payroll-Based Journal report covering October 1 – December 31, 2025.

Total hours from contractors

10%

3,914 contractor hours this quarter

Certified Nursing Assistant: 61 Licensed Practical Nurse: 23 Registered Nurse: 11

Staff by category

Q4 2025 · Oct 1 – Dec 31 More info This data comes from the CMS Payroll-Based Journal report covering October 1 – December 31, 2025.
Certified Nursing Assistant466110719,27292100%7.9
Registered Nurse2111327,67092100%8.5
Licensed Practical Nurse1723406,00892100%7.7
Other Dietary Services Staff3039388997%7.4
Medication Aide/Technician5059286874%7.7
Mental Health Service Worker3037656571%6.3
Clinical Nurse Specialist2027656368%8
RN Director of Nursing1015326166%8.7
Administrator1014886166%8
Nurse Practitioner1014886166%8
Other Social Services Staff1013444549%7.6
Speech Language Pathologist2021742325%5.4
Respiratory Therapy Technician2021741820%7.2
Qualified Social Worker2021432224%6.5
Physical Therapy Assistant2021361921%7.1
Respiratory Therapist1011291617%8.1
Dental Services Staff1011051516%7
Dietitian1014867%8
107 Certified Nursing Assistant
% of Days 100%
32 Registered Nurse
% of Days 100%
40 Licensed Practical Nurse
% of Days 100%
3 Other Dietary Services Staff
% of Days 97%
5 Medication Aide/Technician
% of Days 74%
3 Mental Health Service Worker
% of Days 71%
2 Clinical Nurse Specialist
% of Days 68%
1 RN Director of Nursing
% of Days 66%
1 Administrator
% of Days 66%
1 Nurse Practitioner
% of Days 66%
1 Other Social Services Staff
% of Days 49%
2 Speech Language Pathologist
% of Days 25%
2 Respiratory Therapy Technician
% of Days 20%
2 Qualified Social Worker
% of Days 24%
2 Physical Therapy Assistant
% of Days 21%
1 Respiratory Therapist
% of Days 17%
1 Dental Services Staff
% of Days 16%
1 Dietitian
% of Days 7%

Penalties and fines

Includes penalties issued in 2023-2024

Federal penalties imposed by CMS for regulatory violations, including civil money penalties (fines) and denials of payment for new Medicare/Medicaid admissions.

Source: CMS Penalties Database (Data as of Jan 2026)

Total fines amount $41K Rank #29 / 58Federal fines — State benchmarkedThis home is ranked 29th out of 58 homes in Rhode Island. Shows this facility's cumulative CMS federal fine dollars versus the Rhode Island average among facilities with fines, and where it ranks among 58 facilities in the pool. Lower total dollars mean a better rank.Click the rank badge to see the full State ranking.Click here to see the full State ranking.
57% lower than Rhode Island average

Rhode Island average: $94K

Number of fines 3
6% more fines than Rhode Island average

Rhode Island average: 2.8

Payment Denials Info Serious action where Medicare and/or Medicaid temporarily stops payments for new residents until issues are fixed. 0
100% fewer payment denials than Rhode Island average

Rhode Island average: 0.4

Fines amount comparison
This facility $41K
Rhode Island average $94K
Penalty History

Penalties are imposed by CMS for violations of federal nursing home regulations.

2 penalties in the past 3 years

Multiple penalties were reported in the last 3 years.

Civil Money Penalty Info Fines imposed for noncompliance, which can be assessed per day or per instance of violation. Mar 22, 2024
$25K
Civil Money Penalty Info Fines imposed for noncompliance, which can be assessed per day or per instance of violation. Nov 21, 2023
$8K

Last updated: Jan 2026

Quality of care over time

These measures show how residents usually do over time at this home, based on health outcomes and preventive care.

High-risk clinical events score Info A composite score based on pressure ulcers, falls with injury, weight loss, walking ability decline, and activities of daily living decline. 10.1
In line with Rhode Island average

Rhode Island average: 10.3

Functional decline score Info A composite score based on activities of daily living decline, walking ability decline, and incontinence. 20.7
In line with Rhode Island average

Rhode Island average: 20.2

Long-stay resident measures
Average Rhode Island avg: 3.2 Info CMS star rating based on long-stay quality measure performance. 5 stars = significantly above average, 1 star = significantly below average.
Need for Help with Daily Activities Increased Info Percent of long-stay residents whose need for help with daily activities has increased 15.2%
22% better than Rhode Island average

Rhode Island average: 19.5%

Walking Ability Worsened Info Percent of long-stay residents whose ability to move independently worsened 18.0%
In line with Rhode Island average

Rhode Island average: 18.2%

Low Risk Residents with Bowel/Bladder Incontinence Info Percent of low risk long-stay residents who lose control of their bowels or bladder 28.8%
26% worse than Rhode Island average

Rhode Island average: 22.9%

Falls with Major Injury Info Percent of long-stay residents experiencing one or more falls with major injury 3.0%
18% better than Rhode Island average

Rhode Island average: 3.7%

High Risk Residents with Pressure Ulcers Info Percent of long-stay high risk residents with pressure ulcers 8.5%
79% worse than Rhode Island average

Rhode Island average: 4.7%

Urinary Tract Infection Info Percent of long-stay residents with a urinary tract infection 1.7%
27% better than Rhode Island average

Rhode Island average: 2.3%

Lost Too Much Weight Info Percent of long-stay residents who lose too much weight 5.6%
5% worse than Rhode Island average

Rhode Island average: 5.4%

Depressive Symptoms Info Percent of long-stay residents who have depressive symptoms 34.0%
153% worse than Rhode Island average

Rhode Island average: 13.5%

Antipsychotic Use Info Percent of long-stay residents who received an antipsychotic medication 15.4%
28% better than Rhode Island average

Rhode Island average: 21.5%

Pneumococcal Vaccine Info Percent of long-stay residents assessed and appropriately given the pneumococcal vaccine 100.0%
7% better than Rhode Island average

Rhode Island average: 93.1%

Influenza Vaccine Info Percent of long-stay residents assessed and appropriately given the seasonal influenza vaccine 100.0%
5% better than Rhode Island average

Rhode Island average: 95.3%

Short-stay resident measures
Average Rhode Island avg: 2.4 Info CMS star rating based on short-stay quality measure performance. 5 stars = much above average, 1 star = much below average.
Pneumococcal Vaccine Info Percent of short-stay residents assessed and appropriately given the pneumococcal vaccine 95.3%
25% better than Rhode Island average

Rhode Island average: 76.2%

Antipsychotic medication increase Info Percent of short-stay residents who newly received an antipsychotic medication 2.5%
21% worse than Rhode Island average

Rhode Island average: 2.0%

Influenza Vaccine Info Percent of short-stay residents assessed and appropriately given the seasonal influenza vaccine 69.7%
11% worse than Rhode Island average

Rhode Island average: 78.2%

Re-hospitalized after SNF stay Info Percentage of short-stay residents who were re-hospitalized after their nursing home admission. 40.5%
61% worse than Rhode Island average

Rhode Island average: 25.1%

Emergency department visits Info Percentage of short-stay residents who had an outpatient emergency department visit. 5.4%
66% better than Rhode Island average

Rhode Island average: 15.8%

Falls with major injury Info Percentage of SNF residents who experience falls with major injury during their stay. 0.0%
100% better than Rhode Island average

Rhode Island average: 0.8%

Ability to care for self at discharge Info Percentage of residents at or above expected ability to care for themselves at discharge. 58.1%
8% better than Rhode Island average

Rhode Island average: 53.7%

Successful return to home or community Info Rate of successful return to home or community from a skilled nursing facility. 53.7%
6% better than Rhode Island average

Rhode Island average: 50.6%

Breakdown by payment type

Medicare

22% of new residents, usually for short-term rehab.

Typical stay 15 days

Private pay

60% of new residents, often for short stays.

Typical stay 25 days

Medicaid

18% of new residents, often for long-term daily care.

Typical stay 11 - 12 months

Facility Characteristics

Source: CMS Long-Term Care Facility Characteristics (Data as of Jan 2026)

Total residents 109
Medicare
6
5.5% of residents
Medicaid
78
71.6% of residents
Private pay or other
25
22.9% of residents
Programs & Services
Residents Group

Residents meet regularly to discuss policies, care quality, and activities

Active Resident Council

Organized group of residents that meets regularly to discuss facility policies, quality of life, and activities.

Finances and operations

Voluntary non-profit community
Operated by a church.
Home revenue
$20.9M
Operating deficit
-$1.6M
Voluntary non-profit community Operated by a church.
Home revenue
$20.9M Rank #14 / 60Revenue — State benchmarkedThis home is ranked 14th out of 60 homes in Rhode Island. Shows this facility's annual revenue compared to the Rhode Island average. Higher revenue generally means more resources for staffing and capital — read alongside Payroll %.Click the rank badge to see the full State ranking.Click here to see the full State ranking.
Operating deficit
-$1.6M
Payroll costs Info The portion of the home's budget spent on staff, including nurses, caregivers, and other employees who support care and operations. Rank #13 / 60Payroll — State benchmarkedThis home is ranked 13th out of 60 homes in Rhode Island. Shows total annual staff payroll benchmarked to the Rhode Island average. Higher payroll investment relative to peers often signals better staffing and less reliance on cheaper contract labor.Click the rank badge to see the full State ranking.Click here to see the full State ranking.
$11.0M
52.5% of revenue Rank #42 / 60Payroll % — State benchmarkedThis home is ranked 42nd out of 60 homes in Rhode Island. Shows payroll as a percentage of revenue versus the Rhode Island average. Well-run Rhode Island facilities typically land around 60–70% — the top third Statewide. Below 25% may signal understaffing or heavy agency use — read with Staffing ratings.Click the rank badge to see the full State ranking.Click here to see the full State ranking.
Other operating costs Info All remaining costs needed to run the home, such as food, utilities, building maintenance, supplies and administrative expenses.
$11.5M
Total costs $22.5M

Who this home usually serves

TYPE OF STAY

Primarily short stays

Residents typically stay for brief periods, with frequent admissions and discharges throughout the year.

Greenwood Center Reviews

Lucien Perron
By far the best source of round the clock skilled nursing care in Rhode Island. I have been paralyzed now for I’ve 35 years and in need of excellent nursing care and Greenwood Center by far exceeds expectations and quality of care compared to the rest. Thank you Greenwood staff and administrators

Places of interest near Greenwood Center

Address 2.6 miles from city center Info Estimated distance in miles from Warwick's city center to Greenwood Center's address, calculated via Google Maps. — 4.47 miles to nearest hospital (University Neurology)

Calculate Travel Distance to Greenwood Center

Add your location

Address

Financial Assistance for
Nursing Home in Rhode Island

Greenwood Center is located in Warwick, Rhode Island.
Here are the financial assistance programs available to residents in Rhode Island.

Get Financial aid guidance

Rhode Island Home and Community Care Services

RI Medicaid HCCS

Age 65+ or disabled
General Rhode Island resident, Medicaid-eligible, nursing home-level care need.
Income Limits (2025) ~$2,829/month 300% FBR, individual
Asset Limits $4,000 individual, higher than most states
RI

Higher asset limit; small state aids quicker processing.

Benefits
Personal care (5-7 hours/day) Respite (240 hours/year) Adult day care ($65/day) Home modifications ($1,500 avg.)

Rhode Island Caregiver Support Program

RI NFCSP Respite

Age Caregiver of someone 60+ (or with dementia)
General Rhode Island resident.
Income Limits No strict limit; prioritizes low-income.
Asset Limits Not applicable.
RI

Limited slots; urban focus due to small size.

Benefits
In-home respite (4-6 hours/day) Adult day care (~$65/day) Short-term facility care (up to 5 days)

Program of All-Inclusive Care for the Elderly (PACE)

Rhode Island PACE

Age 55+
General RI resident (specific counties), NFLOC, safe with PACE support.
Income Limits (2025) ~$2,829/month (Medicaid-eligible); private pay option available.
Asset Limits $4,000 (individual), $6,000 (couple) for Medicaid enrollees.
RI

Operated by PACE Organization of Rhode Island; covers 4 counties (Providence, Kent, Washington, Newport).

Benefits
Personal care (5-7 hours/day) Medical care Meals Transportation Respite Therapies

@Home Cost Share Program

Rhode Island @Home Cost Share

Age 65+
General RI resident, need help with 1+ ADL/IADL, not Medicaid-eligible.
Income Limits (2025) ~$1,255-$2,829/month (100%-300% FPL); sliding scale fees.
Asset Limits Not strictly assessed; focus on income/need.
RI

Administered by Division of Elderly Affairs (DEA); complements Medicaid.

Benefits
Personal care (4-6 hours/week) Homemaker services Respite (~5 days/year) Transportation

SSI Enhanced Assisted Living Program

Rhode Island SSI Enhanced AL

Age 65+ (or disabled)
General RI resident, SSI-eligible, living in approved AL facility.
Income Limits (2025) $943/month (SSI federal rate) + state supplement ($332/month).
Asset Limits $2,000 (individual), $3,000 (couple).
RI

Supplement increases to ~$1,275/month total for AL residents; ~50 facilities participate.

Benefits
Financial aid (~$332/month extra) for AL costs (personal care, meals, activities)

Medicare Savings Program (MSP)

Rhode Island Medicare Savings Program

Age 65+ or disabled
General RI resident, Medicare Part A/B.
Income Limits (2025) ~$2,510/month (QMB), ~$3,380/month (SLMB), ~$3,598/month (QI)—individual.
Asset Limits $9,430 (individual), $14,130 (couple).
RI

Three tiers; includes Extra Help for Part D; no waitlist.

Benefits
Covers Part B premiums ($174.70/month) Deductibles ($240/year) Copays (~20%)

VA Aid and Attendance (A&A) and Housebound Benefits

Rhode Island VA Aid and Attendance/Housebound

Age 65+ or disabled veteran/spouse
General RI resident, wartime service, need for ADL help (A&A) or homebound.
Income Limits (2025) Net income < ~$1,984/month (veteran with dependent, A&A); pension offsets income.
Asset Limits ~$155,356 net worth limit
RI

High veteran demand; supports rural/urban care needs.

Benefits
Cash (~$1,433-$2,642/month veteran, ~$951-$1,318 spouse) for care costs (e.g., in-home, assisted living)

Senior Farmers’ Market Nutrition Program (SFMNP)

Rhode Island SFMNP

Age 60+
General RI resident, low-income.
Income Limits (2025) ~$2,322/month individual, 185% FPL
Asset Limits Not assessed.
RI

Vouchers (~$50/season); serves ~10,000 annually.

Benefits
Vouchers (~$50/season) for fresh produce at approved markets

Property Tax Relief for Seniors

Rhode Island Property Tax Relief Credit

Age 65+ (or disabled)
General RI resident, homeowner/renter, low-income.
Income Limits (2025) ~$35,000/year household
Asset Limits Not assessed; income-focused.
RI

Credit up to $400; local exemptions vary by municipality.

Benefits
Tax credit (~$100-$400/year avg., depending on income)

Compare Nursing Home around Warwick

The information below is reported by the Rhode Island Department of Health, Center for Health Facilities Regulation.

2 facilities compared · CMS & RI Dept. of Health data

Greenwood Center
NH

Nursing Home Licensed facility providing 24/7 skilled nursing care for residents with complex, ongoing medical needs. Staffed by RNs, LPNs, and CNAs. Inspected and star-rated annually by CMS. Accepts Medicare (short-term rehab) and Medicaid (long-term care).

AL

Assisted Living A licensed, long-term care setting for seniors or individuals with disabilities who need help with daily activities — like bathing, dressing, and medication management — but not 24-hour skilled nursing. Offers housing, meals, and around-the-clock support while aiming to maximize resident independence.

Warwick (Main Avenue)
130
Facility 130
RI AVG 107
Rank #32 / 109
--
3.27
Facility 3.27
RI AVG 4.01
Rank #48 / 56
+14%-19%
$148.6k
Facility $148.6k
RI AVG $97.5k
Rank #29 / 58
36
Facility 36
RI AVG 28.1
Rank #45 / 58
4.0
Facility 4.0
RI AVG 3.5
Rank #37 / 58
32
58
Facility 58
RI AVG 47
Rank #47 / 118
Harborside Health I LLC
$20.9M
Facility $20.9M
RI AVG $14.1M
Rank #14 / 60
$11.0M
Facility $11.0M
RI AVG $5.9M
Rank #13 / 60
52.5%
Facility 52.5%
RI AVG 43.7%
Rank #42 / 60
415008
Coventry Skilled Nursing And Rehabilitation
NH

Nursing Home Licensed facility providing 24/7 skilled nursing care for residents with complex, ongoing medical needs. Staffed by RNs, LPNs, and CNAs. Inspected and star-rated annually by CMS. Accepts Medicare (short-term rehab) and Medicaid (long-term care).

AL

Assisted Living A licensed, long-term care setting for seniors or individuals with disabilities who need help with daily activities — like bathing, dressing, and medication management — but not 24-hour skilled nursing. Offers housing, meals, and around-the-clock support while aiming to maximize resident independence.

Coventry
210
Facility 210
RI AVG 107
Rank #3 / 109
42.4%
Facility 42.4%
RI AVG 83.7%
Rank #59 / 63
-49%
2.90
Facility 2.90
RI AVG 4.01
Rank #54 / 56
+42%-28%
$331.2k
Facility $331.2k
RI AVG $97.5k
Rank #49 / 58
64
Facility 64
RI AVG 28.1
Rank #57 / 58
3.4
Facility 3.4
RI AVG 3.5
Rank #23 / 58
1689
29
Facility 29
RI AVG 47
Rank #81 / 118
Susan Laninfa
$25.7M
Facility $25.7M
RI AVG $14.1M
Rank #4 / 60
$14.5M
Facility $14.5M
RI AVG $5.9M
Rank #3 / 60
56.6%
Facility 56.6%
RI AVG 43.7%
Rank #27 / 60
415078

Frequently Asked Questions about Greenwood Center

What neighborhood is Greenwood Center in?

Greenwood Center is in the Main Avenue neighborhood of Warwick.

Who is the owner of Greenwood Center?

The legal owner and operator of Greenwood Center is Michael Lopes, Administrator.

Is Greenwood Center in a walkable area?

Greenwood Center has a walk score of 58. Moderately walkable. Some errands can be accomplished on foot, with a mix of nearby amenities.

What is the license number of Greenwood Center?

According to RI state health department records, Greenwood Center's license number is LTC00793.

When does Greenwood Center's license expire?

According to RI state health department records, Greenwood Center's license expires on December 31, 2026.

What is the occupancy rate at Greenwood Center?

Greenwood Center's occupancy is 82.2%.

How many beds does Greenwood Center have?

Greenwood Center has 130 beds.

Guides for Better Senior Living

Care Cost Calculator: See Prices in Your Area

Nursing Home Data Explorer

Don’t Wait Too Long: 7 Red Flag Signs Your Parent Needs Assisted Living Now

The True Cost of Assisted Living in 2025 – And How Families Are Paying For It

Understanding Senior Living Costs: Pricing Models, Discounts & Financial Assistance

Explore Open Rooms
1 Contact details
2 What type of senior care service are you looking for?
3 What budget do you have in mind for senior care?
4 How soon do you need to find care?
5 Additional details

Thank you for your interest!

Our team will be in touch shortly to help with next steps.