Hale O Meleana
Nursing Home, Assisted Living, Memory Care, Residential Care & Respite Care · Honolulu, HI
CMS overall rating Info CMS (the Centers for Medicare & Medicaid Services) is the federal agency that rates nursing home quality. Its Overall Rating runs from 1 to 5 stars, combining health inspections, staffing, and quality measures, with inspections weighted most heavily.

Hale O Meleana

Nursing Home, Assisted Living, Memory Care, Residential Care & Respite Care · Honolulu, HI
CMS overall rating Info CMS (the Centers for Medicare & Medicaid Services) is the federal agency that rates nursing home quality. Its Overall Rating runs from 1 to 5 stars, combining health inspections, staffing, and quality measures, with inspections weighted most heavily.
Calculator: See prices in your area
Hale O Meleana accepts Medicare and private pay.

Overview of Hale O Meleana

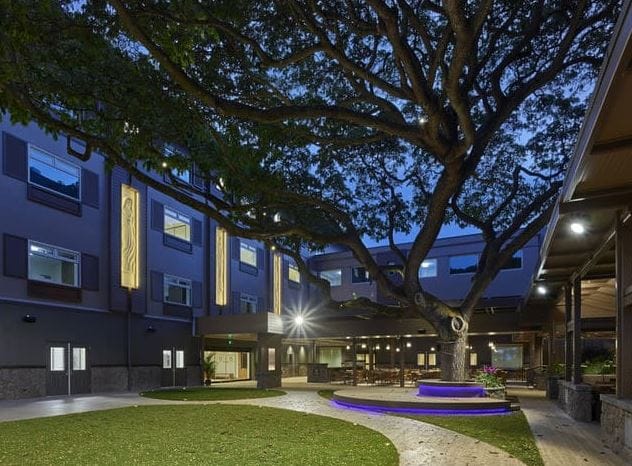
Hale O Meleana is a compassionate assisted living community in Honolulu, HI, that offers residential care, memory care, and respite care. With its island-style living, the community is dedicated to providing older adults with a familiar environment. Chef-prepared meals, fun recreational activities, and therapy services are among the community’s high-quality services that aim to keep older adults well taken care of. The community’s dedication to enhancing older adults’ living experiences is anchored to their passion for maintaining their happiness and wellness.

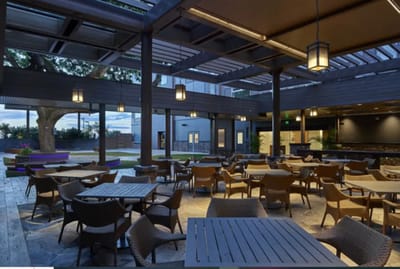
Fitness activities, social events, and various programs tailored to residents’ interests are conducted for residents’ holistic wellness. A movie room, serene walking paths, and Lanai-themed gardens are among the community’s beautiful amenities, ensuring residents have a place to lounge and spend their free time. Located near St. Francis Medical Center and public transportation, the community ensures residents have easy access to their necessities. This senior living community is a trusted choice for retirement in Hawaii, especially with its dedicated services and extensive amenities.

(808) 548-4663

Quality ratings

Measured by Centers for Medicare & Medicaid Services (CMS)

Overall rating Info The Overall CMS Rating combines results from health inspections, staffing levels and quality measures. Health inspections carry the most weight. Staffing and quality scores can increase or decrease the final rating based on performance compared to state and national standards.
▲ 16.3% Above HI avg. ▲ 16.3% Above HI avg.HI average: 3.4Click the badge to see the full State ranking.Click here to see the full State ranking.
Health Inspection Info Based on the results of the facility's three most recent standard inspections and any complaint investigations. CMS reviews the number, scope, and severity of deficiencies, with more recent findings weighted more heavily.
▲ 4.2% Above HI avg. ▲ 4.2% Above HI avg.HI average: 2.9Click the badge to see the full State ranking.Click here to see the full State ranking.
Staffing Info Measures average nursing staff hours per resident per day, including Registered Nurses (RNs) and total nursing staff. Ratings are adjusted based on the level of care residents require and are compared to state and national benchmarks.
▲ 25.0% Above HI avg. ▲ 25.0% Above HI avg.HI average: 4.0Click the badge to see the full State ranking.Click here to see the full State ranking.
Quality Measures Info Based on clinical and physical health indicators reported to CMS, such as hospital readmissions, falls, pressure ulcers, and improvements in mobility. These measures reflect how well residents' health needs are being managed.
▼ 5.2% Below HI avg. ▼ 5.2% Below HI avg.HI average: 4.2Click the badge to see the full State ranking.Click here to see the full State ranking.

Staffing hours breakdown

Info Daily nursing hours per resident by staff type, reported to CMS. Higher is generally better — compare this facility to state and national averages to see where staffing stands.

Hours per resident per day — compared to Hawaii state averages

Total nursing care / resident Info This home is ranked 6th out of 33 homes in Hawaii for nurse hours. Total adjusted nursing hours per resident per day, combining RN, LPN, and aide time. CMS adjusts this for case-mix so facilities can be fairly compared.
5h 12m per day
Rank #6 / 33Nurse hours — State benchmarkedThis home is ranked 6th out of 33 homes in Hawaii. Shows adjusted nurse hours per resident per day benchmarked to the Hawaii average, with a ranking across 33 Hawaii facilities. More hours mean more direct care. The national average is about 3.5 hrs; below 3.0 is a red flag.Rankings are based only on facilities in Hawaii that report data for that category. Facilities without available data are excluded from the ranking.Click the rank badge to see the full State ranking.Click here to see the full State ranking.
This facility Hawaii avg (4h 12m per day)
vs Hawaii avg
+24%

0 of 6 metrics below state avg

Standout metric Physical Therapist is +192% above state avg
Staff typeHours / Day / Residentvs state avg
Registered Nurse (RN) Info RNs hold the highest nursing license and can assess residents, interpret test results, and direct care plans. More RN hours per day often signals stronger clinical oversight and faster response to health changes. 2h 16m per day ▲ 38% State avg: 1h 38m per day · National avg: 41m per day
LPN / LVN Info Licensed Practical Nurses (LPNs) or Licensed Vocational Nurses (LVNs) deliver routine hands-on care — medication administration, wound dressing, and monitoring vital signs. They work under RN supervision and make up a large share of daily bedside care. 33m per day ▲ 62% State avg: 20m per day · National avg: 52m per day
Nurse Aide Info Certified Nurse Aides (CNAs) provide the most direct day-to-day assistance: bathing, dressing, feeding, and mobility. Nurse aide hours are typically the largest staffing category and directly affect residents' quality of life. 3h 2m per day ▲ 13% State avg: 2h 41m per day · National avg: 2h 20m per day
Weekend Total Nursing Info Combined nursing hours (RN + LPN + Nurse Aide) per resident per day on weekends. Staffing often drops on weekends — this figure reveals whether the facility maintains adequate coverage outside of weekday hours. 5h 23m per day ▲ 31% State avg: 4h 6m per day · National avg: 3h 27m per day
Physical Therapist Info Hours per resident per day provided by licensed Physical Therapists (PTs) or PT Assistants. PT services help residents recover mobility after injury or illness and are especially important for post-acute (short-stay) rehabilitation. 17m per day ▲ 192% State avg: 6m per day · National avg: 4m per day
Weekend RN Info Registered nurse hours specifically on weekends. Facilities sometimes reduce RN presence on Saturdays and Sundays — a low weekend RN figure compared to weekday hours can indicate reduced clinical oversight when most administrative staff are absent. 1h 39m per day ▲ 34% State avg: 1h 14m per day · National avg: 29m per day

Capacity and availability

Avg. Length of Stay
26 days
Bed community size
176-bed community Rank #4 / 87Bed count — State benchmarkedThis home is ranked 4th out of 87 homes in Hawaii. Shows this facility's certified or reported bed count compared to other Hawaii facilities. Larger communities may offer more amenities, programs, and on-site services for residents and families.Rankings are based only on facilities in Hawaii that report data for that category. Facilities without available data are excluded from the ranking.Click the rank badge to see the full State ranking.Click here to see the full State ranking.
A large-scale community that may provide a wide range of amenities, services, and structured programs.
Walk Score
Walk Score: 37 / 100 Rank #108 / 178Walk Score — State benchmarkedThis home is ranked 108th out of 178 homes in Hawaii. Shows how walkable this facility's neighborhood is compared to the average Walk Score across Hawaii facilities. Higher scores benefit residents, families, and staff.Rankings are based only on facilities in Hawaii that report data for that category. Facilities without available data are excluded from the ranking.Click the rank badge to see the full State ranking.Click here to see the full State ranking.
Somewhat walkable. A few nearby services may be reachable on foot, but most trips require transportation.

About this community

Occupancy

Occupancy rate
55%
Rank #25 / 28Occupancy rate — State benchmarkedThis home is ranked 25th out of 28 homes in Hawaii. Shows this facility's occupancy rate versus the Hawaii average, with its Statewide rank out of 28. Higher occupancy signals strong local demand and financial stability.Rankings are based only on facilities in Hawaii that report data for that category. Facilities without available data are excluded from the ranking.Click the rank badge to see the full State ranking.Click here to see the full State ranking.
Lower than the Hawaii average: 74.2%
Occupied beds
97 / 176
Average occupied beds in Hawaii homes 81 beds

License Details

Facility TypeType Ii Expanded Adult Residential Care Home
StatusActive
ExpirationNovember 30, 2026
License Number1618-C
Approved for WheelchairYes
IslandOahu

Ownership & Operating Entity

Hale O Meleana is legally operated by Kelly Davis.

Current Vacancies

InfoVacancy counts may overlap or be gender-specific depending on the community.
Male Residents
110 available
Female Residents
110 available

Care & Accommodations

Ambulatory Type: Ambulatory
Diet Type: Special

Therapy & Rehabilitation

3 services
Rehabilitation Services
Respite Care
Short-Term Rehab

Staffing & Medical

2 services
Licensed Nurses/CNAs
24-Hour Staffing

Additional Services

1 service
Hospice

Amenities & Lifestyle

Specific ProgramsHome Health, Adult Day Health, Care Management

Contact Hale O Meleana

Inspection History

In Hawaii, the Department of Health, Office of Health Care Assurance performs regular inspections and unannounced surveys to verify that healthcare facilities maintain high standards of resident care.

Since 2022 · 4 years of data 54 deficiencies

Inspection Scorecard Info This scorecard compares key inspection, citation, and complaint metrics at this facility against the Hawaii state average. Metrics rated ≥15% worse than average are highlighted in red; those ≥15% better are highlighted in green.

Since 2022 vs. Hawaii state average
Overall vs. HI average 2 Worse Metrics worse than Hawaii average:
• Total deficiencies (116% above)
• Deficiencies per year (114% above)
0 Better No metrics in this bucket.
Latest Inspection August 1, 2024 Annual Inspection

Deficiencies Info Deficiencies are formal regulatory issues recorded during state inspections.

This FacilityHI Averagevs. HI Avg
Total deficiencies Info Formal regulatory issues recorded by inspectors across all inspection types. 5425 This facility has 116% more total deficiencies than a typical Hawaii assisted living residence (54 vs. HI avg 25).↑ 116% worse
Deficiencies per year Info Average deficiencies per year since 2022. 13.56.3 This facility has 114% more deficiencies per year than a typical Hawaii assisted living residence (13.5 vs. HI avg 6.3).↑ 114% worse

Inspection Reports Summary Info An editor-reviewed summary of the themes and findings across this facility's recent inspection reports.

  • August 1, 2024 annual inspection found 23 deficiencies, all with plans of correction and future prevention strategies submitted by the facility.
  • Deficiencies repeatedly involved incomplete caregiver certifications, missing physical exams and tuberculosis clearances, medication labeling errors, care plan omissions, and documentation gaps from 2022 through 2024.
  • Medication management and care plan documentation issues persisted over three inspections, with delays in physician notifications and incomplete reassessments noted in 2023 and 2024.

Health Inspection History

Inspections since 2022
Total health inspections 5

Hawaii average 4.4


Last Health inspection on Oct 2025

Total health citations
37 Rank #20 / 34Health citations — State benchmarkedThis home is ranked 20th out of 34 homes in Hawaii. Shows this facility's total health deficiency citations benchmarked to the Hawaii State average, with a ranking across all 34 HI facilities. Lower citation counts earn a better rank.Rankings are based only on facilities in Hawaii that report data for that category. Facilities without available data are excluded from the ranking.Click the rank badge to see the full State ranking.Click here to see the full State ranking.

Hawaii average 35.5

Citations per inspection
7.4 Rank #20 / 34Citations per inspection — State benchmarkedThis home is ranked 20th out of 34 homes in Hawaii. Shows average deficiency citations per CMS inspection for this facility versus the Hawaii mean across 34 facilities with citation data. Lower is better.Rankings are based only on facilities in Hawaii that report data for that category. Facilities without available data are excluded from the ranking.Click the rank badge to see the full State ranking.Click here to see the full State ranking.

Hawaii average 8.23


Health citations are formal notices following inspections when they fail to comply with safety and care standards.

26 of 37 citations resulted from standard inspections; 6 of 37 resulted from complaint investigations; and 5 of 37 came from combined inspections (standard and complaint).

Breakdown of citation severity (last 4 years)
Critical health citations
0
100% better than Hawaii average

Hawaii average: 0.1


Serious health citations
0
100% better than Hawaii average

Hawaii average: 1

0 critical citations Hawaii average: 0.1

0 serious citations Hawaii average: 1

37 moderate citations Hawaii average: 34.2

0 minor citations Hawaii average: 0.1
Citations history (last 4 years)
Infection Control moderate citation Oct 09, 2025

Pharmacy moderate citation Oct 09, 2025

Quality of Care moderate citation Oct 09, 2025

Care Planning moderate citation Oct 09, 2025

Staffing Data

Reporting period: October 1 – December 31, 2025 (Q4 2025). Source: CMS Payroll-Based Journal report.

Total staff 306
Employees 235
Contractors 71
Staff to resident ratio 2.32 : 1
40% more staff per resident than Hawaii average
Hawaii average ratio: 1.65 : 1 Hawaii average ratio: 1.65 : 1See full Hawaii ranking
Avg staff/day 130
Average shift 8 hours
0% compared with Hawaii average
Hawaii average: 7.8 hours Hawaii average shift: 7.8 hoursSee full Hawaii ranking
Total staff hours (quarter) 95,587

Nursing staff breakdown

Q4 2025 · Oct 1 – Dec 31 More info This data comes from the CMS Payroll-Based Journal report covering October 1 – December 31, 2025.
Registered Nurse

Manages medical care and health needs.

RN Staff Info All 58 RN Staff are full-time employees. No contractors work on this role. 58
Average shift length Info Average shift length. Calculated as total hours divided by days worked and average staff per day. 8.2 hours
Licensed Practical Nurse

Assists with medical care and medications.

LPN Staff Info All 19 LPN Staff are full-time employees. No contractors work on this role. 19
Average shift length Info Average shift length. Calculated as total hours divided by days worked and average staff per day. 8.7 hours
Certified Nursing Assistant

Helps with daily care and mobility.

CNA Staff Info All 126 CNA Staff are full-time employees. No contractors work on this role. 126
Average shift length Info Average shift length. Calculated as total hours divided by days worked and average staff per day. 7.8 hours

Contractor staffing

Q4 2025 · Oct 1 – Dec 31 More info This data comes from the CMS Payroll-Based Journal report covering October 1 – December 31, 2025.

Total hours from contractors

15.9%

15,208 contractor hours this quarter

Respiratory Therapy Technician: 17 Physical Therapy Aide: 16 Speech Language Pathologist: 14 Physical Therapy Assistant: 11 Qualified Social Worker: 10 Other Dietary Services Staff: 3

Staff by category

Q4 2025 · Oct 1 – Dec 31 More info This data comes from the CMS Payroll-Based Journal report covering October 1 – December 31, 2025.
Certified Nursing Assistant126012639,57992100%7.8
Registered Nurse5805824,87392100%8.2
Licensed Practical Nurse190197,44292100%8.7
Clinical Nurse Specialist160165,5648188%8.3
Respiratory Therapy Technician017173,7999199%7.8
Physical Therapy Aide016163,4738997%7.8
Speech Language Pathologist014142,83192100%7.2
Physical Therapy Assistant011112,58692100%7.6
Nurse Aide in Training100101,7309199%7
Qualified Social Worker010101,4947582%8.3
Other Dietary Services Staff0331,0257379%7.7
Administrator1014725964%8
Nurse Practitioner1013764751%8
Dental Services Staff4043441112%8
126 Certified Nursing Assistant
% of Days 100%
58 Registered Nurse
% of Days 100%
19 Licensed Practical Nurse
% of Days 100%
16 Clinical Nurse Specialist
% of Days 88%
17 Respiratory Therapy Technician
% of Days 99%
16 Physical Therapy Aide
% of Days 97%
14 Speech Language Pathologist
% of Days 100%
11 Physical Therapy Assistant
% of Days 100%
10 Nurse Aide in Training
% of Days 99%
10 Qualified Social Worker
% of Days 82%
3 Other Dietary Services Staff
% of Days 79%
1 Administrator
% of Days 64%
1 Nurse Practitioner
% of Days 51%
4 Dental Services Staff
% of Days 12%

Penalties and fines

Federal penalties imposed by CMS for regulatory violations, including civil money penalties (fines) and denials of payment for new Medicare/Medicaid admissions.

Source: CMS Penalties Database

No penalties in the past 3 years

No civil money penalties or payment denials were reported in the last 3 years.

Quality of care over time

These measures show how residents usually do over time at this home, based on health outcomes and preventive care.

High-risk clinical events score Info A composite score based on pressure ulcers, falls with injury, weight loss, walking ability decline, and activities of daily living decline. 11.8
16% worse than Hawaii average

Hawaii average: 10.2

Functional decline score Info A composite score based on activities of daily living decline, walking ability decline, and incontinence. 21.5
8% worse than Hawaii average

Hawaii average: 20.0

Long-stay resident measures
Need for Help with Daily Activities Increased Info Percent of long-stay residents whose need for help with daily activities has increased 22.2%
26% worse than Hawaii average

Hawaii average: 17.6%

Low Risk Residents with Bowel/Bladder Incontinence Info Percent of low risk long-stay residents who lose control of their bowels or bladder 20.8%
13% worse than Hawaii average

Hawaii average: 18.3%

Falls with Major Injury Info Percent of long-stay residents experiencing one or more falls with major injury 0.0%
100% better than Hawaii average

Hawaii average: 2.1%

High Risk Residents with Pressure Ulcers Info Percent of long-stay high risk residents with pressure ulcers 16.1%
341% worse than Hawaii average

Hawaii average: 3.6%

Urinary Tract Infection Info Percent of long-stay residents with a urinary tract infection 8.3%
247% worse than Hawaii average

Hawaii average: 2.4%

Lost Too Much Weight Info Percent of long-stay residents who lose too much weight 9.1%
92% worse than Hawaii average

Hawaii average: 4.7%

Depressive Symptoms Info Percent of long-stay residents who have depressive symptoms 0.0%
100% better than Hawaii average

Hawaii average: 1.5%

Antipsychotic Use Info Percent of long-stay residents who received an antipsychotic medication 0.0%
100% better than Hawaii average

Hawaii average: 10.1%

Pneumococcal Vaccine Info Percent of long-stay residents assessed and appropriately given the pneumococcal vaccine 100.0%
In line with Hawaii average

Hawaii average: 96.3%

Short-stay resident measures
Pneumococcal Vaccine Info Percent of short-stay residents assessed and appropriately given the pneumococcal vaccine 98.7%
18% better than Hawaii average

Hawaii average: 83.4%

Antipsychotic medication increase Info Percent of short-stay residents who newly received an antipsychotic medication 0.3%
72% better than Hawaii average

Hawaii average: 1.2%

Influenza Vaccine Info Percent of short-stay residents assessed and appropriately given the seasonal influenza vaccine 99.2%
17% better than Hawaii average

Hawaii average: 84.7%

Breakdown by payment type

Medicare

36% of new residents, usually for short-term rehab.

Typical stay 26 days

Private pay

64% of new residents, often for short stays.

Typical stay 24 days

Facility Characteristics

Source: CMS Long-Term Care Facility Characteristics (Data as of Jan 2026)

Total residents 132
Medicare
92
69.7% of residents
Medicaid
3
2.3% of residents
Private pay or other
37
28% of residents
Programs & Services
Residents Group

Residents meet regularly to discuss policies, care quality, and activities

Active Resident Council

Organized group of residents that meets regularly to discuss facility policies, quality of life, and activities.

Finances and operations

Based on CMS SNF Cost Report for fiscal year ending in 12/2023.

Privately-owned community
Operated by a single business entity.
Net patient revenue Info Net patient revenue — what the home actually collects for resident care, after contractual allowances, bad debt and discounts are subtracted from its gross charges (CMS cost report, Worksheet G-3). It covers resident care only; money the home earns from other sources is shown separately as "Other income."
$25.2M
Net patient income Info Net patient income: net patient revenue minus the home's total operating expenses. A positive figure means it earns more from resident care than it spends to deliver it; a negative figure means the opposite. It excludes non-operating "other income."
-$1.2M
Privately-owned community Operated by a single business entity.
Net patient revenue Info Net patient revenue — what the home actually collects for resident care, after contractual allowances, bad debt and discounts are subtracted from its gross charges (CMS cost report, Worksheet G-3). It covers resident care only; money the home earns from other sources is shown separately as "Other income."
$25.2M Rank #5 / 29Revenue — State benchmarkedThis home is ranked 5th out of 29 homes in Hawaii. Shows this facility's annual revenue compared to the Hawaii average. Higher revenue generally means more resources for staffing and capital — read alongside Payroll %.Rankings are based only on facilities in Hawaii that report data for that category. Facilities without available data are excluded from the ranking.Click the rank badge to see the full State ranking.Click here to see the full State ranking.
Net patient income Info Net patient income: net patient revenue minus the home's total operating expenses. A positive figure means it earns more from resident care than it spends to deliver it; a negative figure means the opposite. It excludes non-operating "other income."
-$1.2M
Other income Info Money the home earns outside of resident care — such as investments, grants, rentals and other non-operating sources (CMS cost report, Worksheet G-3). It is tracked separately from net patient revenue: it is not part of that figure, and it is not included in net patient income.
$135.0K
Payroll costs Info Staff salaries plus wage-related costs — benefits such as payroll taxes, health insurance and retirement — from the home's own accounting records (CMS cost report, Worksheet A). Contract or agency labor is counted separately, under other operating costs. Rank #10 / 29Payroll — State benchmarkedThis home is ranked 10th out of 29 homes in Hawaii. Shows total annual staff payroll benchmarked to the Hawaii average. Higher payroll investment relative to peers often signals better staffing and less reliance on cheaper contract labor.Rankings are based only on facilities in Hawaii that report data for that category. Facilities without available data are excluded from the ranking.Click the rank badge to see the full State ranking.Click here to see the full State ranking.
$9.7M 38.6% of net patient revenue Info Payroll as a share of revenue: staff salaries and wage-related benefits divided by net patient revenue. A higher figure means more of each revenue dollar goes to staff pay. Rank #29 / 29Payroll % — State benchmarkedThis home is ranked 29th out of 29 homes in Hawaii. Shows payroll as a percentage of revenue versus the Hawaii average. Well-run Hawaii facilities typically land around 52–61% — the top third Statewide. Below 25% may signal understaffing or heavy agency use — read with Staffing ratings.Rankings are based only on facilities in Hawaii that report data for that category. Facilities without available data are excluded from the ranking.Click the rank badge to see the full State ranking.Click here to see the full State ranking.
Other operating costs Info Everything it costs to run the home apart from payroll — food, utilities, supplies, maintenance, contract labor and administration. Calculated as total operating expense minus payroll (staff salaries and wage-related benefits).
$16.7M
Total costs Info The home's total operating expense for the year — all the costs of running it, salaries included (CMS cost report, Worksheet G-3).
$26.4M

What does this home offer?

Room sizes icon
Room sizes icon

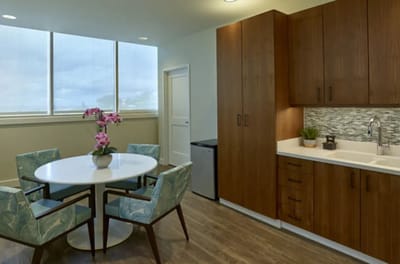
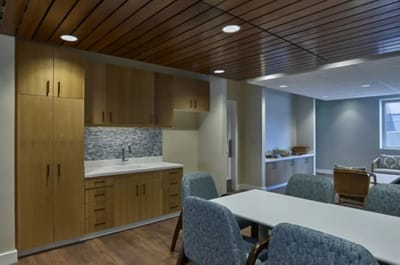
Room Sizes: Studio / 1 Bed

Building type icon
Building type icon

Building Type: Mid-rise

Fitness and recreation icon

Fitness and Recreation

Who this home usually serves

TYPE OF STAY

Primarily short stays

Residents typically stay for brief periods, with frequent admissions and discharges throughout the year.

Most new residents arrive under private pay (64% of admissions), and a typical private pay stay runs around 24 days.

Admissions
1,273 total

Coverage residents most often arrive under.

Medicare 36%
Private pay 64%
Discharges
1,229 total

Coverage residents most often leave under.

Medicare 38%
Private pay 61%
Medicaid 1%

Places of interest near Hale O Meleana

Address 1.9 miles from city center Info Estimated distance in miles from Honolulu's city center to Hale O Meleana's address, calculated via Google Maps.

Calculate Travel Distance to Hale O Meleana

Add your location

Address

Compare Assisted Living around Honolulu

The information below is reported by the Hawaii Department of Health, Office of Health Care Assurance.

Hale O Meleana
AL
NH
MC
RC
Honolulu (Liliha - Kapalama) -
176
Facility 176
HI AVG 43
Rank #4 / 87
-
37
Facility 37
HI AVG 49
Rank #108 / 178
-
Kalākaua Gardens
AL
IL
MC
NH
RC
Honolulu (Ala Moana) -
49
Facility 49
HI AVG 43
Rank #24 / 87
-
98
Facility 98
HI AVG 49
Rank #3 / 178
Studio / 1 Bed
15 Craigside
AL
ADC
HC
IL
NH
Honolulu (Nuuanu - Punchbowl) -
45
Facility 45
HI AVG 43
Rank #26 / 87
A+
50
Facility 50
HI AVG 49
Rank #85 / 178
Studio / 1 Bed
Maunalani Nursing and Rehabilitation Center
AL
NH
Honolulu (Kaimuki) -
100
Facility 100
HI AVG 43
Rank #13 / 87
-
11
Facility 11
HI AVG 49
Rank #153 / 178
-
Liliha Healthcare Center
AL
HC
NC
NH
PC
RC
Honolulu (Liliha - Kapalama) -
92
Facility 92
HI AVG 43
Rank #17 / 87
-
81
Facility 81
HI AVG 49
Rank #29 / 178
-

Financial Assistance for
Assisted Living in Hawaii

Hale O Meleana is located in Honolulu, Hawaii.
Here are the financial assistance programs available to residents in Hawaii.

Get Financial aid guidance

QUEST Integration

Hawaii Medicaid QUEST Integration

Age 65+ or disabled
General Hawaii resident, Medicaid-eligible, long-term care need.
Income Limits (2025) ~$2,829/month 300% FBR, individual
Asset Limits $2,000 (individual), $3,000 (couple).
HI

High cost of living adjustments.

Benefits
In-home care (6-8 hours/day) Nursing home Respite (240 hours/year) Medical services

Kupuna Care

Hawaii Kupuna Care

Age 60+
General Hawaii resident, unable to perform 2+ ADLs.
Income Limits No strict limit; prioritizes low-income.
Asset Limits Not applicable.
HI

Limited funding; island-specific delivery.

Benefits
In-home care (3-5 hours/week) Adult day care (~$70/day) Transportation (~5 trips/month)

Program of All-Inclusive Care for the Elderly (PACE)

Hawaii Medicaid PACE

Age 55+
General Hawaii resident, nursing home-level care need, safe with PACE support.
Income Limits (2025) ~$2,829/month 300% FBR
Asset Limits $2,000 (individual), $3,000 (couple).
HI

Limited to Oahu (e.g., Maluhia in Honolulu); few providers.

Benefits
Personal care (5-7 hours/day) Medical care Meals Transportation Therapy Respite

Medicare Savings Program (MSP)

Hawaii Medicare Savings Program

Age 65+ or disabled
General Hawaii resident, Medicare Part A/B.
Income Limits (2025) ~$2,510/month (QMB), ~$3,380/month (SLMB), ~$3,598/month (QI)—individual, adjusted annually.
Asset Limits $9,430 (individual), $14,130 (couple).
HI

Three tiers; no waitlist.

Benefits
Covers Part B premiums ($174.70/month) Deductibles ($240/year) Copays (~20%)

National Family Caregiver Support Program (NFCSP) Respite

Hawaii NFCSP Respite Care

Age
General Caregivers of 60+ needing care or 55+ caregivers of others; Hawaii resident; functional needs (2+ ADLs).
Income Limits (2025) Prioritizes ~$24,980/year (individual); no strict cap.
Asset Limits Not assessed; need-based.
HI

Four county AAAs; prioritizes low-income.

Benefits
Respite (4-6 hours/week or 5 days/year) Adult day care ($80/day) Counseling

VA Aid and Attendance (A&A) and Housebound Benefits

Hawaii VA Aid and Attendance/Housebound

Age 65+ or disabled veteran/surviving spouse
General Hawaii resident, wartime service, need for aid with ADLs (A&A) or homebound status.
Income Limits (2025) Net income < ~$1,984/month (veteran with dependent, A&A); pension offsets income.
Asset Limits ~$155,356 2025 net worth limit
HI

Applies statewide; high demand due to veteran population.

Benefits
Cash (~$1,433-$2,642/month veteran, ~$951-$1,318 spouse) for care costs (e.g., in-home, assisted living)

Senior Companion Program (SCP)

Hawaii Senior Companion Program

Age
General Volunteers: 55+, low-income, Hawaii resident, able to work 20 hours/week. Recipients: Frail elders needing companionship.
Income Limits (2025) Volunteers: ~$24,980/year (200% FPL); recipients: no limit.
Asset Limits Not specified for volunteers; need-based for recipients.
HI

Statewide; managed by DHS Social Services.

Benefits
Volunteers paid ~$4/hour for companionship (~20 hours/week); recipients get free support (~4-6 hours/week)

Frequently Asked Questions about Hale O Meleana

What neighborhood is Hale O Meleana in?

Hale O Meleana is in the Liliha - Kapalama neighborhood of Honolulu.

Who is the owner of Hale O Meleana?

The legal owner and operator of Hale O Meleana is Kelly Davis.

Is Hale O Meleana in a walkable area?

Hale O Meleana has a walk score of 37. Somewhat walkable. A few nearby services may be reachable on foot, but most trips require transportation.

What is the license number of Hale O Meleana?

According to HI state health department records, Hale O Meleana's license number is 1618-C.

When does Hale O Meleana's license expire?

According to HI state health department records, Hale O Meleana's license expires on November 30, 2026.

What is the occupancy rate at Hale O Meleana?

Hale O Meleana's occupancy is 55%.

How many beds does Hale O Meleana have?

Hale O Meleana has 176 beds.

Guides for Better Senior Living

Care Cost Calculator: See Prices in Your Area

Nursing Home Data Explorer

Don’t Wait Too Long: 7 Red Flag Signs Your Parent Needs Assisted Living Now

The True Cost of Assisted Living in 2025 – And How Families Are Paying For It

Understanding Senior Living Costs: Pricing Models, Discounts & Financial Assistance