Explore Open Rooms

1 Contact details
2 What type of senior care service are you looking for?
3 What budget do you have in mind for senior care?
4 How soon do you need to find care?
5 Additional details

Thank you for your interest!

Our team will be in touch shortly to help with next steps.

Nursing Home

Hancock Hall

Overview of Hancock Hall

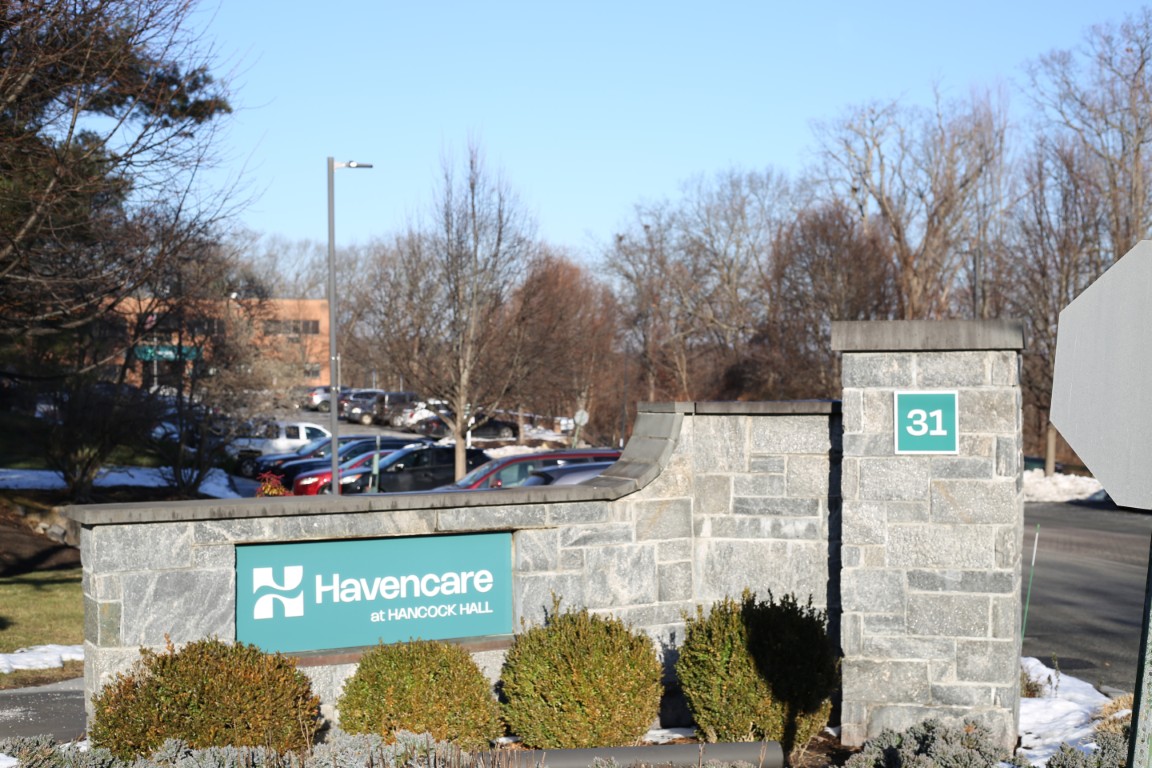
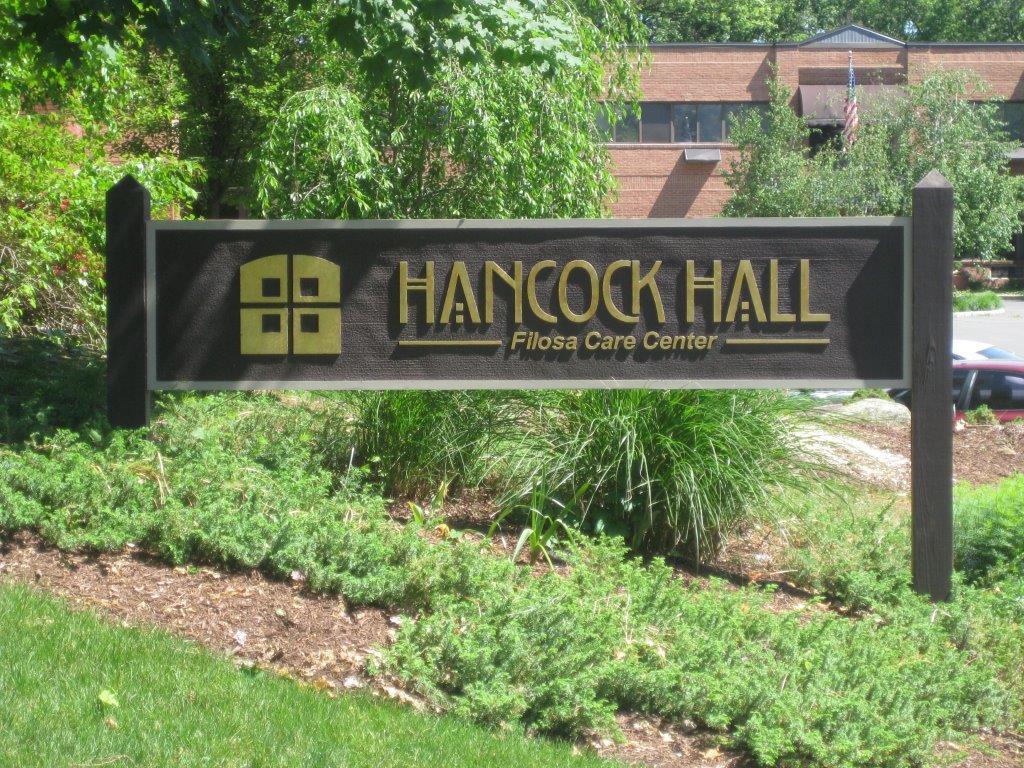
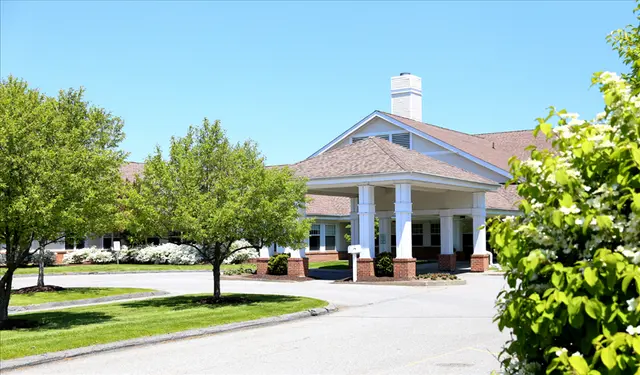
Experience unrivaled care and support with the extraordinary senior living community of Hancock Hall in Staples Street, Danbury, CT, providing long-term and short-term care. The community strives to provide a haven for seniors who need supplementary care in their golden years. With a team of kind and dedicated professionals attending to seniors’ needs and aspirations, seniors keep their peace of mind and live their lives to the fullest.

The community accepts Medicare and Medicaid to ease some of seniors’ financial constraints. Conveniently located near hospitals and other senior care providers, the community ensures residents’ needs are easily accessible. Hancock Hall is dedicated to enhancing seniors’ quality of life with its incredible amenities.

(203) 794-9466

Quality ratings

Measured by Centers for Medicare & Medicaid Services (CMS)

Overall rating Info The Overall CMS Rating combines results from health inspections, staffing levels and quality measures. Health inspections carry the most weight. Staffing and quality scores can increase or decrease the final rating based on performance compared to state and national standards.
5/5
Connecticut average: 3.4/5
Health Inspection Info Based on the results of the facility's three most recent standard inspections and any complaint investigations. CMS reviews the number, scope, and severity of deficiencies, with more recent findings weighted more heavily.
5/5
Connecticut average: 3.1/5
Staffing Info Measures average nursing staff hours per resident per day, including Registered Nurses (RNs) and total nursing staff. Ratings are adjusted based on the level of care residents require and are compared to state and national benchmarks.
3/5
Connecticut average: 3.4/5
Quality Measures Info Based on clinical and physical health indicators reported to CMS, such as hospital readmissions, falls, pressure ulcers, and improvements in mobility. These measures reflect how well residents' health needs are being managed.
5/5
Connecticut average: 3.6/5

Nursing care per resident

Info This shows how many total hours of nursing staff time are available per resident each day. Higher numbers usually mean more staff support.
3h 35m per day

This home provides 12% less nursing time per resident than the Connecticut average.

Connecticut average: 4h 4m per day

Staffing hours breakdown

Info Hours of care per resident per day, broken down by staff type. Data from CMS Medicare.
Staff type Facility State avg National avg
Registered Nurse (RN) Info Registered nurse hours per resident per day. 31m per day 42m per day 41m per day
Nurse Aide Info Nurse aide hours per resident per day. 2h 18m per day 2h 17m per day 2h 21m per day
Total Nursing (Weekend) Info Total number of nurse staff hours per resident per day on weekends. 3h 26m per day 3h 25m per day 3h 26m per day
Physical Therapist Info Physical therapist staff hours per resident per day. 5m per day 5m per day 4m per day
RN (Weekend) Info Registered nurse hours per resident per day on weekends. 30m per day 28m per day 29m per day

Capacity and availability

Smaller home

May offer a more intimate, personalized care environment.

Total beds 96

This home is often near full

That suggests steady demand, but availability may be limited.

Higher demand than most homes in Connecticut
Occupancy rate 95.8%
Residents per day (avg) 91
Occupancy rate
95.8%
Residents per day (avg)
91

Who this home usually serves

TYPE OF STAY

Mostly short-term rehab stays

Most residents typically stay for a few weeks or months before returning home or moving on.

Might be optimal for
Short stays Recovery Medicare-covered care

Breakdown by payment type

Medicare

88% of new residents, usually for short-term rehab.

Typical stay 18 days

Private pay

7% of new residents, often for short stays.

Typical stay 1 years

Medicaid

5% of new residents, often for long-term daily care.

Typical stay 3 - 4 years

Finances and operations

Privately-owned community
Operated by a business corporation.
Home revenue
$17.4M
Profit
$2.5M
Privately-owned community Operated by a business corporation.
Home revenue
$17,404,998.00
Profit
$2,462,138.00
Payroll costs Info The portion of the home's budget spent on staff, including nurses, caregivers, and other employees who support care and operations.
$6.2M
35.6% of revenue
Other operating costs Info All remaining costs needed to run the home, such as food, utilities, building maintenance, supplies and administrative expenses.
$8.8M
Total costs $14.9M
Years in operation
2 years in operation
A newer community that may feature more recent facilities and programs.
Walk Score
Walk Score: 20 / 100
Car-dependent. Most errands require a car, with limited nearby walkable options.

About this community

Occupancy

Occupancy rate
96%
In line with Connecticut average
Occupied beds
92 / 96
Average residents 102 per day

License details

Facility type
Chronic & Convalescent Nursing Home
Status Active
Issuance September 13, 2023
Expiration June 30, 2027

Additional licensing details

License number: 2481

Staffing

Key information about the people who lead and staff this community.

Staff Composition (State Data)

Admin
3 FTE
Registered Nurse
10 FTE
Licensed Practical Nurse
11 FTE
Nursing Assistant
26 FTE
Recreation
3 FTE
Social Services
2 FTE
Physical Therapy
2 FTE
Occupational Therapy
4 FTE
Speech Therapy
1 FTE
Dietary
11 FTE
Other Staff
9 FTE

What does this home offer?

Accepts Medicaid icon

Accept Medicaid: Yes

Total residents icon

Total Residents: 96

Building type icon
Building type icon

Building Type: Two-story

Types of Care at Hancock Hall

Independent Living Assisted Living Memory Care Nursing Home
Contact Hancock Hall

Inspection History

In Connecticut, the Department of Public Health, Facility Licensing and Investigations Section conducts mandatory inspections and unannounced surveys to monitor the quality of care in long-term facilities.

2 visits/inspections

1 routine inspections

Breakdown by inspection type
  • 1 licensing inspection

Connecticut average: 13 visits/inspections

Latest inspection

Date:May 1, 2025

Inspection history

05-01-2025 Inspection Report
10-23-2024 Inspection Report

1 deficiency

Deficiencies indicate regulatory issues. A higher number implies the facility had several areas requiring improvement.

Inspection Report Summary for Hancock Hall

The most recent inspection on April 25, 2025, found no deficiencies during the licensing renewal visit and included a complaint investigation that did not specify any findings. Earlier inspections showed a previously identified violation that was corrected by September 3, 2024, with a follow-up audit confirming compliance. The main issue involved a prior violation that was resolved, and no enforcement actions such as fines or license suspensions were listed in the available reports. Complaint investigations reviewed were either unsubstantiated or lacked detailed findings. The facility’s inspection history indicates improvement, with the most recent report showing no outstanding deficiencies.

Health Inspection History

Inspections
Total health inspections 4

Connecticut average 5.7


Last Health inspection on Aug 2024

Total health citations 12

Connecticut average 32

Citations per inspection
3

Connecticut average 5.82


Health citations are formal notices following inspections when they fail to comply with safety and care standards.

11 of 12 citations resulted from standard inspections; and 1 of 12 resulted from complaint investigations.

Breakdown of citation severity (last 3 years)
Critical Health citations More info 0
100% better than Connecticut average

Connecticut average: 0.3


Serious Health citations More info 0
100% better than Connecticut average

Connecticut average: 0.7

0 critical citations More info Connecticut average: 0.3

0 serious citations More info Connecticut average: 0.7

10 moderate citations More info Connecticut average: 28.8

2 minor citations More info Connecticut average: 2.3
Citations history (last 3 years)
Quality of Care moderate citation Info Issues related to how well residents receive appropriate treatment and support for their medical and daily care needs. Aug 06, 2024
Corrected

Pharmacy moderate citation Info Issues related to medication management, including how drugs are stored, administered, and monitored. Apr 13, 2023
Corrected

Quality of Care moderate citation Info Issues related to how well residents receive appropriate treatment and support for their medical and daily care needs. Apr 13, 2023
Corrected

Care Planning minor citation Info Issues related to creating and updating personalized care plans for residents based on their needs and conditions. Apr 13, 2023
Corrected

Compare Nursing Homes around Danbury The information below is reported by the Connecticut Department of Public Health, Facility Licensing and Investigations Section.

5 facilities compared · CMS & CT Dept. of Health data · Updated Mar 2026

Hancock Hall
AL

Assisted Living A licensed, long-term care setting for seniors or individuals with disabilities who need help with daily activities — like bathing, dressing, and medication management — but not 24-hour skilled nursing. Offers housing, meals, and around-the-clock support while aiming to maximize resident independence.

IL

Independent Living Lifestyle-focused communities for older adults offering dining, activities, and transportation with minimal personal care. Best for active, independent seniors who want community without medical support.

MC

Memory Care Secured, specialized care for people living with Alzheimer's or dementia. Staff trained in cognitive impairment, with higher staff-to-resident ratios and an environment designed to reduce confusion and wandering risk.

NH

Nursing Home Licensed facility providing 24/7 skilled nursing care for residents with complex, ongoing medical needs. Staffed by RNs, LPNs, and CNAs. Inspected and star-rated annually by CMS. Accepts Medicare (short-term rehab) and Medicaid (long-term care).

Danbury
96
91.1%
+8%
3.59
-17%
-10%
0
12
0
91
-
20
-
$17,5M
$6,2M
35.5%
75414
Filosa Nursing Home and Rehabilitation Center
NH

Nursing Home Licensed facility providing 24/7 skilled nursing care for residents with complex, ongoing medical needs. Staffed by RNs, LPNs, and CNAs. Inspected and star-rated annually by CMS. Accepts Medicare (short-term rehab) and Medicaid (long-term care).

AL

Assisted Living A licensed, long-term care setting for seniors or individuals with disabilities who need help with daily activities — like bathing, dressing, and medication management — but not 24-hour skilled nursing. Offers housing, meals, and around-the-clock support while aiming to maximize resident independence.

Danbury
64
93.5%
+11%
3.24
+8%
-18%
0
16
0
60
A+
50
Danbury Opco Llc
$11,5M
$4,3M
37.7%
75074
Glen Hill Center
NH

Nursing Home Licensed facility providing 24/7 skilled nursing care for residents with complex, ongoing medical needs. Staffed by RNs, LPNs, and CNAs. Inspected and star-rated annually by CMS. Accepts Medicare (short-term rehab) and Medicaid (long-term care).

AL

Assisted Living A licensed, long-term care setting for seniors or individuals with disabilities who need help with daily activities — like bathing, dressing, and medication management — but not 24-hour skilled nursing. Offers housing, meals, and around-the-clock support while aiming to maximize resident independence.

Danbury
100
86.6%
+3%
2.89
-33%
-27%
0
31
0
92
-
63
-
$21,6M
$5,8M
27.1%
75031
Bethel Health Care Center
NH

Nursing Home Licensed facility providing 24/7 skilled nursing care for residents with complex, ongoing medical needs. Staffed by RNs, LPNs, and CNAs. Inspected and star-rated annually by CMS. Accepts Medicare (short-term rehab) and Medicaid (long-term care).

AL

Assisted Living A licensed, long-term care setting for seniors or individuals with disabilities who need help with daily activities — like bathing, dressing, and medication management — but not 24-hour skilled nursing. Offers housing, meals, and around-the-clock support while aiming to maximize resident independence.

Bethel
175
85.7%
+2%
3.68
-41%
-7%
2
31
2
153
-
8
Bethel Investors, Llc
$35,6M
$11,3M
31.9%
75400
Civita Care Center at Danbury
NH

Nursing Home Licensed facility providing 24/7 skilled nursing care for residents with complex, ongoing medical needs. Staffed by RNs, LPNs, and CNAs. Inspected and star-rated annually by CMS. Accepts Medicare (short-term rehab) and Medicaid (long-term care).

AL

Assisted Living A licensed, long-term care setting for seniors or individuals with disabilities who need help with daily activities — like bathing, dressing, and medication management — but not 24-hour skilled nursing. Offers housing, meals, and around-the-clock support while aiming to maximize resident independence.

Danbury
120
69.2%
-18%
6.24
-43%
+57%
2
47
1
112
-
74
-
$10,8M
$4,4M
40.5%
75274

Places of interest near Hancock Hall

Address 1.5 miles from city center — 9.89 miles to nearest hospital (Hospital Plaza)
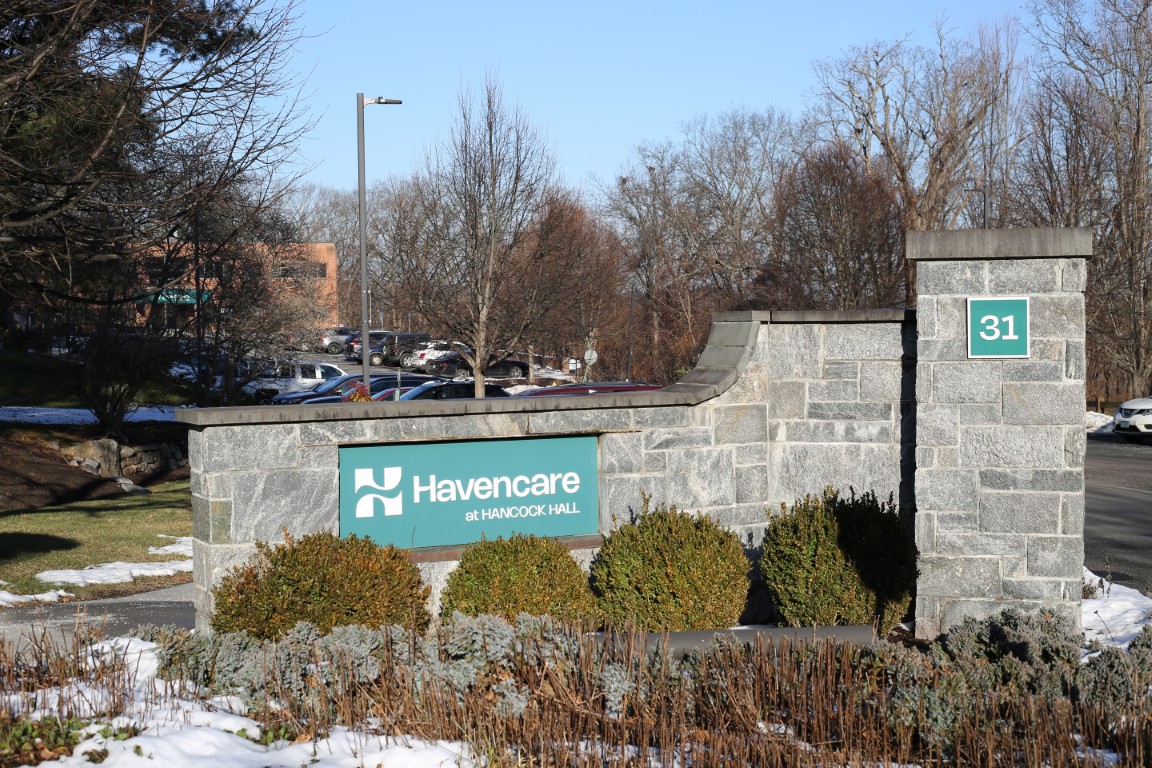
Address 31 Staples St, Danbury, CT 06810

Calculate Travel Distance to Hancock Hall

Add your location

Address

Staffing Data (Q2 2025)

This data corresponds to Q2 2025 and is based on CMS Payroll-Based Journal.

Total staff 187
Employees 101
Contractors 86
Staff to resident ratio 2.03:1
8% better than Connecticut average

Connecticut average ratio: 1.88:1

Avg staff/day 50
Average shift 7.8 hours
0% compared with Connecticut average

Connecticut average: 7.5 hours

Total staff hours (quarter) 35,546
Nursing staff breakdown
Registered Nurse

Manages medical care and health needs.

Total count 17
Average shift length Info Average shift length. Calculated as total hours divided by days worked and average staff per day. 7.9 hours

This role is partially covered by contractors.

Licensed Practical Nurse

Assists with medical care and medications.

Total count 41
Average shift length Info Average shift length. Calculated as total hours divided by days worked and average staff per day. 8 hours

This role is partially covered by contractors.

Certified Nursing Assistant

Helps with daily care and mobility.

Total count 95
Average shift length Info Average shift length. Calculated as total hours divided by days worked and average staff per day. 8 hours

This role is partially covered by contractors.

Contractor staffing

Total hours from contractors

16.9%

6,014 contractor hours this quarter

Certified Nursing Assistant: 41 Licensed Practical Nurse: 25 Respiratory Therapy Technician: 5 Qualified Social Worker: 4 Speech Language Pathologist: 4 Physical Therapy Aide: 3 Physical Therapy Assistant: 3 Registered Nurse: 1
Staff by category
Certified Nursing Assistant54419518,06491100%8
Licensed Practical Nurse1625416,24991100%8
Registered Nurse161174,56191100%7.9
Other Social Services Staff6069087684%7.7
Physical Therapy Aide0337557684%5.9
Physical Therapy Assistant0336236571%6.6
Clinical Nurse Specialist2025525763%8
Administrator1015046369%8
Speech Language Pathologist0444795965%5.5
RN Director of Nursing1014405560%8
Other Dietary Services Staff1014395560%8
Dental Services Staff1014355560%7.9
Mental Health Service Worker1014355560%7.9
Respiratory Therapy Technician0554336066%7.1
Nurse Practitioner2024325459%8
Qualified Social Worker0442385560%4.3
95 Certified Nursing Assistant
% of Days 100%
41 Licensed Practical Nurse
% of Days 100%
17 Registered Nurse
% of Days 100%
6 Other Social Services Staff
% of Days 84%
3 Physical Therapy Aide
% of Days 84%
3 Physical Therapy Assistant
% of Days 71%
2 Clinical Nurse Specialist
% of Days 63%
1 Administrator
% of Days 69%
4 Speech Language Pathologist
% of Days 65%
1 RN Director of Nursing
% of Days 60%
1 Other Dietary Services Staff
% of Days 60%
1 Dental Services Staff
% of Days 60%
1 Mental Health Service Worker
% of Days 60%
5 Respiratory Therapy Technician
% of Days 66%
2 Nurse Practitioner
% of Days 59%
4 Qualified Social Worker
% of Days 60%

Facility Characteristics

Source: CMS Long-Term Care Facility Characteristics (Data as of Jan 2026)

Total census
92 residents
Residents by payment source
Medicare
20 residents (21.7%)
Medicaid
53 residents (57.6%)
Private pay or other
19 residents (20.7%)
Programs & Services
Residents' Group

Residents meet regularly to discuss policies, care quality, and activities

Family Member Group

Family members meet regularly to discuss policies, care quality, and activities

Active Family Council

Organized group of family members that meets regularly to discuss facility policies, resident care, and activities.

Active Resident Council

Organized group of residents that meets regularly to discuss facility policies, quality of life, and activities.

Quality of care over time

These measures show how residents usually do over time at this home, based on health outcomes and preventive care.

High-risk clinical events score Info A composite score based on pressure ulcers, falls with injury, weight loss, walking ability decline, and activities of daily living decline. 5.1
51% better than Connecticut average

Connecticut average: 10.4

Functional decline score Info A composite score based on activities of daily living decline, walking ability decline, and incontinence. 14.6
31% better than Connecticut average

Connecticut average: 21.1

Long-stay resident measures
Significantly above average Connecticut avg: 3.2 Info CMS star rating based on long-stay quality measure performance. 5 stars = significantly above average, 1 star = significantly below average.
Need for Help with Daily Activities Increased Info Percent of long-stay residents whose need for help with daily activities has increased 7.6%
60% better than Connecticut average

Connecticut average: 18.9%

Walking Ability Worsened Info Percent of long-stay residents whose ability to move independently worsened 8.6%
55% better than Connecticut average

Connecticut average: 19.2%

Low Risk Residents with Bowel/Bladder Incontinence Info Percent of low risk long-stay residents who lose control of their bowels or bladder 27.6%
11% worse than Connecticut average

Connecticut average: 24.9%

Falls with Major Injury Info Percent of long-stay residents experiencing one or more falls with major injury 3.7%
7% worse than Connecticut average

Connecticut average: 3.5%

High Risk Residents with Pressure Ulcers Info Percent of long-stay high risk residents with pressure ulcers 2.3%
51% better than Connecticut average

Connecticut average: 4.6%

Urinary Tract Infection Info Percent of long-stay residents with a urinary tract infection 0.3%
80% better than Connecticut average

Connecticut average: 1.7%

Lost Too Much Weight Info Percent of long-stay residents who lose too much weight 3.4%
46% better than Connecticut average

Connecticut average: 6.3%

Depressive Symptoms Info Percent of long-stay residents who have depressive symptoms 29.4%
94% worse than Connecticut average

Connecticut average: 15.2%

Antipsychotic Use Info Percent of long-stay residents who received an antipsychotic medication 3.0%
82% better than Connecticut average

Connecticut average: 17.2%

Pneumococcal Vaccine Info Percent of long-stay residents assessed and appropriately given the pneumococcal vaccine 100.0%
14% better than Connecticut average

Connecticut average: 87.5%

Influenza Vaccine Info Percent of long-stay residents assessed and appropriately given the seasonal influenza vaccine 100.0%
7% better than Connecticut average

Connecticut average: 93.5%

Hospitalizations per 1,000 days Info Number of hospitalizations per 1,000 long-stay resident days. 0.65
69% better than Connecticut average

Connecticut average: 2.10

ED visits per 1,000 days Info Number of outpatient emergency department visits per 1,000 long-stay resident days. 0.52
66% better than Connecticut average

Connecticut average: 1.53

Short-stay resident measures
Above average Connecticut avg: 3.3 Info CMS star rating based on short-stay quality measure performance. 5 stars = much above average, 1 star = much below average.
Pneumococcal Vaccine Info Percent of short-stay residents assessed and appropriately given the pneumococcal vaccine 99.1%
41% better than Connecticut average

Connecticut average: 70.1%

Antipsychotic medication increase Info Percent of short-stay residents who newly received an antipsychotic medication 0.6%
61% better than Connecticut average

Connecticut average: 1.5%

Influenza Vaccine Info Percent of short-stay residents assessed and appropriately given the seasonal influenza vaccine 94.1%
35% better than Connecticut average

Connecticut average: 69.8%

Re-hospitalized after SNF stay Info Percentage of short-stay residents who were re-hospitalized after their nursing home admission. 26.6%
6% worse than Connecticut average

Connecticut average: 25.0%

Emergency department visits Info Percentage of short-stay residents who had an outpatient emergency department visit. 16.2%
46% worse than Connecticut average

Connecticut average: 11.1%

Falls with major injury Info Percentage of SNF residents who experience falls with major injury during their stay. 0.7%
12% better than Connecticut average

Connecticut average: 0.8%

Ability to care for self at discharge Info Percentage of residents at or above expected ability to care for themselves at discharge. 76.4%
42% better than Connecticut average

Connecticut average: 53.7%

Successful return to home or community Info Rate of successful return to home or community from a skilled nursing facility. 61.3%
21% better than Connecticut average

Connecticut average: 50.6%

Guides for Better Senior Living

Care Cost Calculator: See Prices in Your Area

Nursing Home Data Explorer

Don’t Wait Too Long: 7 Red Flag Signs Your Parent Needs Assisted Living Now

The True Cost of Assisted Living in 2025 – And How Families Are Paying For It

Understanding Senior Living Costs: Pricing Models, Discounts & Financial Assistance

Financial Aid for Connecticut Seniors

Get financial aid guidance

Connecticut Home Care Program for Elders

CHCPE

Age 65+, Connecticut resident, at risk of nursing home placement.

State-funded: ~$1,600/month; Medicaid: ~$2,829/month (300% FBR).

$1,600 (state), $2,000 (Medicaid, individual).

Two tiers (state and Medicaid); waitlists possible.

Statewide Respite Care Program

CT Respite Care

Caregiver of senior with dementia, Connecticut resident.

~$2,500/month (individual, varies).

$40,000 (individual).

Limited to dementia caregivers; capped funding.

Congregate Housing Services Program (CHSP)

Connecticut Congregate Housing Services Program

Age 62+, Connecticut resident, frail but not needing 24/7 care, resides in CHSP-eligible housing.

~$41,000/year (individual, adjusted annually).

Not specified; focus is income-based.

Limited to 14 state-subsidized sites; participants pay 10% of service costs.

Medicare Savings Program (MSP)

Connecticut Medicare Savings Program

Age 65+ or disabled, Connecticut resident, enrolled in Medicare Part A/B.

~$2,510/month (individual, QMB); ~$3,380/month (SLMB); ~$3,598/month (ALMB)—adjusted annually.

None since 2023 policy change.

Three tiers (Qualified Medicare Beneficiary, Specified Low-Income, Additional Low-Income); no asset test.

Senior Community Service Employment Program (SCSEP)

Connecticut SCSEP (federally funded, state-administered)

Age 55+, unemployed, low-income, Connecticut resident.

~$1,983/month (125% FPL, individual).

Not specified; income-focused.

Priority for veterans, rural residents; limited slots (~500/year).

Tour Icon
Planning a tour? Check our touring checklist.
Chat Icon
Thinking of living here? We can help you speak to a current resident