Harrison House of Snow Hill
Nursing Home, Hospice Care & Memory Care · Snow Hill, MD
CMS overall rating Info CMS (the Centers for Medicare & Medicaid Services) is the federal agency that rates nursing home quality. Its Overall Rating runs from 1 to 5 stars, combining health inspections, staffing, and quality measures, with inspections weighted most heavily.

Harrison House of Snow Hill

Nursing Home, Hospice Care & Memory Care · Snow Hill, MD
CMS overall rating Info CMS (the Centers for Medicare & Medicaid Services) is the federal agency that rates nursing home quality. Its Overall Rating runs from 1 to 5 stars, combining health inspections, staffing, and quality measures, with inspections weighted most heavily.
Calculator: See prices in your area
Harrison House of Snow Hill accepts Medicare, Medicaid, and private pay.

Overview of Harrison House of Snow Hill

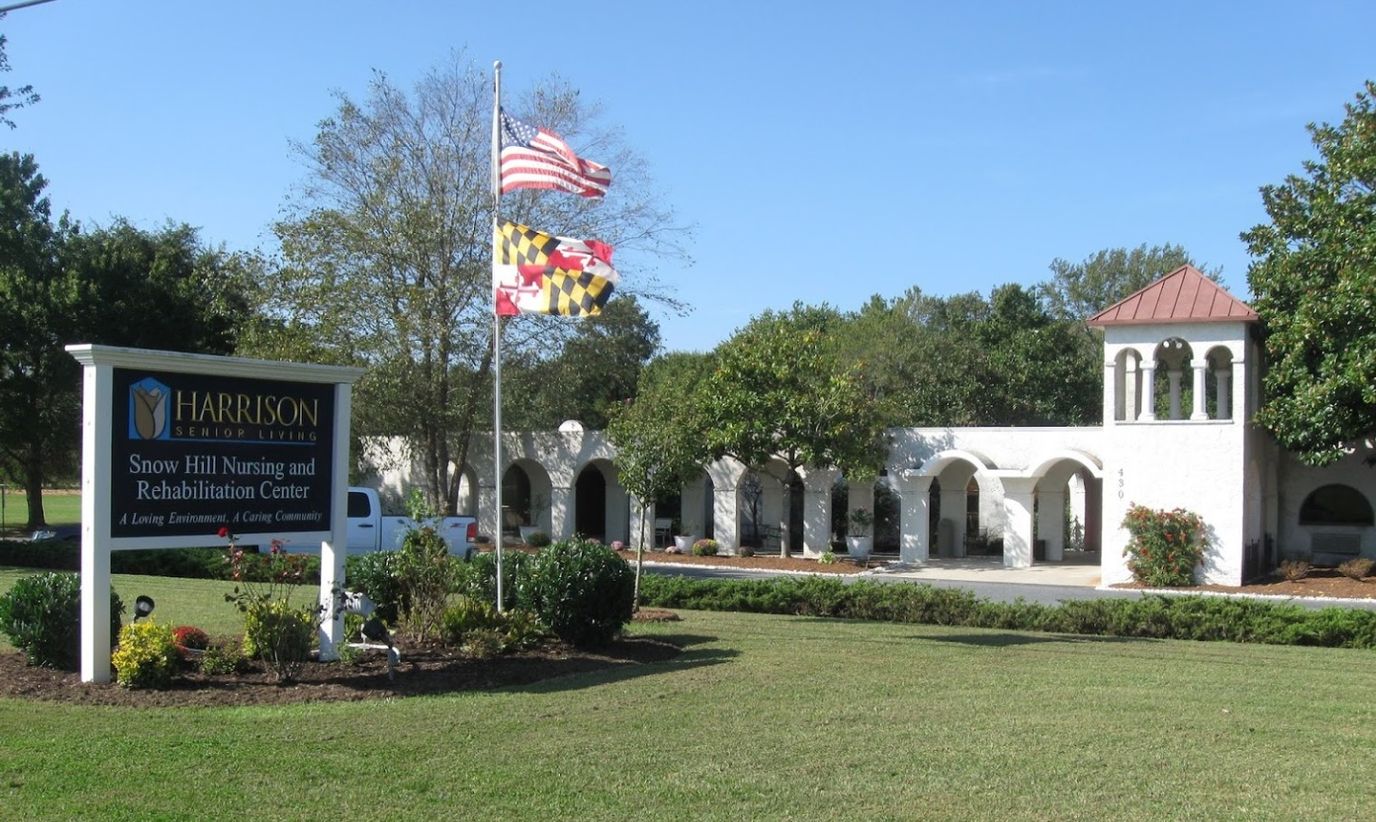
Harrison Senior Living at Snow Hill offers its seniors a well-curated system that maximizes their recovery experience and is delivered by high-quality skilled nursing and rehabilitative care. Families and seniors themselves can rest their confidence in the hands of professional caregivers and nurses who encourage and support individuals every step of the way. For more than 40 years, the premier nursing facility has been trusted as a place with a loving environment that nurtures a caring community.

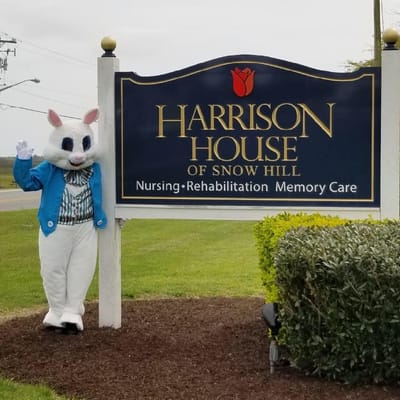
The Harrison House of Snow Hill stands as one of the trusted choices in the city because of its forward-thinking accommodations that support a relaxing recovery journey. Essential medical services are focused on skilled nursing and rehabilitative therapy, such as IV therapy, therapy (speech, occupational, physical), eye care, dental care, and individualized memory care support– among many others.

Quality ratings

Measured by Centers for Medicare & Medicaid Services (CMS)

Overall rating Info The Overall CMS Rating combines results from health inspections, staffing levels and quality measures. Health inspections carry the most weight. Staffing and quality scores can increase or decrease the final rating based on performance compared to state and national standards.
Health Inspection Info Based on the results of the facility's three most recent standard inspections and any complaint investigations. CMS reviews the number, scope, and severity of deficiencies, with more recent findings weighted more heavily.
Staffing Info Measures average nursing staff hours per resident per day, including Registered Nurses (RNs) and total nursing staff. Ratings are adjusted based on the level of care residents require and are compared to state and national benchmarks.
Quality Measures Info Based on clinical and physical health indicators reported to CMS, such as hospital readmissions, falls, pressure ulcers, and improvements in mobility. These measures reflect how well residents' health needs are being managed.

Staffing hours breakdown

Info Daily nursing hours per resident by staff type, reported to CMS. Higher is generally better — compare this facility to state and national averages to see where staffing stands.

Hours per resident per day — compared to state averages

Total nursing care / resident Info Total adjusted nursing hours per resident per day, combining RN, LPN, and aide time. CMS adjusts this for case-mix so facilities can be fairly compared.
3h 27m per day
vs avg

4 of 6 metrics below state avg

Standout metric Weekend RN is +8% above state avg
Staff typeHours / Day / Residentvs state avg
Registered Nurse (RN) Info RNs hold the highest nursing license and can assess residents, interpret test results, and direct care plans. More RN hours per day often signals stronger clinical oversight and faster response to health changes. 51m per day ■ Avg State avg: 50m per day · National avg: 41m per day
LPN / LVN Info Licensed Practical Nurses (LPNs) or Licensed Vocational Nurses (LVNs) deliver routine hands-on care — medication administration, wound dressing, and monitoring vital signs. They work under RN supervision and make up a large share of daily bedside care. 44m per day ▼ 19% State avg: 54m per day · National avg: 52m per day
Nurse Aide Info Certified Nurse Aides (CNAs) provide the most direct day-to-day assistance: bathing, dressing, feeding, and mobility. Nurse aide hours are typically the largest staffing category and directly affect residents' quality of life. 2h 3m per day ▼ 5% State avg: 2h 10m per day · National avg: 2h 21m per day
Weekend Total Nursing Info Combined nursing hours (RN + LPN + Nurse Aide) per resident per day on weekends. Staffing often drops on weekends — this figure reveals whether the facility maintains adequate coverage outside of weekday hours. 3h 23m per day ▼ 3% State avg: 3h 29m per day · National avg: 3h 26m per day
Physical Therapist Info Hours per resident per day provided by licensed Physical Therapists (PTs) or PT Assistants. PT services help residents recover mobility after injury or illness and are especially important for post-acute (short-stay) rehabilitation. 3m per day ▼ 44% State avg: 5m per day · National avg: 4m per day
Weekend RN Info Registered nurse hours specifically on weekends. Facilities sometimes reduce RN presence on Saturdays and Sundays — a low weekend RN figure compared to weekday hours can indicate reduced clinical oversight when most administrative staff are absent. 40m per day ▲ 8% State avg: 37m per day · National avg: 29m per day

Capacity and availability

This home usually has availability

Lower occupancy than the state average
Occupancy rate
80.9%
Avg. Length of Stay Info Average number of days residents stay at this facility, based on CMS cost report data. Shorter stays often reflect post-acute or rehab care; longer stays reflect long-term care.
127 days
Bed community size
69-bed community Rank #195 / 697Bed count — State benchmarkedThis home is ranked 195th out of 697 homes in Maryland. Shows this facility's certified or reported bed count compared to other Maryland facilities. Larger communities may offer more amenities, programs, and on-site services for residents and families.Rankings are based only on facilities in Maryland that report data for that category. Facilities without available data are excluded from the ranking.Click the rank badge to see the full State ranking.Click here to see the full State ranking.
A moderately sized community that may balance personal attention with shared amenities and social activities.
Walk Score
Walk Score: 21 / 100 Rank #731 / 985Walk Score — State benchmarkedThis home is ranked 731st out of 985 homes in Maryland. Shows how walkable this facility's neighborhood is compared to the average Walk Score across Maryland facilities. Higher scores benefit residents, families, and staff.Rankings are based only on facilities in Maryland that report data for that category. Facilities without available data are excluded from the ranking.Click the rank badge to see the full State ranking.Click here to see the full State ranking.
Car-dependent. Most errands require a car, with limited nearby walkable options.

Contact Harrison House of Snow Hill

Staffing Data

Reporting period: October 1 – December 31, 2025 (Q4 2025). Source: CMS Payroll-Based Journal report.

Total staff 144
Employees 81
Contractors 63
Staff to resident ratio 2.22 : 1
0% compared with State average

State average ratio: 0 : 0

Avg staff/day 33
Average shift 8 hours
0% compared with State average

State average: 0 hours

Total staff hours (quarter) 24,295

Nursing staff breakdown

Q4 2025 · Oct 1 – Dec 31 More info This data comes from the CMS Payroll-Based Journal report covering October 1 – December 31, 2025.
Registered Nurse

Manages medical care and health needs.

RN Staff Info 26 total: 12 full-time employees and 14 contractors. 26
Average shift length Info Average shift length. Calculated as total hours divided by days worked and average staff per day. 8.9 hours
Licensed Practical Nurse

Assists with medical care and medications.

LPN Staff Info 30 total: 12 full-time employees and 18 contractors. 30
Average shift length Info Average shift length. Calculated as total hours divided by days worked and average staff per day. 8.9 hours
Certified Nursing Assistant

Helps with daily care and mobility.

CNA Staff Info 66 total: 35 full-time employees and 31 contractors. 66
Average shift length Info Average shift length. Calculated as total hours divided by days worked and average staff per day. 7.7 hours

Contractor staffing

Q4 2025 · Oct 1 – Dec 31 More info This data comes from the CMS Payroll-Based Journal report covering October 1 – December 31, 2025.

Total hours from contractors

12.5%

3,039 contractor hours this quarter

Certified Nursing Assistant: 31 Licensed Practical Nurse: 18 Registered Nurse: 14

Staff by category

Q4 2025 · Oct 1 – Dec 31 More info This data comes from the CMS Payroll-Based Journal report covering October 1 – December 31, 2025.
Certified Nursing Assistant35316611,24092100%7.7
Licensed Practical Nurse1218303,87792100%8.9
Registered Nurse1214263,07492100%8.9
Other Dietary Services Staff4041,27392100%7.1
Clinical Nurse Specialist3031,1137379%7.9
Administrator1015126470%8
Physical Therapy Assistant2024926975%7.1
Nurse Practitioner1014625964%7.8
Mental Health Service Worker1014485661%8
Respiratory Therapist2024486368%7.1
Therapeutic Recreation Specialist1014346672%6.6
Dietitian2022803538%8
Respiratory Therapy Technician1012574043%6.4
Qualified Activities Professional1012513336%7.6
RN Director of Nursing1011071415%7.7
Qualified Social Worker202291617%1.8
66 Certified Nursing Assistant
% of Days 100%
30 Licensed Practical Nurse
% of Days 100%
26 Registered Nurse
% of Days 100%
4 Other Dietary Services Staff
% of Days 100%
3 Clinical Nurse Specialist
% of Days 79%
1 Administrator
% of Days 70%
2 Physical Therapy Assistant
% of Days 75%
1 Nurse Practitioner
% of Days 64%
1 Mental Health Service Worker
% of Days 61%
2 Respiratory Therapist
% of Days 68%
1 Therapeutic Recreation Specialist
% of Days 72%
2 Dietitian
% of Days 38%
1 Respiratory Therapy Technician
% of Days 43%
1 Qualified Activities Professional
% of Days 36%
1 RN Director of Nursing
% of Days 15%
2 Qualified Social Worker
% of Days 17%

Penalties and fines

Federal penalties imposed by CMS for regulatory violations, including civil money penalties (fines) and denials of payment for new Medicare/Medicaid admissions.

Source: CMS Penalties Database

No penalties in the past 3 years

No civil money penalties or payment denials were reported in the last 3 years.

Quality of care over time

These measures show how residents usually do over time at this home, based on health outcomes and preventive care.

High-risk clinical events score Info A composite score based on pressure ulcers, falls with injury, weight loss, walking ability decline, and activities of daily living decline. 17.4
35% worse than State average

State average: 12.9

Functional decline score Info A composite score based on activities of daily living decline, walking ability decline, and incontinence. 30.9
20% worse than State average

State average: 25.7

Long-stay resident measures
Below average State avg: 3.7 Info CMS star rating based on long-stay quality measure performance. 5 stars = significantly above average, 1 star = significantly below average.
Need for Help with Daily Activities Increased Info Percent of long-stay residents whose need for help with daily activities has increased 32.4%
37% worse than State average

State average: 23.7%

Walking Ability Worsened Info Percent of long-stay residents whose ability to move independently worsened 38.5%
39% worse than State average

State average: 27.7%

Low Risk Residents with Bowel/Bladder Incontinence Info Percent of low risk long-stay residents who lose control of their bowels or bladder 21.8%
16% better than State average

State average: 25.9%

Falls with Major Injury Info Percent of long-stay residents experiencing one or more falls with major injury 2.0%
14% better than State average

State average: 2.3%

High Risk Residents with Pressure Ulcers Info Percent of long-stay high risk residents with pressure ulcers 9.0%
38% worse than State average

State average: 6.5%

Urinary Tract Infection Info Percent of long-stay residents with a urinary tract infection 0.0%
100% better than State average

State average: 1.6%

Lost Too Much Weight Info Percent of long-stay residents who lose too much weight 5.4%
8% better than State average

State average: 5.8%

Depressive Symptoms Info Percent of long-stay residents who have depressive symptoms 12.1%
40% better than State average

State average: 20.2%

Antipsychotic Use Info Percent of long-stay residents who received an antipsychotic medication 15.0%
16% worse than State average

State average: 12.9%

Pneumococcal Vaccine Info Percent of long-stay residents assessed and appropriately given the pneumococcal vaccine 94.6%
In line with State average

State average: 92.0%

Influenza Vaccine Info Percent of long-stay residents assessed and appropriately given the seasonal influenza vaccine 96.2%
In line with State average

State average: 96.6%

Hospitalizations per 1,000 days Info Number of hospitalizations per 1,000 long-stay resident days. 1.64
24% worse than State average

State average: 1.32

ED visits per 1,000 days Info Number of outpatient emergency department visits per 1,000 long-stay resident days. 1.28
6% worse than State average

State average: 1.21

Short-stay resident measures
Significantly below average State avg: 3.7 Info CMS star rating based on short-stay quality measure performance. 5 stars = much above average, 1 star = much below average.
Pneumococcal Vaccine Info Percent of short-stay residents assessed and appropriately given the pneumococcal vaccine 91.7%
17% better than State average

State average: 78.4%

Antipsychotic medication increase Info Percent of short-stay residents who newly received an antipsychotic medication 1.1%
19% better than State average

State average: 1.4%

Influenza Vaccine Info Percent of short-stay residents assessed and appropriately given the seasonal influenza vaccine 90.2%
12% better than State average

State average: 80.6%

Re-hospitalized after SNF stay Info Percentage of short-stay residents who were re-hospitalized after their nursing home admission. 27.4%
29% worse than State average

State average: 21.2%

Emergency department visits Info Percentage of short-stay residents who had an outpatient emergency department visit. 17.5%
77% worse than State average

State average: 9.9%

Falls with major injury Info Percentage of SNF residents who experience falls with major injury during their stay. 0.0%
100% better than State average

State average: 0.8%

Ability to care for self at discharge Info Percentage of residents at or above expected ability to care for themselves at discharge. 46.7%
13% worse than State average

State average: 53.7%

Successful return to home or community Info Rate of successful return to home or community from a skilled nursing facility. 40.1%
21% worse than State average

State average: 50.6%

Breakdown by payment type

Medicare

93% of new residents, usually for short-term rehab.

Typical stay 1 months

Private pay

5% of new residents, often for short stays.

Typical stay 8 - 9 months

Medicaid

1% of new residents, often for long-term daily care.

Typical stay 22 years

Facility Characteristics

Source: CMS Long-Term Care Facility Characteristics (Data as of Jan 2026)

Total residents 65
Medicare
13
20% of residents
Medicaid
40
61.5% of residents
Private pay or other
12
18.5% of residents
Programs & Services
Residents Group

Residents meet regularly to discuss policies, care quality, and activities

Active Resident Council

Organized group of residents that meets regularly to discuss facility policies, quality of life, and activities.

Finances and operations

Based on CMS SNF Cost Report for fiscal year ending in 12/2023.

For-profit
Operated by a single business entity.
Net patient revenue Info Net patient revenue — what the home actually collects for resident care, after contractual allowances, bad debt and discounts are subtracted from its gross charges (CMS cost report, Worksheet G-3). It covers resident care only; money the home earns from other sources is shown separately as "Other income."
$6.6M
Net patient income Info Net patient income: net patient revenue minus the home's total operating expenses. A positive figure means it earns more from resident care than it spends to deliver it; a negative figure means the opposite. It excludes non-operating "other income."
-$140.0K
For-profit Operated by a single business entity.
Net patient revenue Info Net patient revenue — what the home actually collects for resident care, after contractual allowances, bad debt and discounts are subtracted from its gross charges (CMS cost report, Worksheet G-3). It covers resident care only; money the home earns from other sources is shown separately as "Other income."
$6.6M
Net patient income Info Net patient income: net patient revenue minus the home's total operating expenses. A positive figure means it earns more from resident care than it spends to deliver it; a negative figure means the opposite. It excludes non-operating "other income."
-$140.0K
Other income Info Money the home earns outside of resident care — such as investments, grants, rentals and other non-operating sources (CMS cost report, Worksheet G-3). It is tracked separately from net patient revenue: it is not part of that figure, and it is not included in net patient income.
$596.5K
Payroll costs Info Staff salaries plus wage-related costs — benefits such as payroll taxes, health insurance and retirement — from the home's own accounting records (CMS cost report, Worksheet A). Contract or agency labor is counted separately, under other operating costs.
$4.1M 61.5% of net patient revenue Info Payroll as a share of revenue: staff salaries and wage-related benefits divided by net patient revenue. A higher figure means more of each revenue dollar goes to staff pay.
Other operating costs Info Everything it costs to run the home apart from payroll — food, utilities, supplies, maintenance, contract labor and administration. Calculated as total operating expense minus payroll (staff salaries and wage-related benefits).
$2.7M
Total costs Info The home's total operating expense for the year — all the costs of running it, salaries included (CMS cost report, Worksheet G-3).
$6.7M

Who this home usually serves

TYPE OF STAY

Mostly short-term rehab stays

Most residents typically stay for a few weeks or months before returning home or moving on.

Most new residents arrive under Medicare (93% of admissions), and a typical Medicare stay runs around 1 months.

Admissions
164 total

Coverage residents most often arrive under.

Medicare 93%
Private pay 5%
Medicaid 1%
Discharges
160 total

Coverage residents most often leave under.

Medicare 83%
Private pay 6%
Medicaid 11%

Places of interest near Harrison House of Snow Hill

Address 0.7 miles from city center Info Estimated distance in miles from Snow Hill's city center to Harrison House of Snow Hill's address, calculated via Google Maps. — 0.04 miles to nearest hospital (Tidal Health Medical Center)

Calculate Travel Distance to Harrison House of Snow Hill

Add your location

Address

Compare Nursing Homes around the area

The information below is reported by the Maryland Department of Health, Office of Health Care Quality.

Buckingham‘s Choice
NH
AL
MC
RC
SNF
Adamstown (Baker Circle) -42 - 3 1 Bed
Edenwald Senior Living
NH
AL
IL
MC
SNF
Towson (Southerly Road) -94 A+ 83 1 Bed / 2 Bed
Sterling Care Hillhaven Assisted Living and Memory Care
NH
AL
HOS
MC
SNF
Adelphi (Knollwood) -66 - 25 Studio / 1 Bed
Friends House Retirement Community
NH
AL
IL
SNF
Sandy Spring -24 - 6 -
Harrison House of Snow Hill
NH
HOS
MC
Snow Hill -69 - 21 -

Frequently Asked Questions about Harrison House of Snow Hill

What neighborhood is Harrison House of Snow Hill in?

Harrison House of Snow Hill is in the Snow Hill neighborhood.

Is Harrison House of Snow Hill in a walkable area?

Harrison House of Snow Hill has a walk score of 21. Car-dependent. Most errands require a car, with limited nearby walkable options.

What is the occupancy rate at Harrison House of Snow Hill?

Harrison House of Snow Hill's occupancy is 80.9%.

Does Harrison House of Snow Hill operate as a for-profit or non-profit?

Harrison House of Snow Hill is registered as a for-profit.

Are there photos of Harrison House of Snow Hill?

Yes — there are 4 photos of Harrison House of Snow Hill in the photo gallery on this page.

What is the address of Harrison House of Snow Hill?

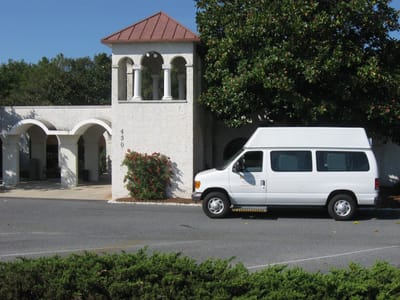
Harrison House of Snow Hill is located at 430 W Market St, Snow Hill, MD 21863.

What is the phone number of Harrison House of Snow Hill?

(410) 632-3755 will put you in contact with the team at Harrison House of Snow Hill.

Guides for Better Senior Living

Care Cost Calculator: See Prices in Your Area

Nursing Home Data Explorer

Don’t Wait Too Long: 7 Red Flag Signs Your Parent Needs Assisted Living Now

The True Cost of Assisted Living in 2025 – And How Families Are Paying For It

Understanding Senior Living Costs: Pricing Models, Discounts & Financial Assistance