Zebulon Rehabilitation Center

Nursing Home in Raleigh

CMS overall rating Info The Overall CMS Rating is scored from 1 to 5 stars and combines results from health inspections, staffing levels, and quality measures. Health inspections carry the most weight. Staffing and quality scores can increase or decrease the final rating based on performance compared to state and national standards.

Overview of Zebulon Rehabilitation Center

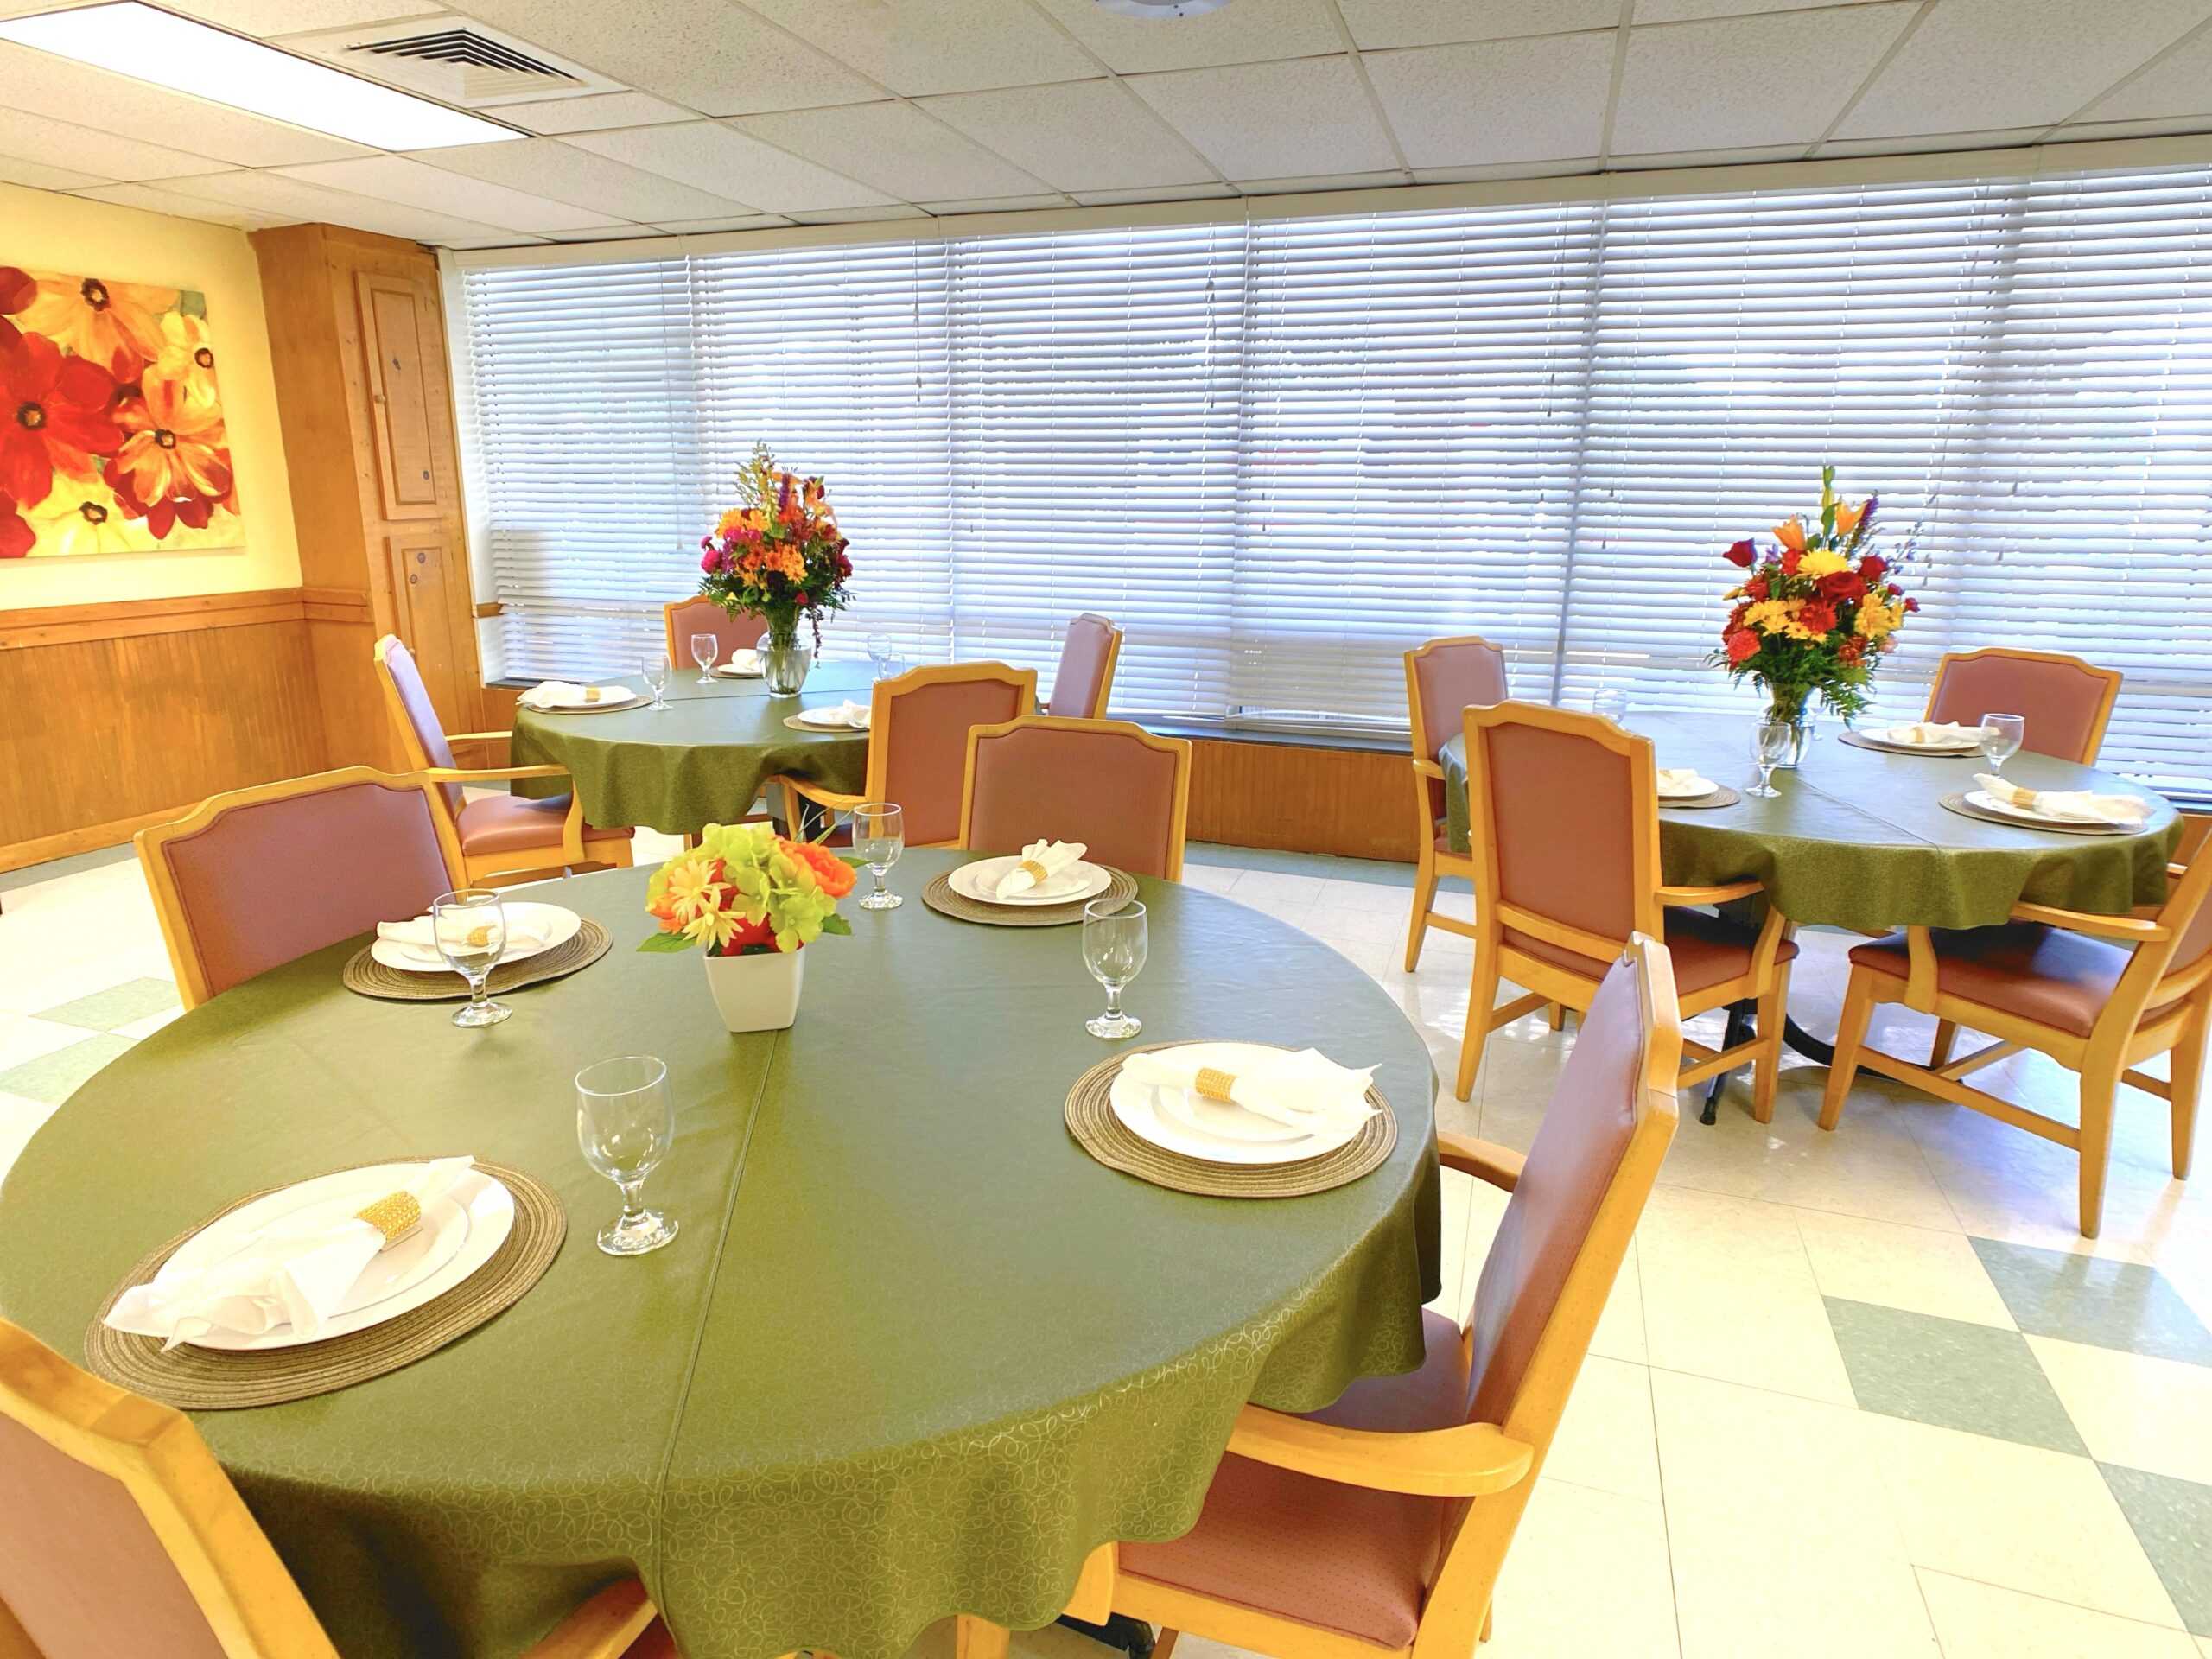
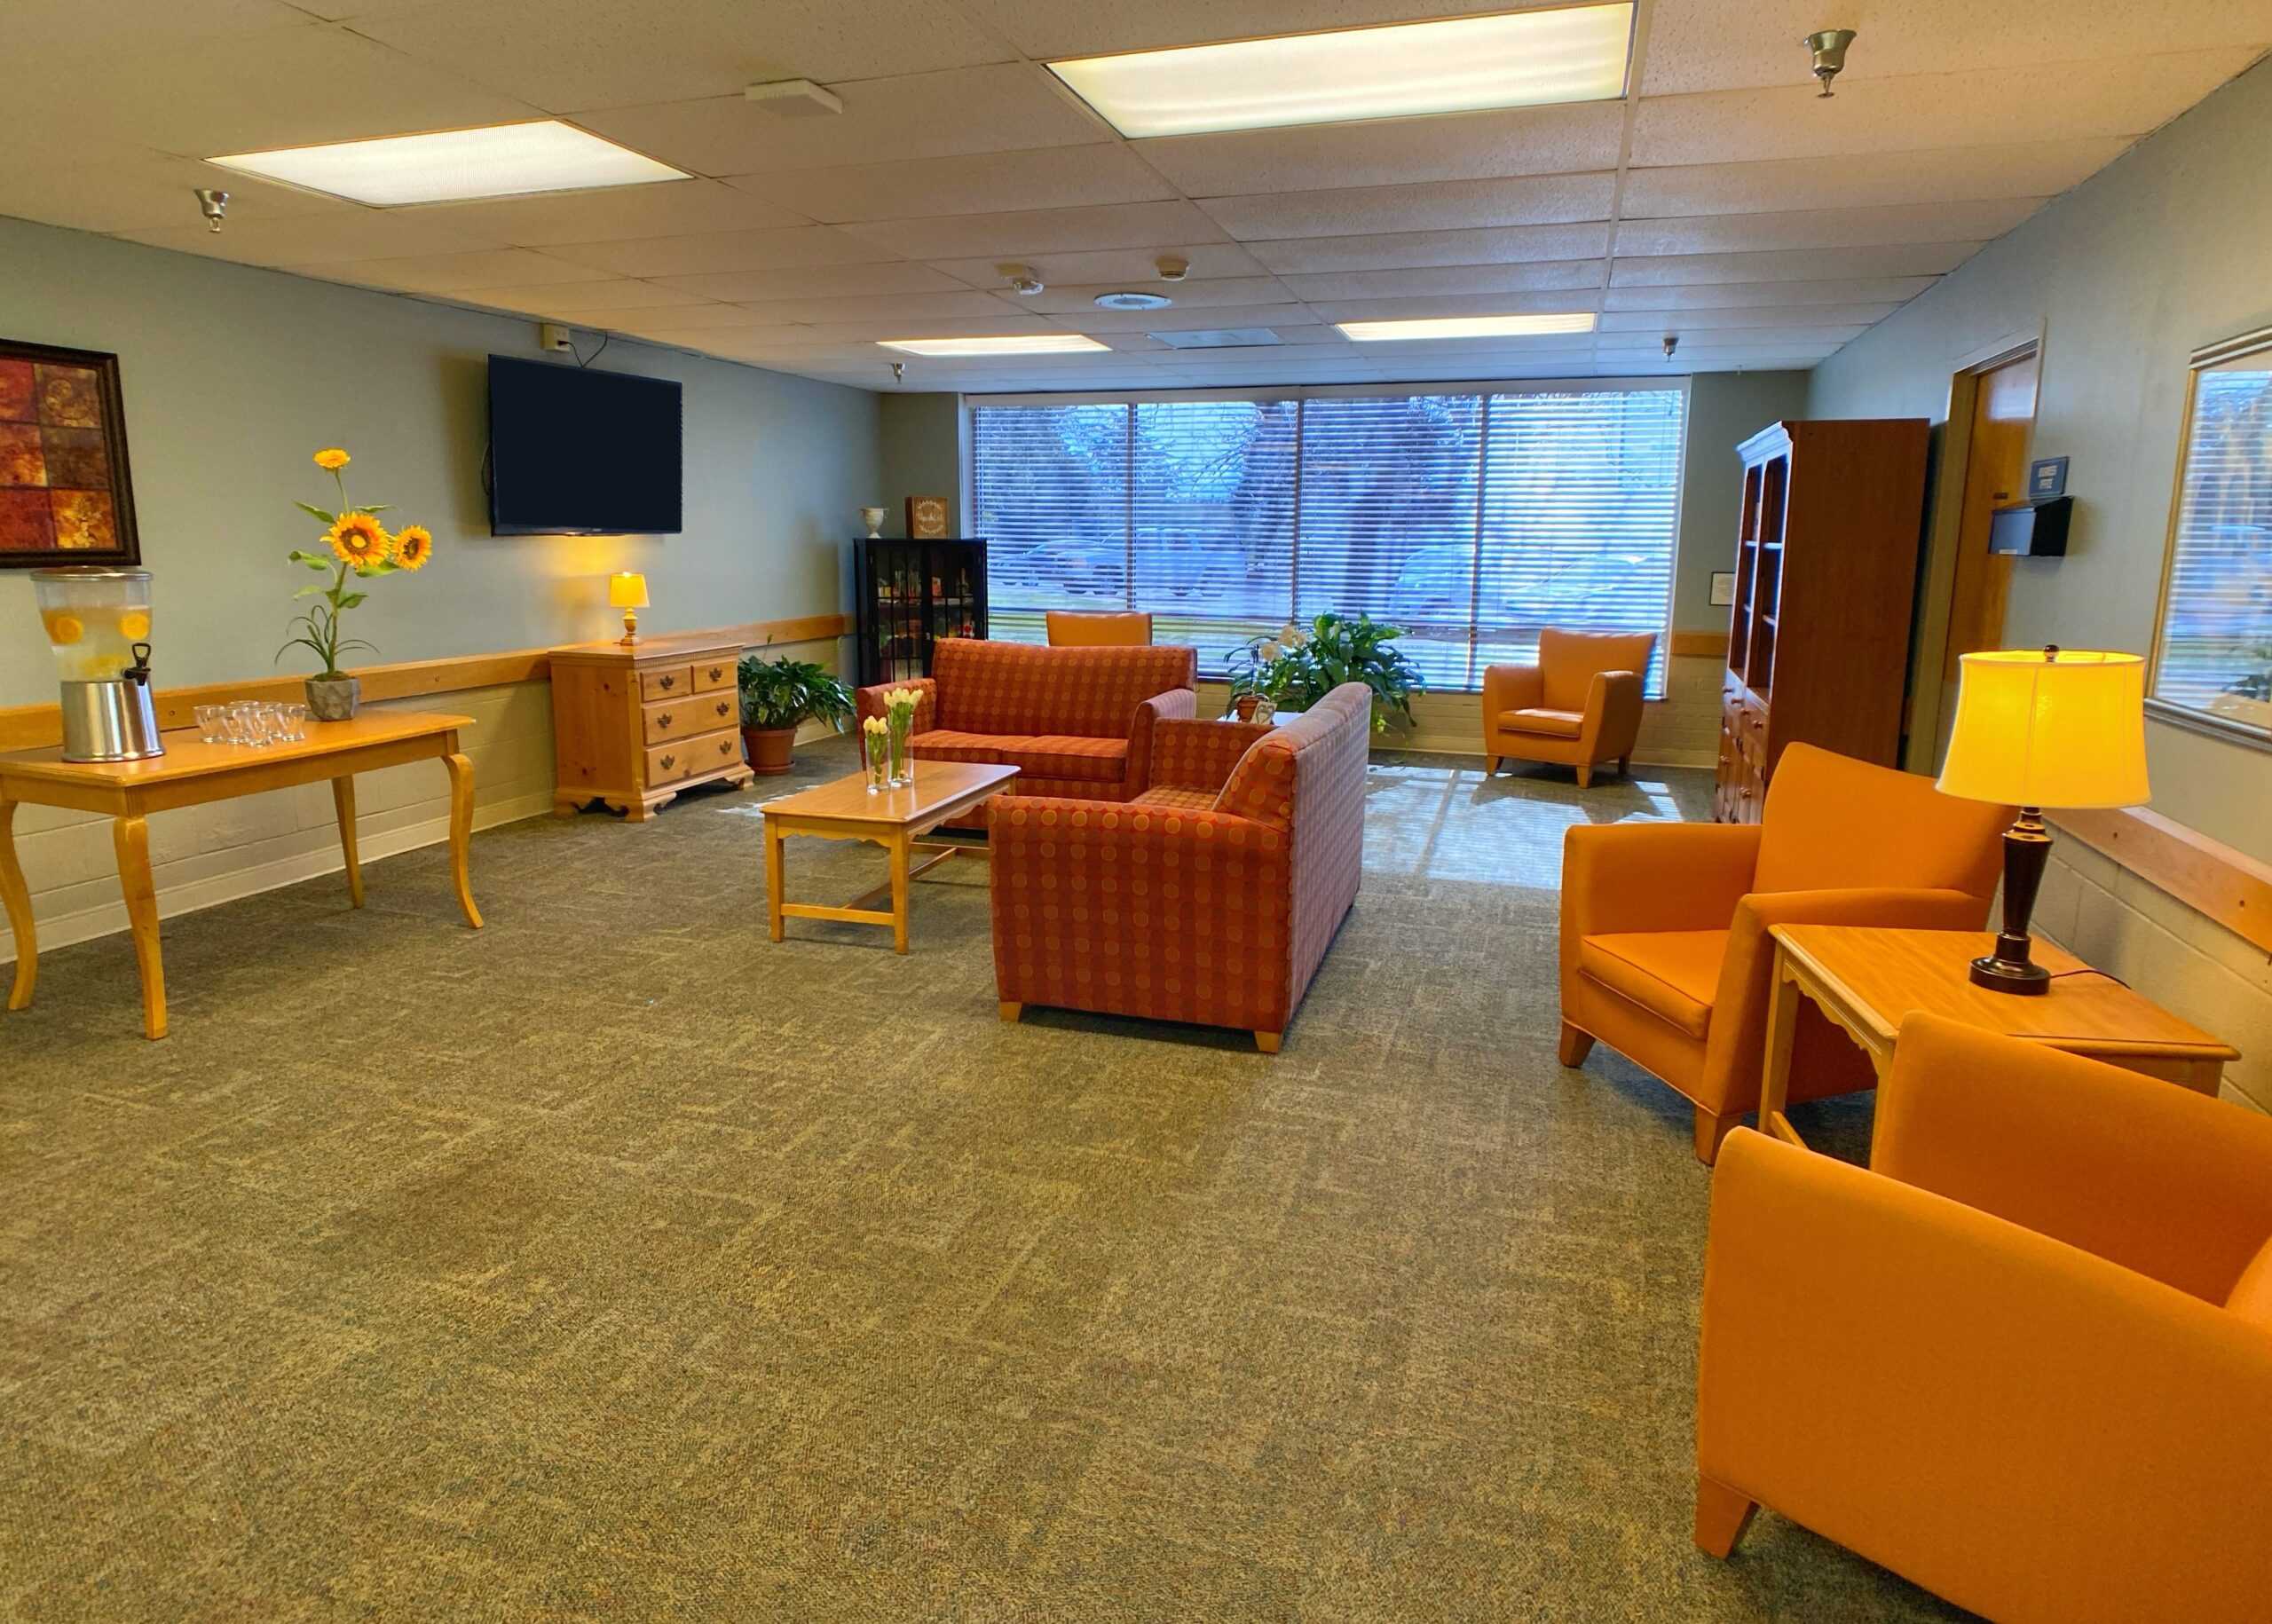
Zebulon Rehabilitation Center prides itself on its exceptional staff who genuinely cares about the well-being of its residents. They offer short-term and residential inpatient stays and are committed to providing high-quality care. Their team of physicians and specialists delivers a comprehensive range of services, including enteral and infusion therapy, dietary counseling, and social and pastoral care, among others.

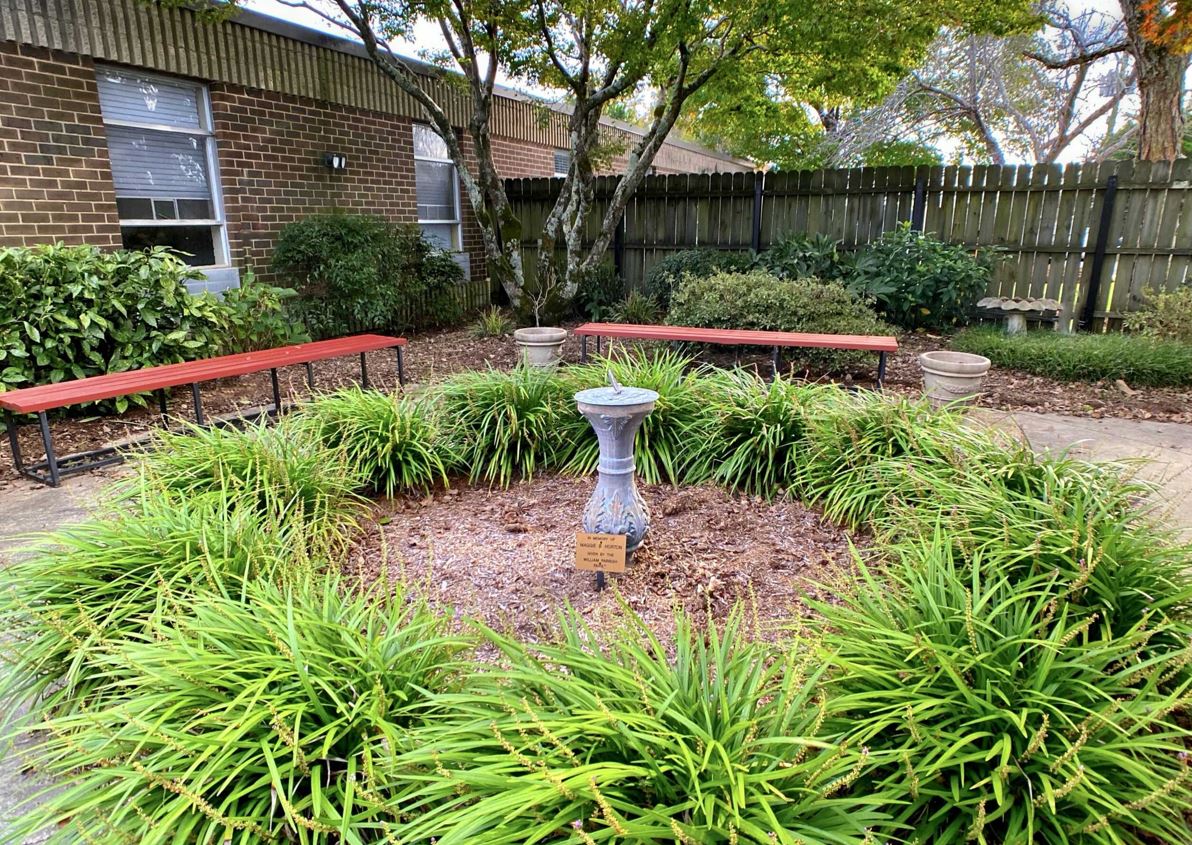
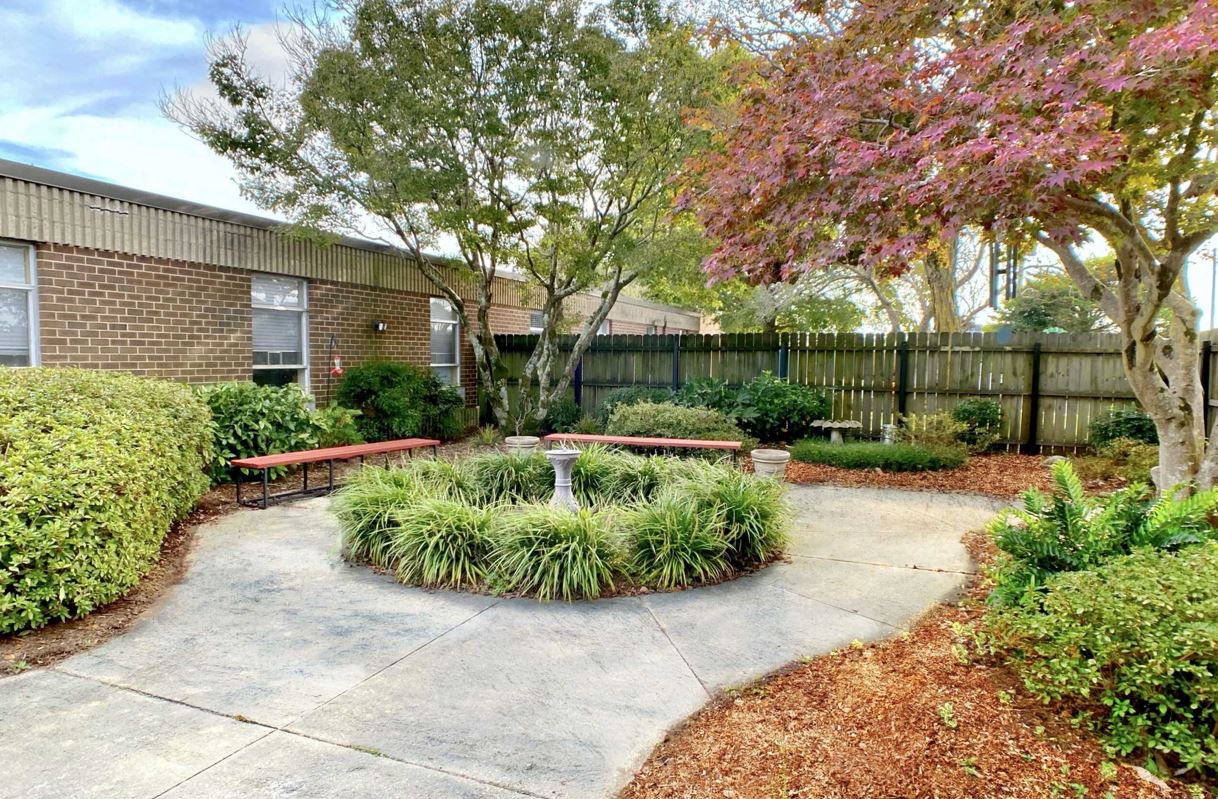
Seniors have access to their tranquil courtyard and beautifully landscaped grounds, which are open seven days a week for admission. The center’s outdoor areas are spacious and provide an ideal setting for patients to relax and find peace during their recovery process. Moreover, they use state-of-the-art telemedicine technology to provide top-quality care to senior patients. Zebulon Rehabilitation Center’s ultimate goal is to provide its patients with a sense of relief and comfort, knowing they are receiving the best possible care in all aspects. 

(919) 269-9621

Managed by Paul Jordan

Administrator

The community administrator at Zebulon Rehabilitation Center is recognized for providing a clean, safe, and homey environment while ensuring professional clinical care. The administrator is actively engaged with residents and families, offering updates and support to ensure comfort and contentment throughout their stay.

Quality ratings

Measured by Centers for Medicare & Medicaid Services (CMS)

Overall rating Info The Overall CMS Rating combines results from health inspections, staffing levels and quality measures. Health inspections carry the most weight. Staffing and quality scores can increase or decrease the final rating based on performance compared to state and national standards.
3/5 ▲ 0.2 North Carolina average: 2.8/5
Health Inspection Info Based on the results of the facility's three most recent standard inspections and any complaint investigations. CMS reviews the number, scope, and severity of deficiencies, with more recent findings weighted more heavily.
4/5 ▲ 1.2 North Carolina average: 2.8/5
Staffing Info Measures average nursing staff hours per resident per day, including Registered Nurses (RNs) and total nursing staff. Ratings are adjusted based on the level of care residents require and are compared to state and national benchmarks.
1/5 ▼ 1.7 North Carolina average: 2.7/5
Quality Measures Info Based on clinical and physical health indicators reported to CMS, such as hospital readmissions, falls, pressure ulcers, and improvements in mobility. These measures reflect how well residents' health needs are being managed.
4/5 ▲ 0.8 North Carolina average: 3.2/5

Staffing hours breakdown

Info Daily nursing hours per resident by staff type, reported to CMS. Higher is generally better — compare this facility to state and national averages to see where staffing stands.

Hours per resident per day — compared to North Carolina state averages

Total nursing care / resident Info This home is ranked 70th out of 76 homes in North Carolina.

Total adjusted nursing hours per resident per day, combining RN, LPN, and aide time. CMS adjusts this for case-mix so facilities can be fairly compared.
3h 14m per day
Rank #70 / 76Nurse hours — state benchmarkedThis home is ranked 70th out of 76 homes in North Carolina.Shows adjusted nurse hours per resident per day benchmarked to the North Carolina average, with a ranking across 76 North Carolina SNFs. More hours mean more direct care. The national average is about 3.5 hrs; below 3.0 is a red flag.
This facility North Carolina avg (3h 59m per day)
vs North Carolina avg
-19%

4 of 5 metrics below state avg

Standout metric Physical Therapist is +260% above state avg
Staff typeHours / dayvs state avg
Registered Nurse (RN) Info RNs hold the highest nursing license and can assess residents, interpret test results, and direct care plans. More RN hours per day often signals stronger clinical oversight and faster response to health changes. 24m per day ▼ 31% State avg: 35m per day · National avg: 41m per day
Nurse Aide Info Certified Nurse Aides (CNAs) provide the most direct day-to-day assistance: bathing, dressing, feeding, and mobility. Nurse aide hours are typically the largest staffing category and directly affect residents' quality of life. 2h 4m per day ▼ 11% State avg: 2h 19m per day · National avg: 2h 21m per day
Total Nursing (Weekend) Info Combined nursing hours (RN + LPN + Nurse Aide) per resident per day on weekends. Staffing often drops on weekends — this figure reveals whether the facility maintains adequate coverage outside of weekday hours. 3h 8m per day ▼ 6% State avg: 3h 20m per day · National avg: 3h 26m per day
Physical Therapist Info Hours per resident per day provided by licensed Physical Therapists (PTs) or PT Assistants. PT services help residents recover mobility after injury or illness and are especially important for post-acute (short-stay) rehabilitation. 18m per day ▲ 260% State avg: 5m per day · National avg: 4m per day
RN (Weekend) Info Registered nurse hours specifically on weekends. Facilities sometimes reduce RN presence on Saturdays and Sundays — a low weekend RN figure compared to weekday hours can indicate reduced clinical oversight when most administrative staff are absent. 11m per day ▼ 52% State avg: 23m per day · National avg: 29m per day

Capacity and availability

This home usually has limited availability

Occupancy between 85% and 95% suggests balanced demand.

Higher occupancy than the North Carolina average: 76.4%
Occupancy rate 92.3% Rank #6 / 82Occupancy rate — state benchmarkedThis home is ranked 6th out of 82 homes in North Carolina.Shows this facility's occupancy rate versus the North Carolina average, with its statewide rank out of 82. Higher occupancy signals strong local demand and financial stability.
Avg. Length of Stay 68 days
Occupancy rate
92.3% Rank #6 / 82Occupancy rate — state benchmarkedThis home is ranked 6th out of 82 homes in North Carolina.Shows this facility's occupancy rate versus the North Carolina average, with its statewide rank out of 82. Higher occupancy signals strong local demand and financial stability.
Avg. Length of Stay
68 days

Who this home usually serves

TYPE OF STAY

Mix of rehab and long-term care

This home supports both short-term rehab and long-term care, with residents staying for a wide range of durations.

Breakdown by payment type

Medicare

45% of new residents, usually for short-term rehab.

Typical stay 1 months

Private pay

50% of new residents, often for short stays.

Typical stay 1 - 2 months

Medicaid

6% of new residents, often for long-term daily care.

Typical stay 1 - 2 years

Finances and operations

Privately-owned community
Operated by a business corporation.
Home revenue
$9.8M
Profit
$1.0M
Privately-owned community Operated by a business corporation.
Home revenue
$9.8M Rank #68 / 83Revenue — state benchmarkedThis home is ranked 68th out of 83 homes in North Carolina.Shows this facility's annual revenue compared to the North Carolina SNF average. Higher revenue generally means more resources for staffing and capital — read alongside Payroll %.
Profit
$1.0M
Payroll costs Info The portion of the home's budget spent on staff, including nurses, caregivers, and other employees who support care and operations. Rank #73 / 83Payroll — state benchmarkedThis home is ranked 73rd out of 83 homes in North Carolina.Shows total annual staff payroll benchmarked to the North Carolina average. Higher payroll investment relative to peers often signals better staffing and less reliance on cheaper contract labor.
$3.3M
34.1% of revenue Rank #52 / 83Payroll % — state benchmarkedThis home is ranked 52nd out of 83 homes in North Carolina.Shows payroll as a percentage of revenue versus the North Carolina average. Well-run SNFs often land around 55–65%. Below 25% may signal understaffing or heavy agency use — read with Staffing ratings.
Other operating costs Info All remaining costs needed to run the home, such as food, utilities, building maintenance, supplies and administrative expenses.
$5.4M
Total costs $8.8M
Walk Score
Walk Score: 50 / 100 Rank #10 / 70Walk Score — state benchmarkedThis home is ranked 10th out of 70 homes in North Carolina.Shows how walkable this facility's neighborhood is compared to the average Walk Score across North Carolina SNFs. Higher scores benefit residents, families, and staff.
Moderately walkable. Some errands can be accomplished on foot, with a mix of nearby amenities.

About this community

License Details

AwardsU.S. News & World Report Best Nursing Homes 2024 – Short Term Rehab, U.S. News & World Report Best Nursing Homes 2025 – Short Term Rehab, 2025 Bronze – Commitment to Quality Award, U.S. News & World Report Best Nursing Homes 2026 – Short Term Rehab

Payment & Insurance

2 services
Accept Medicaid
Accept Medicare

Therapy & Rehabilitation

3 services
Rehabilitation Services
Respite Care
Short-Term Rehab

Staffing & Medical

1 service
24-Hour Staffing

Additional Services

4 services
Short-Term Stay
In-Patient Residential Stay
Out-Patient Rehabilitation Services
Specialty Programs

Amenities & Lifestyle

Private/Semi Private Rooms
Admissions 7 Days Per Week
Landscaped Grounds
Therapy Up To 7 Days Per Week
Activities
Rehabilitation Gym
Dining Areas
Laundry Services
Courtyard
Library
Indoor/Outdoor Common Areas
Phone/Cable Tv Service
Newspaper Delivery
Specific ProgramsPost COVID-19 Recovery Programs, Telemedicine, Out-Patient Therapy, Physical Therapy, Occupational Therapy, Speech Therapy, Respiratory Care
Operating Hours24/7

Types of Care at Zebulon Rehabilitation Center

Skilled Nursing

Contact Zebulon Rehabilitation Center

Health Inspection History

Inspections
Total health inspections 3

North Carolina average 4


Last Health inspection on Jul 2025

Total health citations
11 Rank #27 / 81Health citations — state benchmarkedThis home is ranked 27th out of 81 homes in North Carolina.Shows this facility's total health deficiency citations benchmarked to the North Carolina state average, with a ranking across all 81 NC SNFs. Lower citation counts earn a better rank.

North Carolina average 20.9

Citations per inspection
3.67

North Carolina average 4.99


Health citations are formal notices following inspections when they fail to comply with safety and care standards.

All 11 citations resulted from standard inspections.

Breakdown of citation severity (last 3 years)
Critical Health citations More info
0
100% better than North Carolina average

North Carolina average: 1.3


Serious Health citations More info 0
100% better than North Carolina average

North Carolina average: 0.9

0 critical citations More info North Carolina average: 1.3

0 serious citations More info North Carolina average: 0.9

10 moderate citations More info North Carolina average: 17.1

1 minor citation More info North Carolina average: 1.6
Citations history (last 3 years)
Pharmacy moderate citation Info Issues related to medication management, including how drugs are stored, administered, and monitored. Jul 24, 2025
Corrected

Care Planning moderate citation Info Issues related to creating and updating personalized care plans for residents based on their needs and conditions. Jul 24, 2025
Corrected

Care Planning moderate citation Info Issues related to creating and updating personalized care plans for residents based on their needs and conditions. Jun 27, 2024
Corrected

Resident Rights moderate citation Info Issues related to resident's rights, including dignity, privacy, and the ability to make decisions about their care. Jun 27, 2024
Corrected

Compare Nursing Homes around Raleigh The information below is reported by the North Carolina Department of Health and Human Services, Division of Health Service Regulation.

5 facilities compared · CMS & NC Dept. of Health data · Updated Apr 2026

Filter by care type
College Pines Health and Rehabilitation Center
AL

Assisted Living A licensed, long-term care setting for seniors or individuals with disabilities who need help with daily activities — like bathing, dressing, and medication management — but not 24-hour skilled nursing. Offers housing, meals, and around-the-clock support while aiming to maximize resident independence.

NH

Nursing Home Licensed facility providing 24/7 skilled nursing care for residents with complex, ongoing medical needs. Staffed by RNs, LPNs, and CNAs. Inspected and star-rated annually by CMS. Accepts Medicare (short-term rehab) and Medicaid (long-term care).

Connelly Springs (Locust Street)104 88.6% +16%3.98 -2%0%242.0292- 6 -$15.2M$5.2M34.1%345446
Capital Nursing And Rehabilitation Center
AL

Assisted Living A licensed, long-term care setting for seniors or individuals with disabilities who need help with daily activities — like bathing, dressing, and medication management — but not 24-hour skilled nursing. Offers housing, meals, and around-the-clock support while aiming to maximize resident independence.

HC

Home Care Professional care delivered in the person's own home — from companionship and errands to skilled nursing and therapy. Allows seniors to age in place. Medicare covers skilled home health when medically necessary.

IL

Independent Living Lifestyle-focused communities for older adults offering dining, activities, and transportation with minimal personal care. Best for active, independent seniors who want community without medical support.

NH

Nursing Home Licensed facility providing 24/7 skilled nursing care for residents with complex, ongoing medical needs. Staffed by RNs, LPNs, and CNAs. Inspected and star-rated annually by CMS. Accepts Medicare (short-term rehab) and Medicaid (long-term care).

Raleigh (East Raleigh)125 75.9% -1%3.43 -16%-14%0142.80100B- 43 Liberty Commons Nursing And Rehabilitation Center Of Wake County, Llc$13.9M$5.4M38.7%345202
Hillcrest Raleigh At Crabtree Valley
AL

Assisted Living A licensed, long-term care setting for seniors or individuals with disabilities who need help with daily activities — like bathing, dressing, and medication management — but not 24-hour skilled nursing. Offers housing, meals, and around-the-clock support while aiming to maximize resident independence.

NH

Nursing Home Licensed facility providing 24/7 skilled nursing care for residents with complex, ongoing medical needs. Staffed by RNs, LPNs, and CNAs. Inspected and star-rated annually by CMS. Accepts Medicare (short-term rehab) and Medicaid (long-term care).

Raleigh (North Hills)134 73.7% -4%4.27 +34%+7%1126.01100A+ 31 Hillcrest Convalescent Center, Inc.$21.6M$6.5M30.1%345555
Zebulon Rehabilitation Center
NH

Nursing Home Licensed facility providing 24/7 skilled nursing care for residents with complex, ongoing medical needs. Staffed by RNs, LPNs, and CNAs. Inspected and star-rated annually by CMS. Accepts Medicare (short-term rehab) and Medicaid (long-term care).

AL

Assisted Living A licensed, long-term care setting for seniors or individuals with disabilities who need help with daily activities — like bathing, dressing, and medication management — but not 24-hour skilled nursing. Offers housing, meals, and around-the-clock support while aiming to maximize resident independence.

Zebulon (West Gannon Avenue)60 92.3% +21%3.24 -40%-19%0113.7057- 50 Skillen, Gabriella$9.8M$3.3M34.1%345104
Hayes Barton Place -
AL

Assisted Living A licensed, long-term care setting for seniors or individuals with disabilities who need help with daily activities — like bathing, dressing, and medication management — but not 24-hour skilled nursing. Offers housing, meals, and around-the-clock support while aiming to maximize resident independence.

IL

Independent Living Lifestyle-focused communities for older adults offering dining, activities, and transportation with minimal personal care. Best for active, independent seniors who want community without medical support.

MC

Memory Care Secured, specialized care for people living with Alzheimer's or dementia. Staff trained in cognitive impairment, with higher staff-to-resident ratios and an environment designed to reduce confusion and wandering risk.

NH

Nursing Home Licensed facility providing 24/7 skilled nursing care for residents with complex, ongoing medical needs. Staffed by RNs, LPNs, and CNAs. Inspected and star-rated annually by CMS. Accepts Medicare (short-term rehab) and Medicaid (long-term care).

Raleigh (Five Points)---------000.00-- 59 -----

Financial Assistance for
Nursing Home in North Carolina

Get Financial aid guidance

Community Alternatives Program for Disabled Adults

NC Medicaid CAP/DA

Age 65+ or disabled
General North Carolina resident, Medicaid- eligible, nursing home-level care need.
Income Limits (2025) ~$2,829/month 300% FBR, individual
Asset Limits $2,000 (individual), $3,000 (couple).
NC

High demand; waitlists common in urban areas.

Benefits
Personal care (5-7 hours/day) Respite (240 hours/year) Adult day care ($60/day) Home modifications ($1,500 avg.)

North Carolina Senior Care Options

NC SCO (via NFCSP)

Age Caregiver of someone 60+ (or with dementia)
General North Carolina resident.
Income Limits No strict limit; prioritizes low-income.
Asset Limits Not applicable.
NC

Limited slots; rural/urban balance.

Benefits
In-home respite (4-6 hours/day) Adult day care (~$60/day) Short-term facility care (up to 5 days)

Program of All-Inclusive Care for the Elderly (PACE)

North Carolina PACE (e.g., PACE of the Triad)

Age 55+
General NC resident (specific counties), NFLOC, safe with PACE support.
Income Limits (2025) ~$2,829/month (Medicaid-eligible); private pay option available.
Asset Limits $2,000 (individual), $3,000 (couple) for Medicaid enrollees.
NC

Available in 10+ counties (e.g., Guilford, Wake); multiple providers (e.g., PACE of the Southern Piedmont).

Benefits
Personal care (5-7 hours/day) Medical care Meals Transportation Respite Therapies

In-Home Aide Services

North Carolina In-Home Aide Services

Age 60+
General NC resident, unable to perform 1+ ADL, at risk of nursing home placement.
Income Limits (2025) No strict cap; prioritizes low-income ~$24,980/year
Asset Limits Not assessed; need-based.
NC

Family can be aides; varies by county funding.

Benefits
Personal care (5-20 hours/week) Meal prep Respite (~5 days/year) Errands

Medicare Savings Program (MSP)

North Carolina Medicare Savings Program

Age 65+ or disabled
General NC resident, Medicare Part A/B.
Income Limits (2025) ~$2,510/month (QMB), ~$3,380/month (SLMB), ~$3,598/month (QI)—individual.
Asset Limits $9,430 (individual), $14,130 (couple).
NC

Three tiers; no waitlist; includes Extra Help for Part D.

Benefits
Covers Part B premiums ($174.70/month) Deductibles ($240/year) Copays (~20%)

Low-Income Energy Assistance Program (LIHEAP)

North Carolina LIHEAP

Age 60+ prioritized
General NC resident, low-income household.
Income Limits (2025) ~$3,970/month individual, 185% FPL
Asset Limits Not assessed; income-focused.
NC

Covers oil, gas, electric; emergency aid via Crisis Intervention Program (CIP).

Benefits
Heating/cooling aid ($300-$1,000/season) Emergency fuel ($600 max via CIP)

Senior Community Service Employment Program (SCSEP)

North Carolina SCSEP

Age 55+
General unemployed, low-income, NC resident.
Income Limits (2025) ~$1,983/month 125% FPL
Asset Limits Not specified; income-focused.
NC

Priority for veterans, rural residents; AARP partnership.

Benefits
Paid training (~20 hours/week at ~$7.25/hour) Job placement

VA Aid and Attendance (A&A) and Housebound Benefits

North Carolina VA Aid and Attendance/Housebound

Age 65+ or disabled veteran/spouse
General NC resident, wartime service, need for ADL help (A&A) or homebound.
Income Limits (2025) Net income < ~$1,984/month (veteran with dependent, A&A); pension offsets income.
Asset Limits ~$155,356 net worth limit
NC

High veteran demand in rural/urban areas.

Benefits
Cash (~$1,433-$2,642/month veteran, ~$951-$1,318 spouse) for care costs (e.g., in-home, assisted living)

Urgent Repair Program (URP)

North Carolina Urgent Repair Program

Age 60+ prioritized
General NC resident, homeowner, low-income.
Income Limits (2025) ~$30,258/year 50% AMI, varies by county
Asset Limits Not strictly assessed; home value considered.
NC

Forgivable at $2,000/year; statewide via local partners.

Benefits
Repairs (~$8,000-$12,000 avg.) for safety (e.g., roofs, heating, accessibility)

State/County Special Assistance (SA)

North Carolina Special Assistance

Age 65+ (or disabled)
General NC resident, in licensed adult care home, low-income.
Income Limits (2025) ~$1,255/month (individual, 100% FPL); varies by facility rate.
Asset Limits $2,000 individual
NC

Covers assisted living; counties supplement state funds.

Benefits
Cash (~$1,200-$1,500/month) for room/board; Medicaid covers care services

Places of interest near Zebulon Rehabilitation Center

Address 23.3 miles from city center Info Estimated distance in miles from Zebulon's city center to Zebulon Rehabilitation Center's address, calculated via Google Maps. — 10.36 miles to nearest hospital (UNC Pediatrics at Knightdale)

Calculate Travel Distance to Zebulon Rehabilitation Center

Add your location

Address

Staffing Data (Q2 2025)

This data corresponds to Q2 2025 and is based on CMS Payroll-Based Journal.

Total staff 92
Employees 90
Contractors 2
Staff to resident ratio 1.80:1
0% compared with North Carolina average

North Carolina average ratio: 1.85:1

Avg staff/day 35
Average shift 7.2 hours
10% worse than North Carolina average

North Carolina average: 8 hours

Total staff hours (quarter) 23,090
Nursing staff breakdown
Registered Nurse

Manages medical care and health needs.

Total count 5
Average shift length Info Average shift length. Calculated as total hours divided by days worked and average staff per day. 6.7 hours

No contractors work on this role.

Licensed Practical Nurse

Assists with medical care and medications.

Total count 15
Average shift length Info Average shift length. Calculated as total hours divided by days worked and average staff per day. 8.1 hours

No contractors work on this role.

Certified Nursing Assistant

Helps with daily care and mobility.

Total count 40
Average shift length Info Average shift length. Calculated as total hours divided by days worked and average staff per day. 7.5 hours

No contractors work on this role.

Contractor staffing

Total hours from contractors

0.5%

121 contractor hours this quarter

Occupational Therapy Aide: 2
Staff by category
Certified Nursing Assistant4004010,32991100%7.5
Licensed Practical Nurse150155,62591100%8.1
Respiratory Therapy Technician8081,4337785%7.4
Physical Therapy Assistant3031,0648593%6
Registered Nurse5057688290%6.7
Occupational Therapy Aide1235726066%7.6
Dietitian1015116268%8.2
Speech Language Pathologist6065076875%5.8
Nurse Practitioner1015026268%8.1
Mental Health Service Worker1014445662%7.9
Physical Therapy Aide2024186571%6.4
Administrator1014045156%7.9
Qualified Social Worker4043686774%5.4
Clinical Nurse Specialist2021465358%2.5
40 Certified Nursing Assistant
% of Days 100%
15 Licensed Practical Nurse
% of Days 100%
8 Respiratory Therapy Technician
% of Days 85%
3 Physical Therapy Assistant
% of Days 93%
5 Registered Nurse
% of Days 90%
3 Occupational Therapy Aide
% of Days 66%
1 Dietitian
% of Days 68%
6 Speech Language Pathologist
% of Days 75%
1 Nurse Practitioner
% of Days 68%
1 Mental Health Service Worker
% of Days 62%
2 Physical Therapy Aide
% of Days 71%
1 Administrator
% of Days 56%
4 Qualified Social Worker
% of Days 74%
2 Clinical Nurse Specialist
% of Days 58%

Facility Characteristics

Source: CMS Long-Term Care Facility Characteristics (Data as of Jan 2026)

Total residents 51
Medicare
20
39.2% of residents
Medicaid
29
56.9% of residents
Private pay or other
2
3.9% of residents
Programs & Services
Residents Group

Residents meet regularly to discuss policies, care quality, and activities

Active Resident Council

Organized group of residents that meets regularly to discuss facility policies, quality of life, and activities.

Quality of care over time

These measures show how residents usually do over time at this home, based on health outcomes and preventive care.

High-risk clinical events score Info A composite score based on pressure ulcers, falls with injury, weight loss, walking ability decline, and activities of daily living decline. 10.2
11% better than North Carolina average

North Carolina average: 11.5

Functional decline score Info A composite score based on activities of daily living decline, walking ability decline, and incontinence. 20.3
In line with North Carolina average

North Carolina average: 20.6

Long-stay resident measures
Average North Carolina avg: 2.9 Info CMS star rating based on long-stay quality measure performance. 5 stars = significantly above average, 1 star = significantly below average.
Need for Help with Daily Activities Increased Info Percent of long-stay residents whose need for help with daily activities has increased 8.6%
51% better than North Carolina average

North Carolina average: 17.5%

Walking Ability Worsened Info Percent of long-stay residents whose ability to move independently worsened 19.6%
16% better than North Carolina average

North Carolina average: 23.3%

Low Risk Residents with Bowel/Bladder Incontinence Info Percent of low risk long-stay residents who lose control of their bowels or bladder 32.7%
53% worse than North Carolina average

North Carolina average: 21.4%

Falls with Major Injury Info Percent of long-stay residents experiencing one or more falls with major injury 3.6%
In line with North Carolina average

North Carolina average: 3.6%

High Risk Residents with Pressure Ulcers Info Percent of long-stay high risk residents with pressure ulcers 11.8%
88% worse than North Carolina average

North Carolina average: 6.3%

Urinary Tract Infection Info Percent of long-stay residents with a urinary tract infection 2.2%
18% better than North Carolina average

North Carolina average: 2.6%

Lost Too Much Weight Info Percent of long-stay residents who lose too much weight 7.3%
In line with North Carolina average

North Carolina average: 7.4%

Depressive Symptoms Info Percent of long-stay residents who have depressive symptoms 13.6%
210% worse than North Carolina average

North Carolina average: 4.4%

Antipsychotic Use Info Percent of long-stay residents who received an antipsychotic medication 9.9%
26% better than North Carolina average

North Carolina average: 13.4%

Pneumococcal Vaccine Info Percent of long-stay residents assessed and appropriately given the pneumococcal vaccine 100.0%
9% better than North Carolina average

North Carolina average: 91.6%

Influenza Vaccine Info Percent of long-stay residents assessed and appropriately given the seasonal influenza vaccine 100.0%
6% better than North Carolina average

North Carolina average: 94.1%

Hospitalizations per 1,000 days Info Number of hospitalizations per 1,000 long-stay resident days. 3.15
78% worse than North Carolina average

North Carolina average: 1.77

ED visits per 1,000 days Info Number of outpatient emergency department visits per 1,000 long-stay resident days. 2.55
40% worse than North Carolina average

North Carolina average: 1.82

Short-stay resident measures
Above average North Carolina avg: 2.7 Info CMS star rating based on short-stay quality measure performance. 5 stars = much above average, 1 star = much below average.
Pneumococcal Vaccine Info Percent of short-stay residents assessed and appropriately given the pneumococcal vaccine 98.9%
24% better than North Carolina average

North Carolina average: 79.9%

Antipsychotic medication increase Info Percent of short-stay residents who newly received an antipsychotic medication 0.5%
66% better than North Carolina average

North Carolina average: 1.5%

Influenza Vaccine Info Percent of short-stay residents assessed and appropriately given the seasonal influenza vaccine 96.4%
23% better than North Carolina average

North Carolina average: 78.1%

Re-hospitalized after SNF stay Info Percentage of short-stay residents who were re-hospitalized after their nursing home admission. 28.6%
25% worse than North Carolina average

North Carolina average: 22.9%

Emergency department visits Info Percentage of short-stay residents who had an outpatient emergency department visit. 12.6%
5% better than North Carolina average

North Carolina average: 13.2%

Falls with major injury Info Percentage of SNF residents who experience falls with major injury during their stay. 0.0%
100% better than North Carolina average

North Carolina average: 0.8%

Ability to care for self at discharge Info Percentage of residents at or above expected ability to care for themselves at discharge. 65.4%
22% better than North Carolina average

North Carolina average: 53.7%

Successful return to home or community Info Rate of successful return to home or community from a skilled nursing facility. 62.1%
23% better than North Carolina average

North Carolina average: 50.6%

Guides for Better Senior Living

Care Cost Calculator: See Prices in Your Area

Nursing Home Data Explorer

Don’t Wait Too Long: 7 Red Flag Signs Your Parent Needs Assisted Living Now

The True Cost of Assisted Living in 2025 – And How Families Are Paying For It

Understanding Senior Living Costs: Pricing Models, Discounts & Financial Assistance

Tour Icon
Planning a tour? Check our touring checklist.
Chat Icon
Thinking of living here? We can help you speak to a current resident
Explore Open Rooms
1 Contact details
2 What type of senior care service are you looking for?
3 What budget do you have in mind for senior care?
4 How soon do you need to find care?
5 Additional details

Thank you for your interest!

Our team will be in touch shortly to help with next steps.