


Total staff
143
Employees
140
Contractors
3
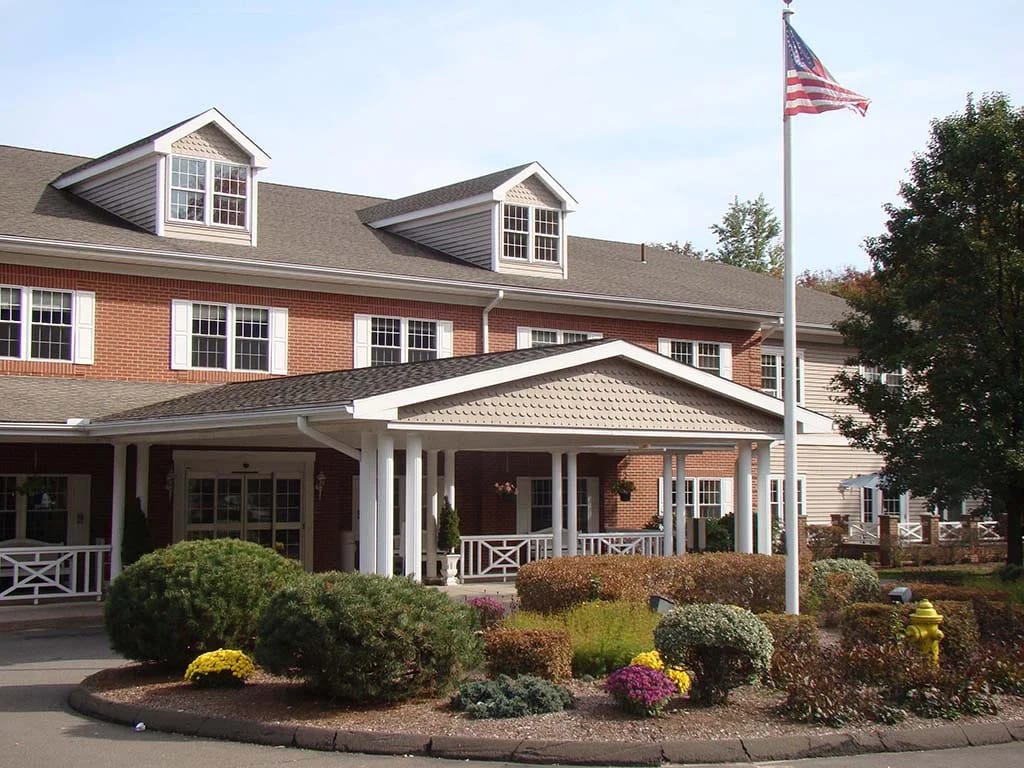

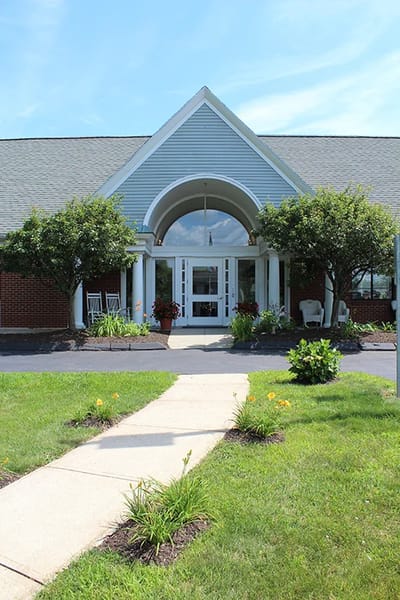
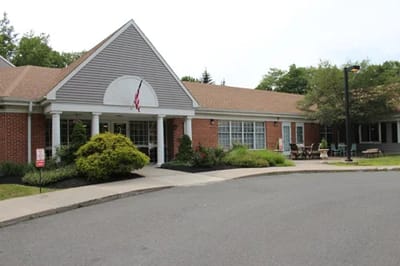
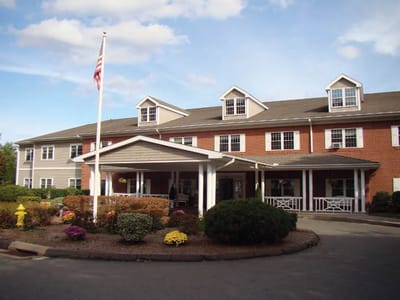


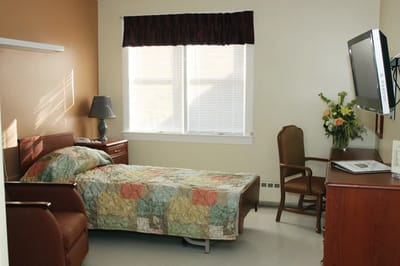


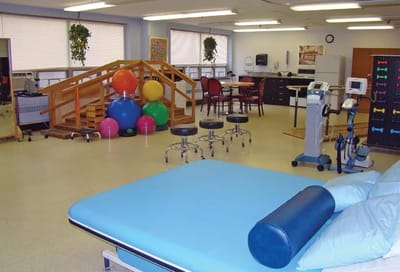


With a robust focus on short-term rehabilitation and subacute care, Hewitt Health & Rehabilitation Center is a skilled nursing facility on Maltby Street in Shelton, Connecticut. It operates 206 beds and typically cares for occupants averaging around 73 days of stay. This reflects its concentration on post-acute rehabilitation instead of long-term residential care.
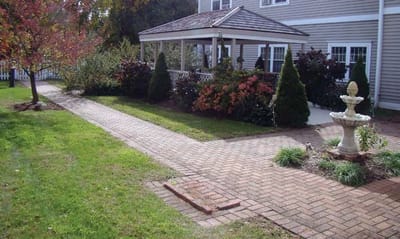
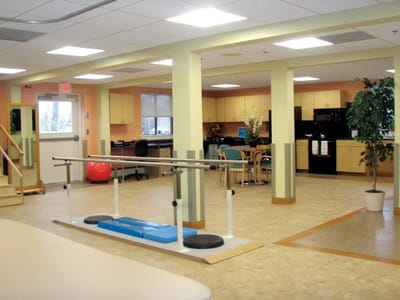
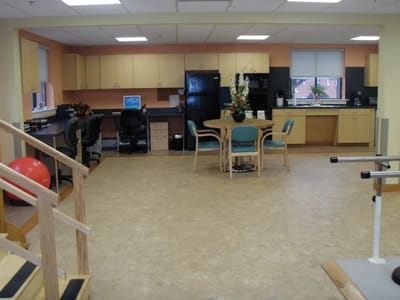
Medicare, Medicaid, and private pay are accepted, so families have numerous routes to fund rehabilitation stays and active skilled nursing care. Clinically, Hewitt Health & Rehabilitation Center highlights rehabilitation services with specialized programs: a dedicated short-term rehabilitation unit, pulmonary care, intravenous therapy, and speech language pathology. It’s then a grounded choice for someone recuperating from an acute hospital stay or needing intensive therapy. The facility also offers respite care to give short-term relief for families managing a loved one’s care at home. Daily nursing support averages 3 hours 41 minutes per resident, with registered nurses providing 18 minutes of direct care and nurse aides contributing around 2 hours 5 minutes. This staffing structure supports the diligent care that short-term rehabilitation demands. The center operates all the time with 24-hour staffing, ensuring care continuity during the critical recovery period. Nestled in a really walkable neighborhood that scores 74, the home’s Maltby Street location is easily accessible for visiting family members. On-site, occupants can access a gym and wellness program, and the facility operates its Safe Harbor Neighborhood program and other branded initiatives as part of its care approach. If occupants need extra support, cognitive and memory retention programs are offered.
For people convalescing from an acute hospital stay or requiring intensive therapy, Hewitt Health & Rehabilitation Center is a pragmatic option.
| Staff type | Hours / Day / Resident | vs state avg |
|---|---|---|
|
Registered Nurse (RN)
| 18m per day | ▼ 56% State avg: 42m per day · National avg: 41m per day |
|
LPN / LVN
| 50m per day | ■ Avg State avg: 50m per day · National avg: 52m per day |
|
Nurse Aide
| 2h 5m per day | ▼ 9% State avg: 2h 17m per day · National avg: 2h 21m per day |
|
Weekend Total Nursing
| 3h 4m per day | ▼ 10% State avg: 3h 25m per day · National avg: 3h 26m per day |
|
Physical Therapist
| 4m per day | ▼ 21% State avg: 5m per day · National avg: 4m per day |
|
Weekend RN
| 14m per day | ▼ 51% State avg: 28m per day · National avg: 29m per day |
Reporting period: October 1 – December 31, 2025 (Q4 2025). Source: CMS Payroll-Based Journal report.
Manages medical care and health needs.
Assists with medical care and medications.
Helps with daily care and mobility.
Total hours from contractors
495 contractor hours this quarter
| Certified Nursing Assistant | 75 | 0 | 75 | 21,950 | 92 | 100% | 7.3 |
| Licensed Practical Nurse | 26 | 0 | 26 | 8,228 | 92 | 100% | 7.1 |
| Registered Nurse | 9 | 0 | 9 | 2,453 | 92 | 100% | 8.1 |
| Other Dietary Services Staff | 5 | 0 | 5 | 1,039 | 82 | 89% | 7.4 |
| Physical Therapy Aide | 2 | 0 | 2 | 792 | 77 | 84% | 6.6 |
| Respiratory Therapy Technician | 5 | 0 | 5 | 690 | 78 | 85% | 5.6 |
| RN Director of Nursing | 3 | 0 | 3 | 476 | 49 | 53% | 7.2 |
| Administrator | 0 | 1 | 1 | 450 | 60 | 65% | 7.5 |
| Other Social Services Staff | 1 | 0 | 1 | 442 | 60 | 65% | 7.4 |
| Nurse Practitioner | 1 | 0 | 1 | 436 | 58 | 63% | 7.5 |
| Qualified Social Worker | 3 | 0 | 3 | 416 | 64 | 70% | 6.5 |
| Speech Language Pathologist | 1 | 0 | 1 | 413 | 63 | 68% | 6.6 |
| Mental Health Service Worker | 2 | 0 | 2 | 409 | 56 | 61% | 7.3 |
| Physical Therapy Assistant | 3 | 0 | 3 | 386 | 63 | 68% | 6.1 |
| Clinical Nurse Specialist | 3 | 0 | 3 | 329 | 39 | 42% | 6.6 |
| Occupational Therapy Aide | 1 | 0 | 1 | 184 | 25 | 27% | 7.4 |
| Medical Director | 0 | 1 | 1 | 34 | 20 | 22% | 1.7 |
| Occupational Therapy Assistant | 0 | 1 | 1 | 11 | 3 | 3% | 3.7 |
Includes penalties issued in 2024
Federal penalties imposed by CMS for regulatory violations, including civil money penalties (fines) and denials of payment for new Medicare/Medicaid admissions.
Source: CMS Penalties Database (Data as of Jan 2026)
Connecticut average: $44K
Connecticut average: 1.7
Connecticut average: 0.1
Penalties are imposed by CMS for violations of federal nursing home regulations.
1 penalty in the past 3 years
Jul 1, 2024 · $8K
Last updated: Jan 2026
These measures show how residents usually do over time at this home, based on health outcomes and preventive care.
Connecticut average: 10.4
Connecticut average: 21.1
Connecticut average: 18.9%
Connecticut average: 19.2%
Connecticut average: 24.9%
Connecticut average: 3.5%
Connecticut average: 4.6%
Connecticut average: 1.7%
Connecticut average: 6.3%
Connecticut average: 15.2%
Connecticut average: 17.2%
Connecticut average: 87.5%
Connecticut average: 93.5%
Connecticut average: 70.1%
Connecticut average: 1.5%
Connecticut average: 69.8%
Connecticut average: 25.0%
Connecticut average: 11.1%
Connecticut average: 0.8%
Connecticut average: 53.7%
Connecticut average: 50.6%
Quality measures are calculated from Minimum Data Set (MDS) assessments. For most measures, lower percentages indicate better care quality.
21% of new residents, usually for short-term rehab.
41% of new residents, often for short stays.
38% of new residents, often for long-term daily care.
Source: CMS Long-Term Care Facility Characteristics (Data as of Jan 2026)
Residents meet regularly to discuss policies, care quality, and activities
Organized group of residents that meets regularly to discuss facility policies, quality of life, and activities.
Data sourced from CMS Long-Term Care Facility Characteristics quarterly report. Payer mix reflects the current resident census by primary payment source.
Historical financial and operational data for Hewitt Health & Rehabilitation Center from 2011–2023, based on CMS SNF Cost Reports.
Key figures below are for fiscal year ending in 12/2023.
Based on CMS SNF Cost Report for fiscal year ending in 12/2023.
This home supports both short-term rehab and long-term care, with residents staying for a wide range of durations.
New residents most often arrive under private pay (41% of admissions), and a typical private pay stay runs around 1 - 2 months.
Coverage residents most often arrive under.
Coverage residents most often leave under.
![]() 0.3 miles from city center
0.3 miles from city center
![]() Estimated distance in miles from Shelton's city center to Hewitt Health & Rehabilitation Center's address, calculated via Google Maps.
Estimated distance in miles from Shelton's city center to Hewitt Health & Rehabilitation Center's address, calculated via Google Maps.
Add your location
Info below is compiled from CMS reports & the CT Dept. of Public Health (DPH), senior community websites & trusted data sources such as Walk Score & BBB.
Communities are listed from highest to lowest based on our ranking methodology.
| 3030 Park by Senior Living Hospitality | NH AL IL MC SNF | Bridgeport (Brooklawn/St. Vincent) | 23
Facility
23
CT AVG
113
Rank
#114 / 119 |
88.7%
Facility
88.7%
CT AVG
84
Rank
#54 / 104 | +6% | 5.50
Facility
5.50
CT AVG
3.97
Rank
#7 / 65 | +39% | +38% | $8.0k
Facility
$8.0k
CT AVG
$43.8k
Rank
#36 / 67 | 15
Facility
15
CT AVG
32.0
Rank
#10 / 67 | 5.0
Facility
5.0
CT AVG
5.8
Rank
#27 / 67 | 1 | 20 | - |
45
Facility
45
CT AVG
47
Rank
#143 / 264 | Ct Watermark Operator LLC | $21.2MFiscal year ending 12/2023
Facility
$21.2MFiscal year ending 12/2023
CT AVG
$19.0M
Rank
#38 / 70 | $9.3MFiscal year ending 12/2023
Facility
$9.3MFiscal year ending 12/2023
CT AVG
$7.2M
Rank
#42 / 70 | 43.7%Fiscal year ending 12/2023
Facility
43.7%Fiscal year ending 12/2023
CT AVG
42.4%
Rank
#44 / 70 | 75440 | ||||
| East Hill by Senior Living Hospitality | NH AL IL MC SNF | Southbury (Heritage Village) | 96
Facility
96
CT AVG
113
Rank
#68 / 119 |
24.7%
Facility
24.7%
CT AVG
84
Rank
#103 / 104 | -71% | 5.63
Facility
5.63
CT AVG
3.97
Rank
#5 / 65 | +132% | +42% | $0
Facility
$0
CT AVG
$43.8k
Rank
#1 / 67 | 28
Facility
28
CT AVG
32.0
Rank
#33 / 67 | 5.6
Facility
5.6
CT AVG
5.8
Rank
#41 / 67 | - | 24 | A+ |
6
Facility
6
CT AVG
47
Rank
#254 / 264 | Connie Haworth | $15.6MFiscal year ending 12/2023
Facility
$15.6MFiscal year ending 12/2023
CT AVG
$19.0M
Rank
#46 / 70 | $7.3MFiscal year ending 12/2023
Facility
$7.3MFiscal year ending 12/2023
CT AVG
$7.2M
Rank
#56 / 70 | 46.5%Fiscal year ending 12/2023
Facility
46.5%Fiscal year ending 12/2023
CT AVG
42.4%
Rank
#42 / 70 | 75441 | ||||
| Maefair Health Care Center | NH HC SNF | Trumbull (Trumbull Center) | 134
Facility
134
CT AVG
113
Rank
#35 / 119 |
93.2%
Facility
93.2%
CT AVG
84
Rank
#34 / 104 | +11% | 3.44
Facility
3.44
CT AVG
3.97
Rank
#48 / 65 | +11% | -14% | $25.4k
Facility
$25.4k
CT AVG
$43.8k
Rank
#56 / 67 | 28
Facility
28
CT AVG
32.0
Rank
#33 / 67 | 7.0
Facility
7.0
CT AVG
5.8
Rank
#52 / 67 | - | 125 | - |
25
Facility
25
CT AVG
47
Rank
#197 / 264 | Terri Golec | $15.5MFiscal year ending 09/2023
Facility
$15.5MFiscal year ending 09/2023
CT AVG
$19.0M
Rank
#15 / 70 | $11.4MFiscal year ending 09/2023
Facility
$11.4MFiscal year ending 09/2023
CT AVG
$7.2M
Rank
#34 / 70 | 73.8%Fiscal year ending 09/2023
Facility
73.8%Fiscal year ending 09/2023
CT AVG
42.4%
Rank
#67 / 70 | 75404 | ||||
| Pomperaug Woods | NH AL HOS IL MC RC SNF | Southbury (Southbury Historic District No. 1) | 37
Facility
37
CT AVG
113
Rank
#106 / 119 |
81.1%
Facility
81.1%
CT AVG
84
Rank
#79 / 104 | -3% | 5.75
Facility
5.75
CT AVG
3.97
Rank
#2 / 65 | +26% | +45% | $20.9k
Facility
$20.9k
CT AVG
$43.8k
Rank
#53 / 67 | 14
Facility
14
CT AVG
32.0
Rank
#8 / 67 | 7.0
Facility
7.0
CT AVG
5.8
Rank
#52 / 67 | 1 | 30 | - |
34
Facility
34
CT AVG
47
Rank
#178 / 264 | Dennis Fitzgerald | $12.8MFiscal year ending 09/2023
Facility
$12.8MFiscal year ending 09/2023
CT AVG
$19.0M
Rank
#60 / 70 | $6.8MFiscal year ending 09/2023
Facility
$6.8MFiscal year ending 09/2023
CT AVG
$7.2M
Rank
#57 / 70 | 53.6%Fiscal year ending 09/2023
Facility
53.6%Fiscal year ending 09/2023
CT AVG
42.4%
Rank
#19 / 70 | 75318 | ||||
| Hewitt Health & Rehabilitation Center | NH MC | Shelton (Maltby Street) | 206
Facility
206
CT AVG
113
Rank
#10 / 119 |
55.4%
Facility
55.4%
CT AVG
84
Rank
#98 / 104 | -34% | 3.68
Facility
3.68
CT AVG
3.97
Rank
#35 / 65 | -42% | -7% | $8.0k
Facility
$8.0k
CT AVG
$43.8k
Rank
#36 / 67 | 61
Facility
61
CT AVG
32.0
Rank
#63 / 67 | 6.8
Facility
6.8
CT AVG
5.8
Rank
#51 / 67 | 1 | 114 | - |
74
Facility
74
CT AVG
47
Rank
#50 / 264 | - | $11.5MFiscal year ending 12/2023
Facility
$11.5MFiscal year ending 12/2023
CT AVG
$19.0M
Rank
#63 / 70 | $6.6MFiscal year ending 12/2023
Facility
$6.6MFiscal year ending 12/2023
CT AVG
$7.2M
Rank
#62 / 70 | 57.3%Fiscal year ending 12/2023
Facility
57.3%Fiscal year ending 12/2023
CT AVG
42.4%
Rank
#26 / 70 | 75047 |
Hewitt Health & Rehabilitation Center is located in Shelton, Connecticut.
Here are the financial assistance programs available to residents in Connecticut.
Hewitt Health & Rehabilitation Center is in the Maltby Street neighborhood.
Hewitt Health & Rehabilitation Center has a walk score of 74. Very walkable. Most errands can be accomplished on foot, and many essentials are within a short walk.
Hewitt Health & Rehabilitation Center's occupancy is 78.8%.
No, Hewitt Health & Rehabilitation Center has a no-pet policy.
Hewitt Health & Rehabilitation Center is registered as a for-profit.
Yes — there are 33 photos of Hewitt Health & Rehabilitation Center in the photo gallery on this page.
Hewitt Health & Rehabilitation Center is located at 45 Maltby St, Shelton, CT 06484.
Care Cost Calculator: See Prices in Your Area
Nursing Home Data Explorer
Don’t Wait Too Long: 7 Red Flag Signs Your Parent Needs Assisted Living Now
The True Cost of Assisted Living in 2025 – And How Families Are Paying For It
Understanding Senior Living Costs: Pricing Models, Discounts & Financial Assistance


