Centennial Gardens for Nursing and Rehabilitation

Centennial Gardens for Nursing and Rehabilitation

Calculator: See prices in your area
Centennial Gardens for Nursing and Rehabilitation accepts Medicare, Medicaid, and private pay.

Overview of Centennial Gardens for Nursing and Rehabilitation

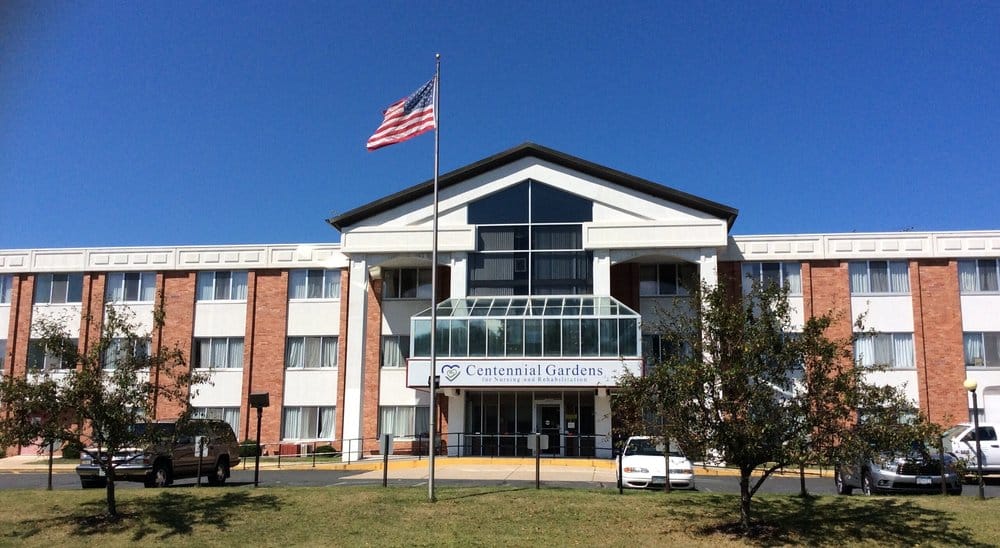
Centennial Gardens for Nursing and Rehabilitation is a distinct community located in the harmonious neighborhood of Minneapolis, MN, offering skilled nursing. Dedicated to residents’ wellness, the community provides the highest quality of care and assistance tailored to their unique needs and preferences. Enjoy every moment of your later years with the community helping with your day-to-day activities.

Fun activities and enriching events are also conducted for residents to remain active and socially engaged. Healthy meals are also necessary for residents’ well-being, hence, the community serves diverse dining options to cater to their dietary needs and preferences. The community is ideal for those who need supplementary care to live comfortably in retirement, with its comprehensive care and purposely designed amenities.

(763) 971-6300

Staffing hours breakdown

Info Daily nursing hours per resident by staff type, reported to CMS. Higher is generally better — compare this facility to state and national averages to see where staffing stands.

Hours per resident per day — compared to Minnesota state averages

Total nursing care / resident Info This home is ranked 12th out of 89 homes in Minnesota for nurse hours. Total adjusted nursing hours per resident per day, combining RN, LPN, and aide time. CMS adjusts this for case-mix so facilities can be fairly compared.
5h 34m per day
Rank #12 / 89Nurse hours — State benchmarkedThis home is ranked 12th out of 89 homes in Minnesota. Shows adjusted nurse hours per resident per day benchmarked to the Minnesota average, with a ranking across 89 Minnesota facilities. More hours mean more direct care. The national average is about 3.5 hrs; below 3.0 is a red flag.Ranking totals vary by category as each rank only includes facilities that report data for that metric. Homes missing that data point aren't included in the ranking.Click the rank badge to see the full State ranking.Click here to see the full State ranking.
This facility Minnesota avg (4h 46m per day)
vs Minnesota avg
+17%

2 of 6 metrics below state avg

Standout metric LPN / LVN is +48% above state avg
Staff typeHours / Day / Residentvs state avg
Registered Nurse (RN) Info RNs hold the highest nursing license and can assess residents, interpret test results, and direct care plans. More RN hours per day often signals stronger clinical oversight and faster response to health changes. 31m per day ▼ 51% State avg: 1h 4m per day · National avg: 41m per day
LPN / LVN Info Licensed Practical Nurses (LPNs) or Licensed Vocational Nurses (LVNs) deliver routine hands-on care — medication administration, wound dressing, and monitoring vital signs. They work under RN supervision and make up a large share of daily bedside care. 55m per day ▲ 48% State avg: 37m per day · National avg: 52m per day
Nurse Aide Info Certified Nurse Aides (CNAs) provide the most direct day-to-day assistance: bathing, dressing, feeding, and mobility. Nurse aide hours are typically the largest staffing category and directly affect residents' quality of life. 3h 0m per day ▲ 17% State avg: 2h 33m per day · National avg: 2h 21m per day
Weekend Total Nursing Info Combined nursing hours (RN + LPN + Nurse Aide) per resident per day on weekends. Staffing often drops on weekends — this figure reveals whether the facility maintains adequate coverage outside of weekday hours. 3h 56m per day ▲ 7% State avg: 3h 41m per day · National avg: 3h 26m per day
Physical Therapist Info Hours per resident per day provided by licensed Physical Therapists (PTs) or PT Assistants. PT services help residents recover mobility after injury or illness and are especially important for post-acute (short-stay) rehabilitation. 5m per day ▲ 16% State avg: 4m per day · National avg: 4m per day
Weekend RN Info Registered nurse hours specifically on weekends. Facilities sometimes reduce RN presence on Saturdays and Sundays — a low weekend RN figure compared to weekday hours can indicate reduced clinical oversight when most administrative staff are absent. 23m per day ▼ 44% State avg: 41m per day · National avg: 29m per day

Capacity and availability

This home usually has availability

Lower occupancy than the Minnesota average: 79.7%
Occupancy rate
60.2% Rank #247 / 331Occupancy rate — State benchmarkedThis home is ranked 247th out of 331 homes in Minnesota. Shows this facility's occupancy rate versus the Minnesota average, with its Statewide rank out of 331. Higher occupancy signals strong local demand and financial stability.Ranking totals vary by category as each rank only includes facilities that report data for that metric. Homes missing that data point aren't included in the ranking.Click the rank badge to see the full State ranking.Click here to see the full State ranking.
Avg. Length of Stay
62 days
Bed community size
85-bed community Rank #159 / 532Bed count — State benchmarkedThis home is ranked 159th out of 532 homes in Minnesota. Shows this facility's certified or reported bed count compared to other Minnesota facilities. Larger communities may offer more amenities, programs, and on-site services for residents and families.Ranking totals vary by category as each rank only includes facilities that report data for that metric. Homes missing that data point aren't included in the ranking.Click the rank badge to see the full State ranking.Click here to see the full State ranking.
A larger shared setting that may offer more common spaces and organized community services.
Walk Score
Walk Score: 32 / 100 Rank #395 / 632Walk Score — State benchmarkedThis home is ranked 395th out of 632 homes in Minnesota. Shows how walkable this facility's neighborhood is compared to the average Walk Score across Minnesota facilities. Higher scores benefit residents, families, and staff.Ranking totals vary by category as each rank only includes facilities that report data for that metric. Homes missing that data point aren't included in the ranking.Click the rank badge to see the full State ranking.Click here to see the full State ranking.
Somewhat walkable. A few nearby services may be reachable on foot, but most trips require transportation.

About this community

Contact Centennial Gardens for Nursing and Rehabilitation

Staffing Data

Reporting period: October 1 – December 31, 2025 (Q4 2025). Source: CMS Payroll-Based Journal report.

Total staff 94
Employees 94
Contractors 0
Staff to resident ratio 1.84 : 1
16% fewer staff per resident than Minnesota average
Minnesota average ratio: 2.19 : 1 Minnesota average ratio: 2.19 : 1See full Minnesota ranking
Avg staff/day 42
Average shift 8.2 hours
9% better than Minnesota average
Minnesota average: 7.5 hours Minnesota average shift: 7.5 hoursSee full Minnesota ranking
Total staff hours (quarter) 31,824

Nursing staff breakdown

Q4 2025 · Oct 1 – Dec 31 More info This data comes from the CMS Payroll-Based Journal report covering October 1 – December 31, 2025.
Registered Nurse

Manages medical care and health needs.

RN Staff Info All 8 RN Staff are full-time employees. No contractors work on this role. 8
Average shift length Info Average shift length. Calculated as total hours divided by days worked and average staff per day. 8.7 hours
Licensed Practical Nurse

Assists with medical care and medications.

LPN Staff Info All 13 LPN Staff are full-time employees. No contractors work on this role. 13
Average shift length Info Average shift length. Calculated as total hours divided by days worked and average staff per day. 9.5 hours
Certified Nursing Assistant

Helps with daily care and mobility.

CNA Staff Info All 40 CNA Staff are full-time employees. No contractors work on this role. 40
Average shift length Info Average shift length. Calculated as total hours divided by days worked and average staff per day. 8 hours

Contractor staffing

Q4 2025 · Oct 1 – Dec 31 More info This data comes from the CMS Payroll-Based Journal report covering October 1 – December 31, 2025.
Total hours from contractors 0% — all staff are direct employees this quarter

Staff by category

Q4 2025 · Oct 1 – Dec 31 More info This data comes from the CMS Payroll-Based Journal report covering October 1 – December 31, 2025.
Certified Nursing Assistant4004014,19792100%8
Licensed Practical Nurse130134,72292100%9.5
Medication Aide/Technician9093,9089199%9.1
Registered Nurse8082,64892100%8.7
Other Dietary Services Staff3031,2508188%8.7
RN Director of Nursing2028086874%8.1
Physical Therapy Assistant3036296975%6.9
Administrator1015106470%8
Speech Language Pathologist1015006267%8.1
Mental Health Service Worker1014966065%8.3
Clinical Nurse Specialist1014955964%8.4
Respiratory Therapy Technician3034696267%7.4
Dental Services Staff1014615560%8.4
Dietitian1014485964%7.6
Physical Therapy Aide4041924246%4.3
Qualified Social Worker202502224%2.3
Therapeutic Recreation Specialist101421617%2.6
40 Certified Nursing Assistant
% of Days 100%
13 Licensed Practical Nurse
% of Days 100%
9 Medication Aide/Technician
% of Days 99%
8 Registered Nurse
% of Days 100%
3 Other Dietary Services Staff
% of Days 88%
2 RN Director of Nursing
% of Days 74%
3 Physical Therapy Assistant
% of Days 75%
1 Administrator
% of Days 70%
1 Speech Language Pathologist
% of Days 67%
1 Mental Health Service Worker
% of Days 65%
1 Clinical Nurse Specialist
% of Days 64%
3 Respiratory Therapy Technician
% of Days 67%
1 Dental Services Staff
% of Days 60%
1 Dietitian
% of Days 64%
4 Physical Therapy Aide
% of Days 46%
2 Qualified Social Worker
% of Days 24%
1 Therapeutic Recreation Specialist
% of Days 17%

Penalties and fines

Includes penalties issued in 2023-2024

Federal penalties imposed by CMS for regulatory violations, including civil money penalties (fines) and denials of payment for new Medicare/Medicaid admissions.

Source: CMS Penalties Database (Data as of Jan 2026)

Total fines amount $174K Rank #87 / 90Federal fines — State benchmarkedThis home is ranked 87th out of 90 homes in Minnesota. Shows this facility's cumulative CMS federal fine dollars versus the Minnesota average among facilities with fines, and where it ranks among 90 facilities in the pool. Lower total dollars mean a better rank.Ranking totals vary by category as each rank only includes facilities that report data for that metric. Homes missing that data point aren't included in the ranking.Click the rank badge to see the full State ranking.Click here to see the full State ranking.
292% higher than Minnesota average

Minnesota average: $44K

Number of fines 8
299% more fines than Minnesota average

Minnesota average: 2.0

Payment Denials Info Serious action where Medicare and/or Medicaid temporarily stops payments for new residents until issues are fixed. 4
822% more payment denials than Minnesota average

Minnesota average: 0.4

Fines amount comparison
This facility $174K
Minnesota average $44K
Penalty History

Penalties are imposed by CMS for violations of federal nursing home regulations.

11 penalties in the past 3 years

Multiple penalties were reported in the last 3 years.

Payment Denial Info Serious action where Medicare and/or Medicaid temporarily stops payments for new residents until issues are fixed. Aug 30, 2024
31 days
Civil Money Penalty Info Fines imposed for noncompliance, which can be assessed per day or per instance of violation. Aug 6, 2024
$16K
Civil Money Penalty Info Fines imposed for noncompliance, which can be assessed per day or per instance of violation. Mar 27, 2024
$18K
Payment Denial Info Serious action where Medicare and/or Medicaid temporarily stops payments for new residents until issues are fixed. Mar 27, 2024
25 days

Last updated: Jan 2026

Quality of care over time

These measures show how residents usually do over time at this home, based on health outcomes and preventive care.

High-risk clinical events score Info A composite score based on pressure ulcers, falls with injury, weight loss, walking ability decline, and activities of daily living decline. 17.3
56% worse than Minnesota average

Minnesota average: 11.1

Functional decline score Info A composite score based on activities of daily living decline, walking ability decline, and incontinence. 32.9
46% worse than Minnesota average

Minnesota average: 22.6

Long-stay resident measures
Need for Help with Daily Activities Increased Info Percent of long-stay residents whose need for help with daily activities has increased 26.8%
42% worse than Minnesota average

Minnesota average: 18.9%

Walking Ability Worsened Info Percent of long-stay residents whose ability to move independently worsened 42.8%
80% worse than Minnesota average

Minnesota average: 23.8%

Low Risk Residents with Bowel/Bladder Incontinence Info Percent of low risk long-stay residents who lose control of their bowels or bladder 29.1%
16% worse than Minnesota average

Minnesota average: 25.0%

Falls with Major Injury Info Percent of long-stay residents experiencing one or more falls with major injury 2.9%
22% better than Minnesota average

Minnesota average: 3.7%

High Risk Residents with Pressure Ulcers Info Percent of long-stay high risk residents with pressure ulcers 9.0%
66% worse than Minnesota average

Minnesota average: 5.4%

Urinary Tract Infection Info Percent of long-stay residents with a urinary tract infection 0.5%
82% better than Minnesota average

Minnesota average: 2.7%

Lost Too Much Weight Info Percent of long-stay residents who lose too much weight 5.1%
24% worse than Minnesota average

Minnesota average: 4.1%

Depressive Symptoms Info Percent of long-stay residents who have depressive symptoms 8.9%
103% worse than Minnesota average

Minnesota average: 4.4%

Antipsychotic Use Info Percent of long-stay residents who received an antipsychotic medication 23.8%
38% worse than Minnesota average

Minnesota average: 17.2%

Pneumococcal Vaccine Info Percent of long-stay residents assessed and appropriately given the pneumococcal vaccine 85.5%
12% worse than Minnesota average

Minnesota average: 97.3%

Influenza Vaccine Info Percent of long-stay residents assessed and appropriately given the seasonal influenza vaccine 95.0%
In line with Minnesota average

Minnesota average: 96.0%

Hospitalizations per 1,000 days Info Number of hospitalizations per 1,000 long-stay resident days. 1.98
19% worse than Minnesota average

Minnesota average: 1.67

ED visits per 1,000 days Info Number of outpatient emergency department visits per 1,000 long-stay resident days. 4.69
136% worse than Minnesota average

Minnesota average: 1.99

Short-stay resident measures
Pneumococcal Vaccine Info Percent of short-stay residents assessed and appropriately given the pneumococcal vaccine 44.7%
50% worse than Minnesota average

Minnesota average: 88.9%

Antipsychotic medication increase Info Percent of short-stay residents who newly received an antipsychotic medication 7.4%
284% worse than Minnesota average

Minnesota average: 1.9%

Influenza Vaccine Info Percent of short-stay residents assessed and appropriately given the seasonal influenza vaccine 32.4%
61% worse than Minnesota average

Minnesota average: 82.6%

Successful return to home or community Info Rate of successful return to home or community from a skilled nursing facility. 36.1%
29% worse than Minnesota average

Minnesota average: 50.6%

Breakdown by payment type

Medicare

15% of new residents, usually for short-term rehab.

Typical stay 30 days

Private pay

25% of new residents, often for short stays.

Typical stay 1 - 2 months

Medicaid

61% of new residents, often for long-term daily care.

Typical stay 2 - 3 months

Facility Characteristics

Source: CMS Long-Term Care Facility Characteristics (Data as of Jan 2026)

Total residents 51
Medicare
5
9.8% of residents
Medicaid
37
72.5% of residents
Private pay or other
9
17.6% of residents
Programs & Services
Residents Group

Residents meet regularly to discuss policies, care quality, and activities

Active Resident Council

Organized group of residents that meets regularly to discuss facility policies, quality of life, and activities.

Finances and operations

Based on CMS SNF Cost Report for fiscal year ending in 12/2023.

Voluntary non-profit community
Net patient revenue Info Net patient revenue — what the home actually collects for resident care, after contractual allowances, bad debt and discounts are subtracted from its gross charges (CMS cost report, Worksheet G-3). It covers resident care only; money the home earns from other sources is shown separately as "Other income."
$8.8M
Net patient income Info Net patient income: net patient revenue minus the home's total operating expenses. A positive figure means it earns more from resident care than it spends to deliver it; a negative figure means the opposite. It excludes non-operating "other income."
-$2.2M
Voluntary non-profit community
Net patient revenue Info Net patient revenue — what the home actually collects for resident care, after contractual allowances, bad debt and discounts are subtracted from its gross charges (CMS cost report, Worksheet G-3). It covers resident care only; money the home earns from other sources is shown separately as "Other income."
$8.8M Rank #57 / 89Revenue — State benchmarkedThis home is ranked 57th out of 89 homes in Minnesota. Shows this facility's annual revenue compared to the Minnesota average. Higher revenue generally means more resources for staffing and capital — read alongside Payroll %.Ranking totals vary by category as each rank only includes facilities that report data for that metric. Homes missing that data point aren't included in the ranking.Click the rank badge to see the full State ranking.Click here to see the full State ranking.
Net patient income Info Net patient income: net patient revenue minus the home's total operating expenses. A positive figure means it earns more from resident care than it spends to deliver it; a negative figure means the opposite. It excludes non-operating "other income."
-$2.2M
Other income Info Money the home earns outside of resident care — such as investments, grants, rentals and other non-operating sources (CMS cost report, Worksheet G-3). It is tracked separately from net patient revenue: it is not part of that figure, and it is not included in net patient income.
$1.4K
Payroll costs Info Staff salaries plus wage-related costs — benefits such as payroll taxes, health insurance and retirement — from the home's own accounting records (CMS cost report, Worksheet A). Contract or agency labor is counted separately, under other operating costs. Rank #39 / 89Payroll — State benchmarkedThis home is ranked 39th out of 89 homes in Minnesota. Shows total annual staff payroll benchmarked to the Minnesota average. Higher payroll investment relative to peers often signals better staffing and less reliance on cheaper contract labor.Ranking totals vary by category as each rank only includes facilities that report data for that metric. Homes missing that data point aren't included in the ranking.Click the rank badge to see the full State ranking.Click here to see the full State ranking.
$7.5M 85.1% of net patient revenue Info Payroll as a share of revenue: staff salaries and wage-related benefits divided by net patient revenue. A higher figure means more of each revenue dollar goes to staff pay. Rank #2 / 89Payroll % — State benchmarkedThis home is ranked 2nd out of 89 homes in Minnesota. Shows payroll as a percentage of revenue versus the Minnesota average. Well-run Minnesota facilities typically land around 61–68% — the top third Statewide. Below 25% may signal understaffing or heavy agency use — read with Staffing ratings.Ranking totals vary by category as each rank only includes facilities that report data for that metric. Homes missing that data point aren't included in the ranking.Click the rank badge to see the full State ranking.Click here to see the full State ranking.
Other operating costs Info Everything it costs to run the home apart from payroll — food, utilities, supplies, maintenance, contract labor and administration. Calculated as total operating expense minus payroll (staff salaries and wage-related benefits).
$3.5M
Total costs Info The home's total operating expense for the year — all the costs of running it, salaries included (CMS cost report, Worksheet G-3).
$11.0M

What does this home offer?

Building type icon
Building type icon

Building Type: 3-story

Recreational activities icon

Recreational Activities

Who this home usually serves

TYPE OF STAY

Mostly long-term care residents

Most residents stay for extended periods and receive ongoing daily care.

Most new residents arrive under Medicaid (61% of admissions), and a typical Medicaid stay runs around 2 - 3 months.

Admissions
386 total

Coverage residents most often arrive under.

Medicare 15%
Private pay 25%
Medicaid 61%
Discharges
405 total

Coverage residents most often leave under.

Medicare 8%
Private pay 20%
Medicaid 72%

Places of interest near Centennial Gardens for Nursing and Rehabilitation

Address 8.6 miles from city center Info Estimated distance in miles from Minneapolis's city center to Centennial Gardens for Nursing and Rehabilitation's address, calculated via Google Maps.

Calculate Travel Distance to Centennial Gardens for Nursing and Rehabilitation

Add your location

Address

Compare Nursing Home around Hennepin County

The information below is reported by the Minnesota Department of Health, Health Regulation Division.

3 facilities compared · CMS & MN Dept. of Health data

The Villas at Bryn Mawr
NH
AL
Minneapolis (Harrison)
105
Facility 105
MN AVG 61
Rank #112 / 532
75.0%
Facility 75.0%
MN AVG 79.7%
Rank #188 / 331
-6%
3.73
Facility 3.73
MN AVG 4.77
Rank #81 / 89
-68%-22%
$35.3k
Facility $35.3k
MN AVG $47.9k
Rank #66 / 90
58
Facility 58
MN AVG 23.2
Rank #85 / 90
5.3
Facility 5.3
MN AVG 3.8
Rank #71 / 90
499-
55
Facility 55
MN AVG 43
Rank #217 / 632
-
$9.0M
Facility $9.0M
MN AVG $9.9M
Rank #59 / 89
$4.8M
Facility $4.8M
MN AVG $4.9M
Rank #52 / 89
53.8%
Facility 53.8%
MN AVG 50.7%
Rank #38 / 89
245203
The Villas at Robbinsdale
NH
AL
Robbinsdale
75
Facility 75
MN AVG 61
Rank #184 / 532
88.0%
Facility 88.0%
MN AVG 79.7%
Rank #90 / 331
+10%
3.94
Facility 3.94
MN AVG 4.77
Rank #69 / 89
-12%-17%
$121.2k
Facility $121.2k
MN AVG $47.9k
Rank #83 / 90
37
Facility 37
MN AVG 23.2
Rank #67 / 90
3.7
Facility 3.7
MN AVG 3.8
Rank #41 / 90
269-
41
Facility 41
MN AVG 43
Rank #327 / 632
-
$9.0M
Facility $9.0M
MN AVG $9.9M
Rank #61 / 89
$4.1M
Facility $4.1M
MN AVG $4.9M
Rank #50 / 89
46.1%
Facility 46.1%
MN AVG 50.7%
Rank #28 / 89
245417
Centennial Gardens for Nursing and Rehabilitation -
NH
Minneapolis (Bassett Creek)
85
Facility 85
MN AVG 61
Rank #159 / 532
60.2%
Facility 60.2%
MN AVG 79.7%
Rank #247 / 331
-24%
5.57
Facility 5.57
MN AVG 4.77
Rank #12 / 89
----40%+17%
$174.0k
Facility $174.0k
MN AVG $47.9k
Rank #87 / 90
157
Facility 157
MN AVG 23.2
Rank #90 / 90
5.6
Facility 5.6
MN AVG 3.8
Rank #76 / 90
766-
32
Facility 32
MN AVG 43
Rank #395 / 632
George Katz
$8.8M
Facility $8.8M
MN AVG $9.9M
Rank #57 / 89
$7.5M
Facility $7.5M
MN AVG $4.9M
Rank #39 / 89
85.1%
Facility 85.1%
MN AVG 50.7%
Rank #2 / 89
245289

Financial Assistance for
Nursing Home in Minnesota

Centennial Gardens for Nursing and Rehabilitation is located in Minneapolis, Minnesota.
Here are the financial assistance programs available to residents in Minnesota.

Get Financial aid guidance

Elderly Waiver

Minnesota Medicaid EW

Age 65+
General Minnesota resident, Medicaid-eligible, nursing home-level care need.
Income Limits (2025) ~$2,829/month 300% FBR, individual
Asset Limits $3,000 individual, higher than most states
MN

Higher asset limit; rural access focus.

Benefits
Personal care (5-7 hours/day) Respite (240 hours/year) Adult day care (~$70/day) Home aides

Essential Community Supports (ECS)

Minnesota ECS

Age 65+
General Minnesota resident, at risk of decline but not nursing home level.
Income Limits ~$1,732/month individual, varies
Asset Limits $3,000 individual
MN

Bridges gap for those ineligible for waivers.

Benefits
In-home support (2-4 hours/week) Respite (up to 5 days/year) Transportation (~5 trips/month)

Alternative Care (AC) Program

Minnesota Alternative Care Program

Age 65+
General Minnesota resident, NFLOC, not MA-eligible.
Income Limits (2025) ~$1,255-$2,829/month (100%-300% FPL); sliding scale copays.
Asset Limits $3,000 (individual); home equity limit $713,000.
MN

CDCS option; statewide via counties.

Benefits
Personal care (4-6 hours/day) Respite (~5 days/year) Home health Meals Home mods

Minnesota Senior Health Options (MSHO)

Minnesota Senior Health Options

Age 65+
General Minnesota resident, eligible for MA and Medicare Parts A/B.
Income Limits (2025) ~$1,255/month (100% FPL for MA); spenddown allowed.
Asset Limits $3,000 (individual), $6,000 (couple).
MN

7 health plans (e.g., UCare, HealthPartners); care coordinator assigned.

Benefits
Personal care (5-7 hours/day) Medical care Respite Adult day care Home mods $900/year groceries (some plans)

Minnesota Senior Care Plus (MSC+)

Minnesota Senior Care Plus

Age 65+
General Minnesota resident, MA-eligible, not on Medicare.
Income Limits (2025) ~$1,255/month (100% FPL); spenddown allowed.
Asset Limits $3,000 (individual), $6,000 (couple).
MN

Includes EW services; 7 health plans available.

Benefits
Personal care (5-7 hours/day) Respite Adult day care Home mods Limited nursing home care

Consumer Support Grant (CSG)

Minnesota Consumer Support Grant

Age 65+ or disabled
General Minnesota resident, eligible for MA personal care but opts for grant.
Income Limits (2025) ~$1,255/month (MA-eligible); spenddown allowed.
Asset Limits $3,000 individual
MN

Can hire family; statewide via counties.

Benefits
Cash (~$500-$1,500/month) for personal care Respite Home mods Assistive tech

Medicare Savings Program (MSP)

Minnesota Medicare Savings Program

Age 65+ or disabled
General Minnesota resident, Medicare Part A/B.
Income Limits (2025) ~$2,510/month (QMB), ~$3,380/month (SLMB), ~$3,598/month (QI)—individual.
Asset Limits $9,430 (individual), $14,130 (couple).
MN

Three tiers; no waitlist; includes Extra Help for Part D.

Benefits
Covers Part B premiums ($174.70/month) Deductibles ($240/year) Copays (~20%)

VA Aid and Attendance (A&A) and Housebound Benefits

Minnesota VA Aid and Attendance/Housebound

Age 65+ or disabled veteran/spouse
General Minnesota resident, wartime service, need for ADL help (A&A) or homebound.
Income Limits (2025) Net income < ~$1,984/month (veteran with dependent, A&A); pension offsets income.
Asset Limits ~$155,356 net worth limit
MN

High veteran demand in rural/urban areas.

Benefits
Cash (~$1,433-$2,642/month veteran, ~$951-$1,318 spouse) for care costs (e.g., in-home, assisted living)

Frequently Asked Questions about Centennial Gardens for Nursing and Rehabilitation

What neighborhood is Centennial Gardens for Nursing and Rehabilitation in?

Centennial Gardens for Nursing and Rehabilitation is in the Bassett Creek neighborhood.

Is Centennial Gardens for Nursing and Rehabilitation in a walkable area?

Centennial Gardens for Nursing and Rehabilitation has a walk score of 32. Somewhat walkable. A few nearby services may be reachable on foot, but most trips require transportation.

What is the occupancy rate at Centennial Gardens for Nursing and Rehabilitation?

Centennial Gardens for Nursing and Rehabilitation's occupancy is 60.2%.

Are there photos of Centennial Gardens for Nursing and Rehabilitation?

Yes — there is 1 photo of Centennial Gardens for Nursing and Rehabilitation in the photo gallery on this page.

What is the address of Centennial Gardens for Nursing and Rehabilitation?

Centennial Gardens for Nursing and Rehabilitation is located at 3245 Vera Cruz Ave N, Minneapolis, MN 55422.

What is the phone number of Centennial Gardens for Nursing and Rehabilitation?

(763) 971-6300 will put you in contact with the team at Centennial Gardens for Nursing and Rehabilitation.

Is Centennial Gardens for Nursing and Rehabilitation Medicare or Medicaid certified?

Yes — Centennial Gardens for Nursing and Rehabilitation is a CMS-certified provider of Medicare and Medicaid.

Guides for Better Senior Living

Care Cost Calculator: See Prices in Your Area

Nursing Home Data Explorer

Don’t Wait Too Long: 7 Red Flag Signs Your Parent Needs Assisted Living Now

The True Cost of Assisted Living in 2025 – And How Families Are Paying For It

Understanding Senior Living Costs: Pricing Models, Discounts & Financial Assistance