


Total staff
172
Employees
165
Contractors
7
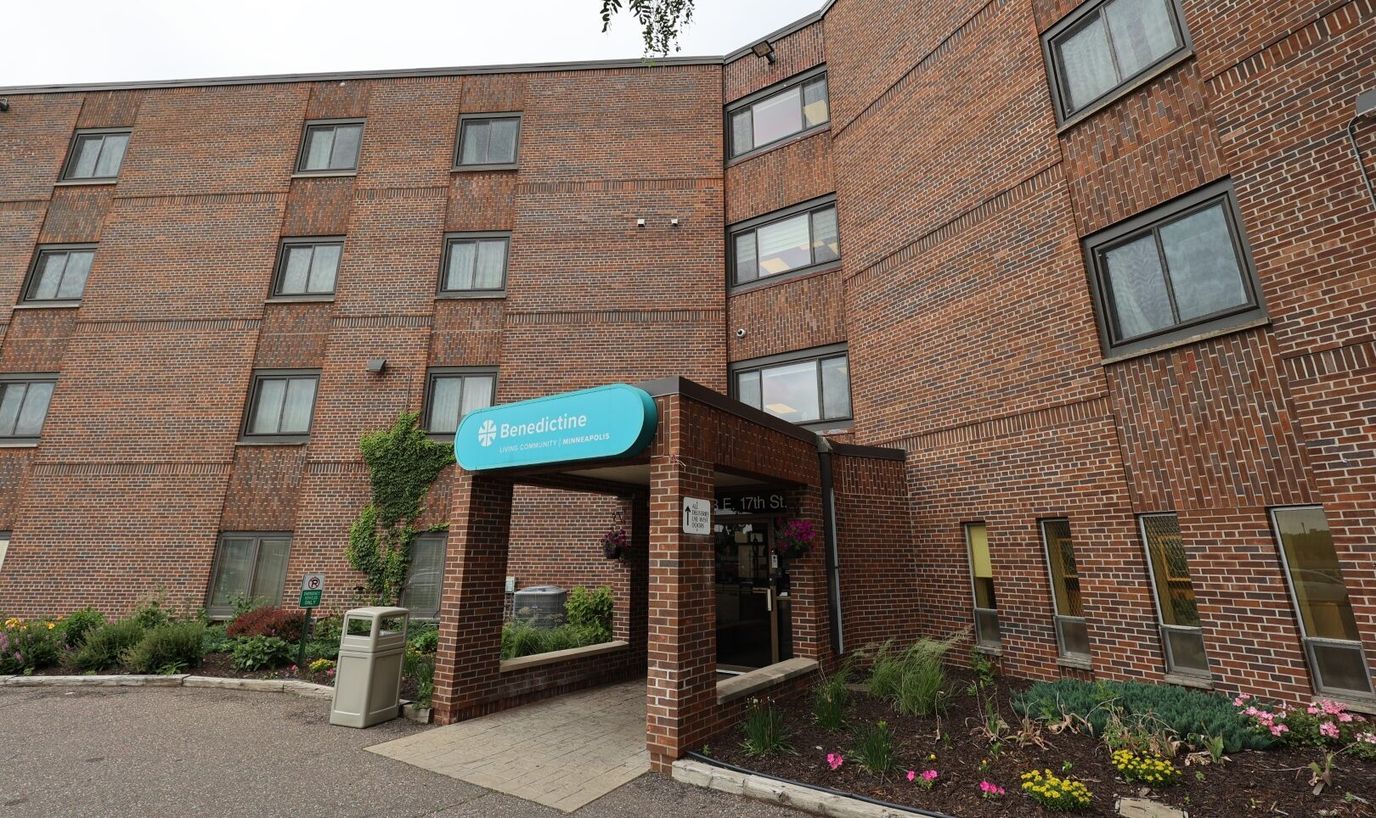


Benedictine Living Community-Minneapolis is a skilled nursing home in Minneapolis, right on 618 E 17th St in the Central neighborhood. It offers both assisted living and skilled nursing care, and the building has 90 beds total, split between private rooms and rooms shared by two people. Getting around without a car is easy here too. The neighborhood has a Walk Score of 80, which means most places you’d need are just a short walk away.
Staff handle wound care, tube feeding, and help with breathing problems, and there’s a special unit just for residents who need a ventilator or a tracheostomy. Hospice and comfort care are offered too, for residents nearing the end of life, and people recovering from surgery or a hospital stay can get short-term rehab here as well.
Registered nurses spend 2 hours and 27 minutes with each resident every day, and licensed practical nurses add another 28 minutes on top of that. Nurse aides pitch in for 2 hours and 9 minutes more. Add it all up, and residents get 3 hours and 38 minutes of nursing care each day.
When it comes to paying for care, families have options; Benedictine Living Community-Minneapolis takes Medicare, Medicaid, and private pay. Looking at everything together, the special medical units, the hands-on services, and the strong staffing numbers, this is a place built for residents who need serious, ongoing medical care, not just help with everyday tasks.
| Staff type | Hours / Day / Resident | vs state avg |
|---|---|---|
|
Registered Nurse (RN)
| 2h 27m per day | ▲ 129% State avg: 1h 4m per day · National avg: 41m per day |
|
LPN / LVN
| 28m per day | ▼ 24% State avg: 37m per day · National avg: 52m per day |
|
Nurse Aide
| 2h 9m per day | ▼ 14% State avg: 2h 30m per day · National avg: 2h 20m per day |
|
Weekend Total Nursing
| 4h 33m per day | ▲ 24% State avg: 3h 40m per day · National avg: 3h 27m per day |
|
Physical Therapist
| 1m per day | ▼ 79% State avg: 5m per day · National avg: 4m per day |
|
Weekend RN
| 2h 5m per day | ▲ 201% State avg: 41m per day · National avg: 29m per day |
Reporting period: October 1 – December 31, 2025 (Q4 2025). Source: CMS Payroll-Based Journal report.
Manages medical care and health needs.
Assists with medical care and medications.
Helps with daily care and mobility.
Total hours from contractors
1,463 contractor hours this quarter
| Registered Nurse | 54 | 0 | 54 | 17,149 | 92 | 100% | 7.4 |
| Certified Nursing Assistant | 63 | 0 | 63 | 16,762 | 92 | 100% | 7.2 |
| Licensed Practical Nurse | 11 | 0 | 11 | 3,700 | 92 | 100% | 8.1 |
| Clinical Nurse Specialist | 3 | 0 | 3 | 1,404 | 64 | 70% | 7.9 |
| Dietitian | 5 | 0 | 5 | 1,401 | 91 | 99% | 7.8 |
| Physical Therapy Assistant | 6 | 0 | 6 | 557 | 63 | 68% | 7.1 |
| Nurse Practitioner | 0 | 1 | 1 | 512 | 64 | 70% | 8 |
| Speech Language Pathologist | 4 | 0 | 4 | 506 | 64 | 70% | 7.3 |
| Qualified Activities Professional | 1 | 0 | 1 | 459 | 58 | 63% | 7.9 |
| Administrator | 1 | 1 | 2 | 448 | 56 | 61% | 7.8 |
| Occupational Therapy Aide | 0 | 1 | 1 | 416 | 52 | 57% | 8 |
| Mental Health Service Worker | 1 | 0 | 1 | 400 | 50 | 54% | 8 |
| Qualified Social Worker | 4 | 1 | 5 | 396 | 64 | 70% | 6.1 |
| Dental Services Staff | 1 | 0 | 1 | 348 | 43 | 47% | 8.1 |
| Respiratory Therapy Technician | 9 | 0 | 9 | 130 | 29 | 32% | 4.4 |
| Diagnostic X-ray Services Staff | 0 | 1 | 1 | 91 | 13 | 14% | 7 |
| Medical Director | 0 | 1 | 1 | 84 | 14 | 15% | 6 |
| Occupational Therapy Assistant | 0 | 1 | 1 | 32 | 8 | 9% | 4 |
| Physical Therapy Aide | 2 | 0 | 2 | 16 | 4 | 4% | 4.1 |
Includes penalties issued in 2024
Federal penalties imposed by CMS for regulatory violations, including civil money penalties (fines) and denials of payment for new Medicare/Medicaid admissions.
Source: CMS Penalties Database (Data as of Jan 2026)
Minnesota average: $44K
Minnesota average: 2.0
Minnesota average: 0.4
Penalties are imposed by CMS for violations of federal nursing home regulations.
2 penalties in the past 3 years
Multiple penalties were reported in the last 3 years.
Last updated: Jan 2026
These measures show how residents usually do over time at this home, based on health outcomes and preventive care.
Minnesota average: 11.1
Minnesota average: 22.6
Minnesota average: 18.9%
Minnesota average: 23.8%
Minnesota average: 25.0%
Minnesota average: 3.7%
Minnesota average: 5.4%
Minnesota average: 2.7%
Minnesota average: 4.1%
Minnesota average: 4.4%
Minnesota average: 17.2%
Minnesota average: 97.3%
Minnesota average: 96.0%
Minnesota average: 88.9%
Minnesota average: 1.9%
Quality measures are calculated from Minimum Data Set (MDS) assessments. For most measures, lower percentages indicate better care quality.
13% of new residents, usually for short-term rehab.
36% of new residents, often for short stays.
51% of new residents, often for long-term daily care.
Source: CMS Long-Term Care Facility Characteristics (Data as of Jan 2026)
Residents meet regularly to discuss policies, care quality, and activities
Organized group of residents that meets regularly to discuss facility policies, quality of life, and activities.
Data sourced from CMS Long-Term Care Facility Characteristics quarterly report. Payer mix reflects the current resident census by primary payment source.
Historical financial and operational data for Benedictine Living Community-Minneapolis from 2012–2024, based on CMS SNF Cost Reports.
Key figures below are for fiscal year ending in 06/2024.
Based on CMS SNF Cost Report for fiscal year ending in 06/2024.
Pets Allowed
Housing Options: Private Room / Double Room
Building Type: Mid-rise
Fitness and Recreation
Most residents stay for extended periods and receive ongoing daily care.
Most new residents arrive under Medicaid (51% of admissions), and a typical Medicaid stay runs around 11 months.
Coverage residents most often arrive under.
Coverage residents most often leave under.
![]() 1.0 miles from city center
1.0 miles from city center
![]() Estimated distance in miles from Minneapolis's city center to Benedictine Living Community-Minneapolis's address, calculated via Google Maps.
Estimated distance in miles from Minneapolis's city center to Benedictine Living Community-Minneapolis's address, calculated via Google Maps.
Add your location
The information below is reported by the Minnesota Department of Health, Health Regulation Division.
| Redeemer Health Care Center | AL HOS NH PC RC SNF | Minneapolis (Powderhorn) | 119
Facility
119
MN AVG
61
Rank
#77 / 528 |
93.9%
Facility
93.9%
MN AVG
72.9
Rank
#45 / 282 | +29% | 5.23
Facility
5.23
MN AVG
4.77
Rank
#20 / 84 | -28% | +10% | $0
Facility
$0
MN AVG
$47.9k
Rank
#1 / 85 | 25
Facility
25
MN AVG
23.2
Rank
#42 / 85 | 5.0
Facility
5.0
MN AVG
3.8
Rank
#63 / 85 | - | 112 | - |
95
Facility
95
MN AVG
43
Rank
#3 / 632 | Danny Colgan | $15.5MFiscal year ending 12/2023
Facility
$15.5MFiscal year ending 12/2023
MN AVG
$9.9M
Rank
#30 / 84 | $9.9MFiscal year ending 12/2023
Facility
$9.9MFiscal year ending 12/2023
MN AVG
$4.9M
Rank
#19 / 84 | 63.5%Fiscal year ending 12/2023
Facility
63.5%Fiscal year ending 12/2023
MN AVG
50.7%
Rank
#29 / 84 | 245520 | ||||
| Jones-Harrison Senior Living | AL MC NH SNF | Minneapolis (Calhoun Isles) | 53
Facility
53
MN AVG
61
Rank
#247 / 528 |
92.5%
Facility
92.5%
MN AVG
72.9
Rank
#57 / 282 | +27% | 5.11
Facility
5.11
MN AVG
4.77
Rank
#26 / 84 | +38% | +7% | $0
Facility
$0
MN AVG
$47.9k
Rank
#1 / 85 | 35
Facility
35
MN AVG
23.2
Rank
#61 / 85 | 4.4
Facility
4.4
MN AVG
3.8
Rank
#54 / 85 | - | 49 | - |
56
Facility
56
MN AVG
43
Rank
#212 / 632 | Marcia Diracles | $13.5MFiscal year ending 09/2023
Facility
$13.5MFiscal year ending 09/2023
MN AVG
$9.9M
Rank
#24 / 84 | $12.2MFiscal year ending 09/2023
Facility
$12.2MFiscal year ending 09/2023
MN AVG
$4.9M
Rank
#15 / 84 | 90.4%Fiscal year ending 09/2023
Facility
90.4%Fiscal year ending 09/2023
MN AVG
50.7%
Rank
#15 / 84 | 245460 | ||||
| Mount Olivet Careview Home | AL MC NH RESC SNF | Minneapolis (Southwest Minneapolis) | 155
Facility
155
MN AVG
61
Rank
#33 / 528 | - | - | 5.39
Facility
5.39
MN AVG
4.77
Rank
#15 / 84 | +20% | +13% | $55.0k
Facility
$55.0k
MN AVG
$47.9k
Rank
#70 / 85 | 18
Facility
18
MN AVG
23.2
Rank
#26 / 85 | 2.3
Facility
2.3
MN AVG
3.8
Rank
#11 / 85 | 1 | 14 | - |
76
Facility
76
MN AVG
43
Rank
#71 / 632 | Sharon Flack | $25.6MFiscal year ending 12/2023
Facility
$25.6MFiscal year ending 12/2023
MN AVG
$9.9M
Rank
#8 / 84 | $16.5MFiscal year ending 12/2023
Facility
$16.5MFiscal year ending 12/2023
MN AVG
$4.9M
Rank
#4 / 84 | 64.3%Fiscal year ending 12/2023
Facility
64.3%Fiscal year ending 12/2023
MN AVG
50.7%
Rank
#23 / 84 | 245071 | ||||
| Catholic Eldercare | AL ADC IL MC NH RC SNF | Minneapolis (St. Anthony West) | 164
Facility
164
MN AVG
61
Rank
#27 / 528 |
89.6%
Facility
89.6%
MN AVG
72.9
Rank
#70 / 282 | +23% | 4.82
Facility
4.82
MN AVG
4.77
Rank
#36 / 84 | +31% | +1% | $24.3k
Facility
$24.3k
MN AVG
$47.9k
Rank
#58 / 85 | 29
Facility
29
MN AVG
23.2
Rank
#50 / 85 | 4.8
Facility
4.8
MN AVG
3.8
Rank
#61 / 85 | 1 | 147 | - |
82
Facility
82
MN AVG
43
Rank
#33 / 632 | John Bauer | $21.0MFiscal year ending 09/2023
Facility
$21.0MFiscal year ending 09/2023
MN AVG
$9.9M
Rank
#19 / 84 | $14.1MFiscal year ending 09/2023
Facility
$14.1MFiscal year ending 09/2023
MN AVG
$4.9M
Rank
#8 / 84 | 67.4%Fiscal year ending 09/2023
Facility
67.4%Fiscal year ending 09/2023
MN AVG
50.7%
Rank
#13 / 84 | 245439 | ||||
| Benedictine Living Community-Minneapolis | AL ADC HC MC NH RC SNF | Minneapolis (Central Minneapolis) | 90
Facility
90
MN AVG
61
Rank
#142 / 528 |
94.2%
Facility
94.2%
MN AVG
72.9
Rank
#42 / 282 | +29% | 3.64
Facility
3.64
MN AVG
4.77
Rank
#80 / 84 | +122% | -24% | $84.8k
Facility
$84.8k
MN AVG
$47.9k
Rank
#73 / 85 | 33
Facility
33
MN AVG
23.2
Rank
#56 / 85 | 3.7
Facility
3.7
MN AVG
3.8
Rank
#37 / 85 | 2 | 85 | - |
80
Facility
80
MN AVG
43
Rank
#47 / 632 | Jeffrey Benson | $13.9MFiscal year ending 06/2024
Facility
$13.9MFiscal year ending 06/2024
MN AVG
$9.9M
Rank
#34 / 84 | $9.5MFiscal year ending 06/2024
Facility
$9.5MFiscal year ending 06/2024
MN AVG
$4.9M
Rank
#26 / 84 | 68.2%Fiscal year ending 06/2024
Facility
68.2%Fiscal year ending 06/2024
MN AVG
50.7%
Rank
#22 / 84 | 245266 |
Benedictine Living Community-Minneapolis is located in Minneapolis, Minnesota.
Here are the financial assistance programs available to residents in Minnesota.
Benedictine Living Community-Minneapolis is in the Central Minneapolis neighborhood.
Benedictine Living Community-Minneapolis has a walk score of 80. Very walkable. Most errands can be accomplished on foot, and many essentials are within a short walk.
Benedictine Living Community-Minneapolis's occupancy is 85.8%.
Yes, Benedictine Living Community-Minneapolis allows residents to bring their pets.
Benedictine Living Community-Minneapolis is registered as a non-profit.
Yes — there are 5 photos of Benedictine Living Community-Minneapolis in the photo gallery on this page.
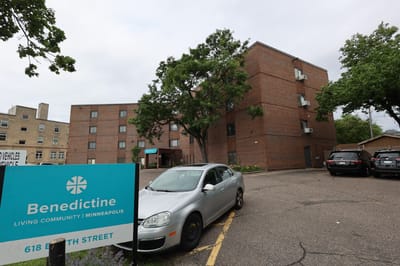
Benedictine Living Community-Minneapolis is located at 618 E 17Th St, Minneapolis, MN 55404.
Care Cost Calculator: See Prices in Your Area
Nursing Home Data Explorer
Don’t Wait Too Long: 7 Red Flag Signs Your Parent Needs Assisted Living Now
The True Cost of Assisted Living in 2025 – And How Families Are Paying For It
Understanding Senior Living Costs: Pricing Models, Discounts & Financial Assistance


