


Total staff
96
Employees
96
Contractors
0
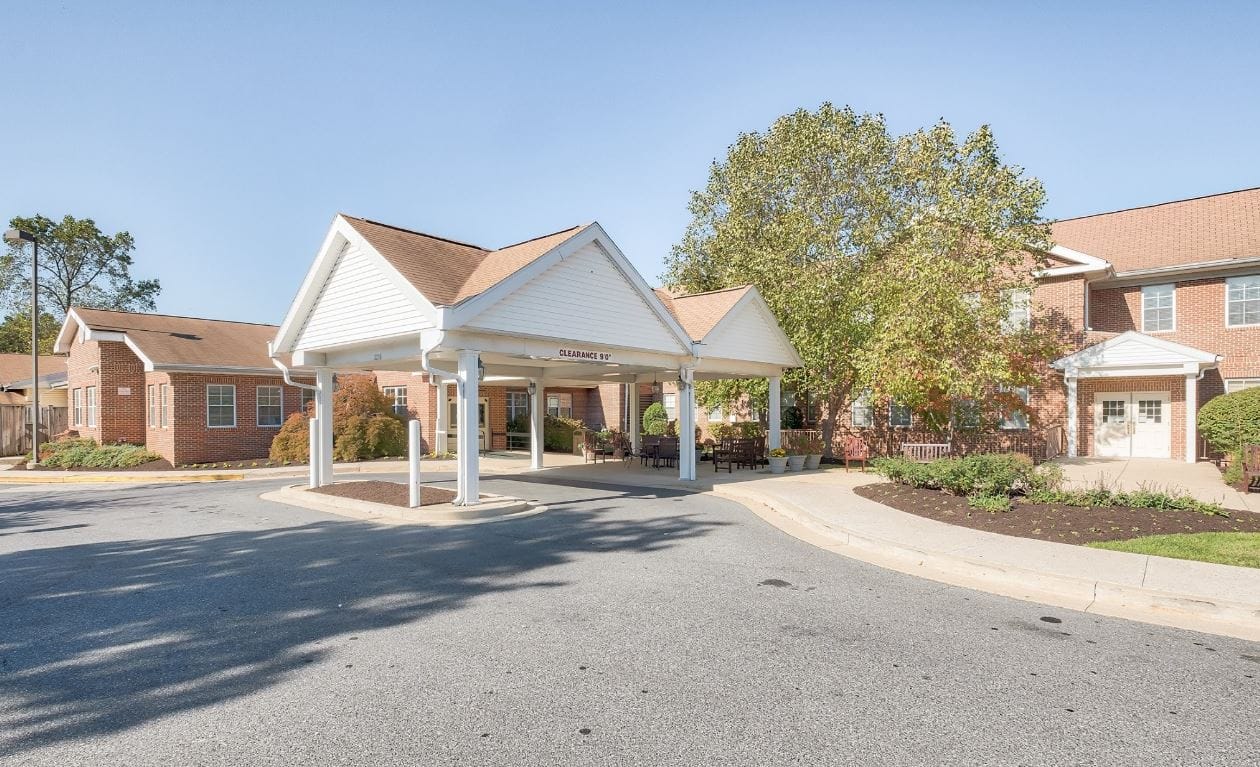


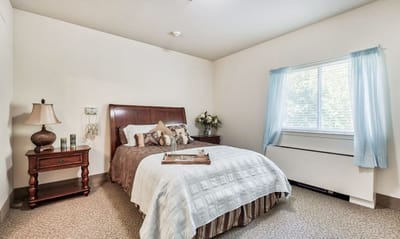
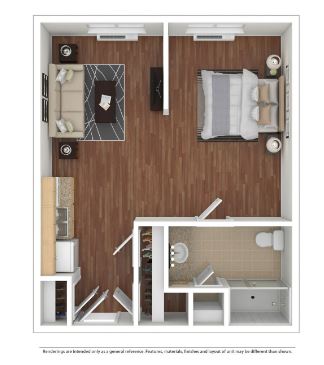
Situated in the heart of Adelphi, MD, the Sterling Care Hillhaven Assisted Living and Memory Care is an esteemed senior living community offering assisted living, independent living, memory care, long-term skilled nursing care, short-term rehabilitation, and dialysis services. Beautifully appointed and spacious accommodations with several floor plans are available for its residents. In terms of memory care, those with cognitive conditions undergo their Life Engagement Programming which aims to foster meaningful conversations and promote a fulfilling lifestyle.
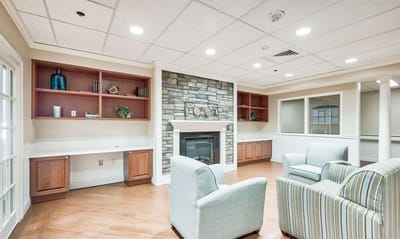
With its top-of-the-line amenities and services, residents can enjoy the following: family lounge, beauty salon, expansive wellness/rehabilitation gym, specialized diets, cable television/telephone, free wi-fi, and smoke-free community. Moreover, the community offers medical services such as diabetes management, orthopedic therapy, and medication administration. Engage in planned daily activities including outings religious services, music concerts, table games, and exercise. Meet new companions and create unforgettable memories within the amazing shared spaces of this community. Equipped with the right tools and people, seniors are guaranteed an all-encompassing living experience with Sterling Care Hillhaven Assisted Living and Memory Care.
| Staff type | Hours / Day / Resident | vs state avg |
|---|---|---|
|
Registered Nurse (RN)
| 32m per day | ▼ 37% State avg: 50m per day · National avg: 41m per day |
|
LPN / LVN
| 59m per day | ▲ 10% State avg: 54m per day · National avg: 52m per day |
|
Nurse Aide
| 2h 30m per day | ▲ 16% State avg: 2h 10m per day · National avg: 2h 21m per day |
|
Weekend Total Nursing
| 3h 52m per day | ▲ 11% State avg: 3h 29m per day · National avg: 3h 26m per day |
|
Physical Therapist
| 0m per day | ▼ 100% State avg: 5m per day · National avg: 4m per day |
|
Weekend RN
| 27m per day | ▼ 28% State avg: 37m per day · National avg: 29m per day |
Reporting period: October 1 – December 31, 2025 (Q4 2025). Source: CMS Payroll-Based Journal report.
Manages medical care and health needs.
Assists with medical care and medications.
Helps with daily care and mobility.
| Certified Nursing Assistant | 39 | 0 | 39 | 12,321 | 92 | 100% | 7.5 |
| Licensed Practical Nurse | 31 | 0 | 31 | 5,100 | 92 | 100% | 7.6 |
| Clinical Nurse Specialist | 6 | 0 | 6 | 1,340 | 88 | 96% | 6.4 |
| Other Dietary Services Staff | 3 | 0 | 3 | 1,317 | 86 | 93% | 8.2 |
| Medication Aide/Technician | 6 | 0 | 6 | 949 | 82 | 89% | 8.4 |
| Registered Nurse | 4 | 0 | 4 | 929 | 83 | 90% | 8 |
| Administrator | 2 | 0 | 2 | 717 | 66 | 72% | 7.7 |
| Nurse Practitioner | 2 | 0 | 2 | 528 | 66 | 72% | 8 |
| Mental Health Service Worker | 1 | 0 | 1 | 374 | 59 | 64% | 6.3 |
| RN Director of Nursing | 1 | 0 | 1 | 144 | 9 | 10% | 16 |
| Medical Director | 1 | 0 | 1 | 112 | 14 | 15% | 8 |
Federal penalties imposed by CMS for regulatory violations, including civil money penalties (fines) and denials of payment for new Medicare/Medicaid admissions.
Source: CMS Penalties Database
No penalties in the past 3 years
No civil money penalties or payment denials were reported in the last 3 years.
These measures show how residents usually do over time at this home, based on health outcomes and preventive care.
Maryland average: 12.9
Maryland average: 25.7
Maryland average: 23.7%
Maryland average: 27.7%
Maryland average: 25.9%
Maryland average: 2.3%
Maryland average: 6.5%
Maryland average: 1.6%
Maryland average: 5.8%
Maryland average: 20.2%
Maryland average: 12.9%
Maryland average: 92.0%
Maryland average: 96.6%
Maryland average: 1.32
Maryland average: 1.21
Maryland average: 78.4%
Maryland average: 1.4%
Maryland average: 80.6%
Maryland average: 21.2%
Maryland average: 9.9%
Maryland average: 0.8%
Maryland average: 53.7%
Maryland average: 50.6%
Quality measures are calculated from Minimum Data Set (MDS) assessments. For most measures, lower percentages indicate better care quality.
83% of new residents, usually for short-term rehab.
16% of new residents, often for short stays.
2% of new residents, often for long-term daily care.
Source: CMS Long-Term Care Facility Characteristics (Data as of Jan 2026)
Residents meet regularly to discuss policies, care quality, and activities
Organized group of residents that meets regularly to discuss facility policies, quality of life, and activities.
Data sourced from CMS Long-Term Care Facility Characteristics quarterly report. Payer mix reflects the current resident census by primary payment source.
Historical financial and operational data for Sterling Care Hillhaven Assisted Living and Memory Care from 2011–2022, based on CMS SNF Cost Reports.
Key figures below are for fiscal year ending in 07/2022 — the home's most recent complete cost report, an older period than most facilities report.
Based on the home's most recent complete CMS SNF Cost Report — fiscal year ending in 07/2022. This is an older period than most facilities report, so compare with that in mind.
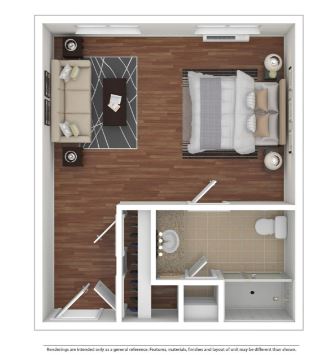
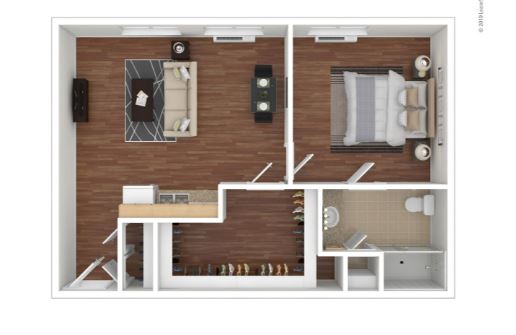
No pets allowed
Housing Options: Studio / 1 Bed
Building Type: Two-story
Most residents typically stay for a few weeks or months before returning home or moving on.
Most new residents arrive under Medicare (83% of admissions), and a typical Medicare stay runs around 26 days.
Coverage residents most often arrive under.
Coverage residents most often leave under.
![]() 2.9 miles from city center
2.9 miles from city center
![]() Estimated distance in miles from Adelphi's city center to Sterling Care Hillhaven Assisted Living and Memory Care's address, calculated via Google Maps.
— 5.13 miles to nearest hospital (UM Laurel Medical Center)
Estimated distance in miles from Adelphi's city center to Sterling Care Hillhaven Assisted Living and Memory Care's address, calculated via Google Maps.
— 5.13 miles to nearest hospital (UM Laurel Medical Center)
Add your location
Info below is compiled from CMS reports & the MD Dept. of Health (OHCQ), senior community websites & trusted data sources such as Walk Score & BBB.
Communities are listed from highest to lowest based on our ranking methodology.
| Edenwald Senior Living | NH AL IL MC SNF | Towson (Southerly Road) | 94
Facility
94
MD AVG
42
Rank
#139 / 685 | - | - | 5.28
Facility
5.28
MD AVG
3.77
Rank
#9 / 125 | +5% | +40% | $0
Facility
$0
MD AVG
$65.0k
Rank
#1 / 127 | 9
Facility
9
MD AVG
49.9
Rank
#2 / 127 | 4.5
Facility
4.5
MD AVG
12.8
Rank
#4 / 127 | - | 35 | A+ |
83
Facility
83
MD AVG
43
Rank
#70 / 985 | Mark Beggs | $29.9MFiscal year ending 12/2023
Facility
$29.9MFiscal year ending 12/2023
MD AVG
$18.7M
Rank
#15 / 126 | $16.0MFiscal year ending 12/2023
Facility
$16.0MFiscal year ending 12/2023
MD AVG
$6.5M
Rank
#16 / 126 | 53.6%Fiscal year ending 12/2023
Facility
53.6%Fiscal year ending 12/2023
MD AVG
38.5%
Rank
#65 / 126 | 215372 | ||||
| Lutheran Village at Miller’s Grant | NH AL IL SNF | Ellicott City (Lutheran Village At Miller’s Grant) | 36
Facility
36
MD AVG
42
Rank
#230 / 685 | - | - | 6.58
Facility
6.58
MD AVG
3.77
Rank
#5 / 125 | -14% | +74% | $0
Facility
$0
MD AVG
$65.0k
Rank
#1 / 127 | 14
Facility
14
MD AVG
49.9
Rank
#5 / 127 | 7.0
Facility
7.0
MD AVG
12.8
Rank
#19 / 127 | - | 14 | - |
19
Facility
19
MD AVG
43
Rank
#746 / 985 | Geary Milliken | $23.7MFiscal year ending 06/2024
Facility
$23.7MFiscal year ending 06/2024
MD AVG
$18.7M
Rank
#24 / 126 | $6.9MFiscal year ending 06/2024
Facility
$6.9MFiscal year ending 06/2024
MD AVG
$6.5M
Rank
#89 / 126 | 29%Fiscal year ending 06/2024
Facility
29%Fiscal year ending 06/2024
MD AVG
38.5%
Rank
#126 / 126 | 215363 | ||||
| Friends House Retirement Community | NH AL IL SNF | Sandy Spring | 24
Facility
24
MD AVG
42
Rank
#242 / 685 | - | - | 4.26
Facility
4.26
MD AVG
3.77
Rank
#25 / 125 | -19% | +13% | $23.0k
Facility
$23.0k
MD AVG
$65.0k
Rank
#102 / 127 | 17
Facility
17
MD AVG
49.9
Rank
#8 / 127 | 4.3
Facility
4.3
MD AVG
12.8
Rank
#3 / 127 | - | 65 | - |
6
Facility
6
MD AVG
43
Rank
#891 / 985 | Kendall Anthony | $10.7MFiscal year ending 06/2024
Facility
$10.7MFiscal year ending 06/2024
MD AVG
$18.7M
Rank
#71 / 126 | $8.4MFiscal year ending 06/2024
Facility
$8.4MFiscal year ending 06/2024
MD AVG
$6.5M
Rank
#53 / 126 | 78.4%Fiscal year ending 06/2024
Facility
78.4%Fiscal year ending 06/2024
MD AVG
38.5%
Rank
#24 / 126 | 215211 | ||||
| Sterling Care Hillhaven Assisted Living and Memory Care | NH AL HOS MC SNF | Adelphi (Knollwood) | 66
Facility
66
MD AVG
42
Rank
#188 / 685 |
87.1%
Facility
87.1%
MD AVG
80.3
Rank
#51 / 97 | +8% | - | -69% | - | $0
Facility
$0
MD AVG
$65.0k
Rank
#1 / 127 | 18
Facility
18
MD AVG
49.9
Rank
#9 / 127 | 6.0
Facility
6.0
MD AVG
12.8
Rank
#9 / 127 | - | 58 | - |
25
Facility
25
MD AVG
43
Rank
#684 / 985 | Hillhaven Operator Holdco, LLC | $13.3M*Fiscal year ending 07/2022These figures are from this home's most recent complete cost report — an older period than most facilities report. Compare with that in mind.
Facility
$13.3M*Fiscal year ending 07/2022These figures are from this home's most recent complete cost report — an older period than most facilities report. Compare with that in mind.
MD AVG
$18.7M
Rank
#99 / 126 | $7.7M*Fiscal year ending 07/2022These figures are from this home's most recent complete cost report — an older period than most facilities report. Compare with that in mind.
Facility
$7.7M*Fiscal year ending 07/2022These figures are from this home's most recent complete cost report — an older period than most facilities report. Compare with that in mind.
MD AVG
$6.5M
Rank
#79 / 126 | 57.8%*Fiscal year ending 07/2022These figures are from this home's most recent complete cost report — an older period than most facilities report. Compare with that in mind.
Facility
57.8%*Fiscal year ending 07/2022These figures are from this home's most recent complete cost report — an older period than most facilities report. Compare with that in mind.
MD AVG
38.5%
Rank
#13 / 126 | 215212 | ||||
| Broadmead | NH AL IL MC RC SNF | Cockeysville | 40
Facility
40
MD AVG
42
Rank
#226 / 685 | - | - | 6.82
Facility
6.82
MD AVG
3.77
Rank
#4 / 125 | +48% | +81% | $0
Facility
$0
MD AVG
$65.0k
Rank
#1 / 127 | 10
Facility
10
MD AVG
49.9
Rank
#4 / 127 | 3.3
Facility
3.3
MD AVG
12.8
Rank
#2 / 127 | - | 38 | A+ | -
Facility
-
MD AVG
43
Rank
#959 / 985 | Ann Patterson | $38.0MFiscal year ending 06/2024
Facility
$38.0MFiscal year ending 06/2024
MD AVG
$18.7M
Rank
#8 / 126 | $18.2MFiscal year ending 06/2024
Facility
$18.2MFiscal year ending 06/2024
MD AVG
$6.5M
Rank
#8 / 126 | 48%Fiscal year ending 06/2024
Facility
48%Fiscal year ending 06/2024
MD AVG
38.5%
Rank
#102 / 126 | 215123 |
Sterling Care Hillhaven Assisted Living and Memory Care is in the Knollwood neighborhood.
Sterling Care Hillhaven Assisted Living and Memory Care has a walk score of 25. Somewhat walkable. A few nearby services may be reachable on foot, but most trips require transportation.
Sterling Care Hillhaven Assisted Living and Memory Care's occupancy is 89.6%.
No, Sterling Care Hillhaven Assisted Living and Memory Care has a no-pet policy.
Sterling Care Hillhaven Assisted Living and Memory Care is registered as a for-profit.
Yes — there are 5 photos of Sterling Care Hillhaven Assisted Living and Memory Care in the photo gallery on this page.
Sterling Care Hillhaven Assisted Living and Memory Care is located at 3210 Powder Mill Rd, Adelphi, MD 20783.
Care Cost Calculator: See Prices in Your Area
Nursing Home Data Explorer
Don’t Wait Too Long: 7 Red Flag Signs Your Parent Needs Assisted Living Now
The True Cost of Assisted Living in 2025 – And How Families Are Paying For It
Understanding Senior Living Costs: Pricing Models, Discounts & Financial Assistance


