

Occupancy rate
96%

We arrange tours, appointments, and even moving support so you don’t have to
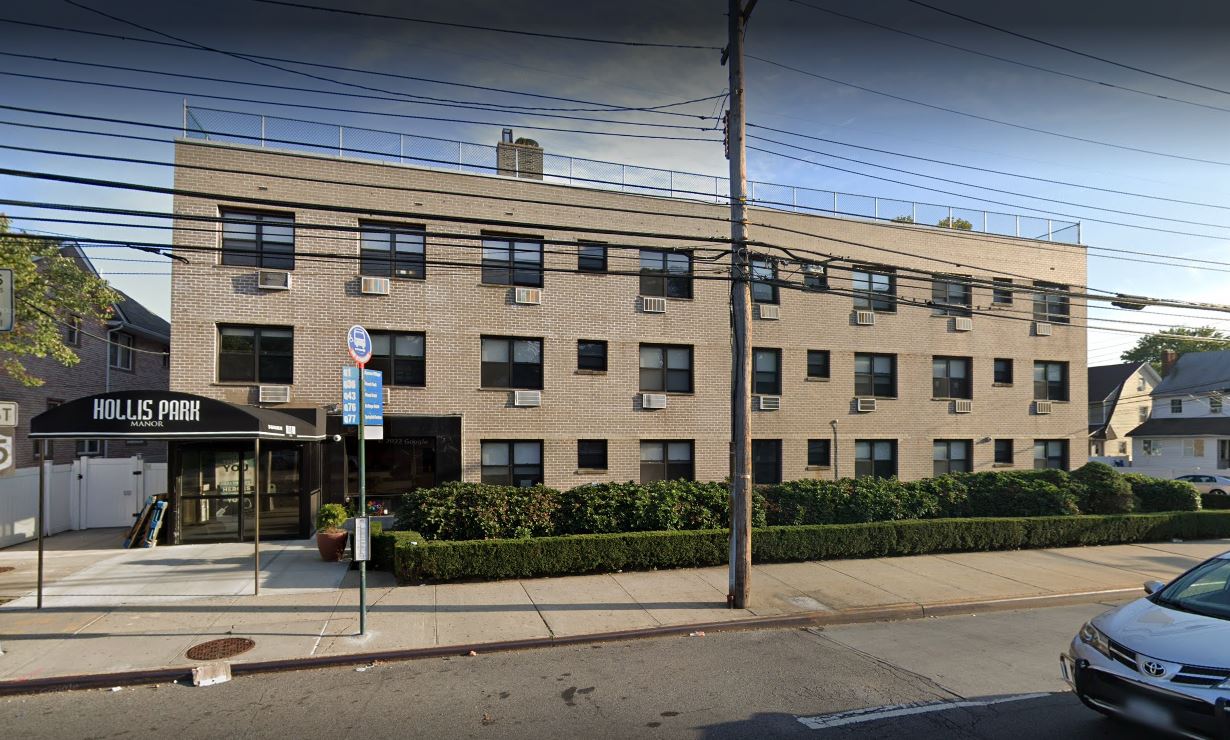


This boutique rehabilitation and nursing facility is an excellent care provider located in Queens, New York. Hollis Park Manor is highly passionate about what it does and makes sure all its residents receive the best care they need, when they need it. One of the best-rated nursing homes, it offers a variety of services, including 24-hour nursing care, short- and long-term rehabilitation, social services and family counseling, and psychiatry and psychological services, among others.
This long-term care facility is composed of individuals who are passionate about giving quality care. They understand that each individual has unique needs, which is why they have designed personalized care plans for each individual. Moreover, they utilize the best techniques and equipment needed so their residents can get the care they need.
Alan Bash serves as the Administrator at Hollis Park Manor, a boutique rehabilitation and nursing facility in Queens, NY. He is dedicated to providing the best care possible, focusing on fast rehabilitation and utilizing advanced techniques and equipment to ensure optimal outcomes for residents.
 Official CMS rating based on health inspections, staffing and quality measures.
Official CMS rating based on deficiencies found during state health inspections.
Official CMS rating based on nurse staffing hours per resident per day.
Official CMS rating based on clinical outcomes for residents.
Average daily nursing hours per resident (adjusted for acuity). Higher values indicate more nursing time per resident.
Hours of care per resident per day, broken down by staff type. Data from CMS Medicare.
Registered nurse hours per resident per day.
Nurse aide hours per resident per day.
Total number of nurse staff hours per resident per day on weekends.
Physical therapist staff hours per resident per day.
Registered nurse hours per resident per day on weekends.
Official CMS rating based on health inspections, staffing and quality measures.
Official CMS rating based on deficiencies found during state health inspections.
Official CMS rating based on nurse staffing hours per resident per day.
Official CMS rating based on clinical outcomes for residents.
Average daily nursing hours per resident (adjusted for acuity). Higher values indicate more nursing time per resident.
Hours of care per resident per day, broken down by staff type. Data from CMS Medicare.
Registered nurse hours per resident per day.
Nurse aide hours per resident per day.
Total number of nurse staff hours per resident per day on weekends.
Physical therapist staff hours per resident per day.
Registered nurse hours per resident per day on weekends.
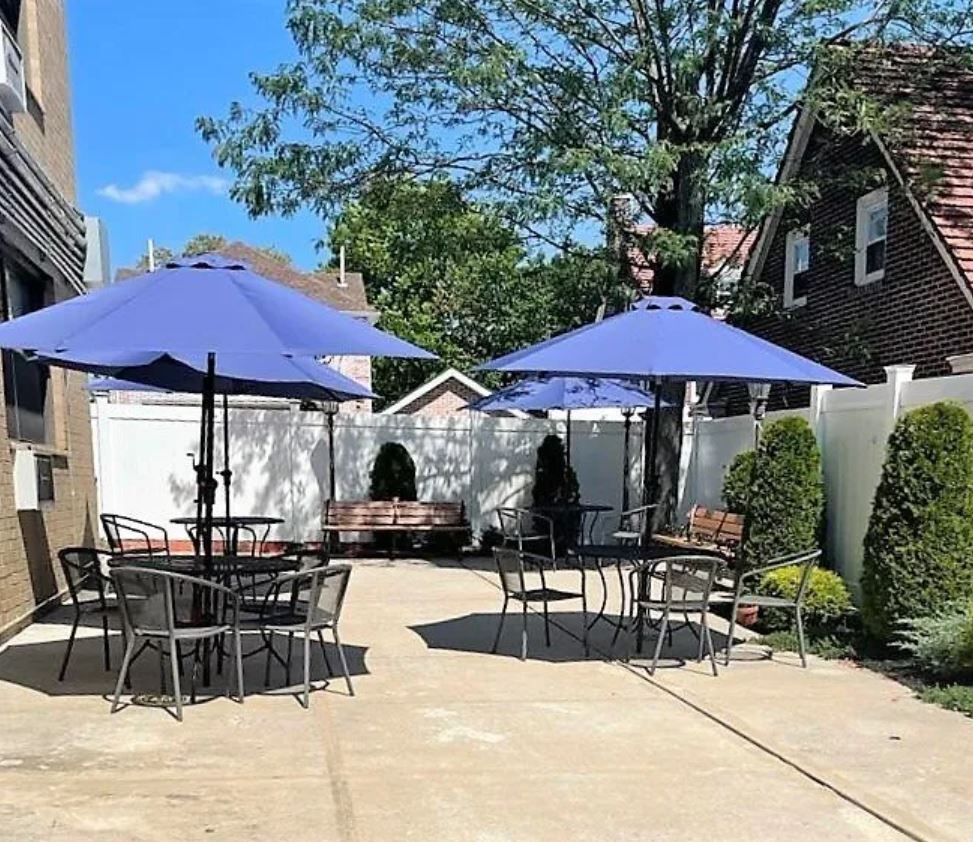
May offer a more intimate, personalized care environment.
That suggests steady demand, but availability may be limited.
Most residents stay for extended periods and receive ongoing daily care.
26% of new residents, usually for short-term rehab.
2% of new residents, often for short stays.
72% of new residents, often for long-term daily care.
The portion of the home's budget spent on staff, including nurses, caregivers, and other employees who support care and operations.
All remaining costs needed to run the home, such as food, utilities, building maintenance, supplies and administrative expenses.
Hollis Park Manor is legally operated by Hollis Park Manor Nursing Home, Inc (For Profit).
In New York, the Department of Health, Office of Aging and Long Term Care performs unannounced onsite inspections to monitor compliance with state and federal healthcare regulations.
4 with citations, 1 without citations
6 on-site complaint investigations
New York average: 9 inspections (5 with citations), 15 on-site complaint investigations
36 complaints per 100 occupied beds
New York average: 49.9 complaints per 100 occupied beds
Formal expressions of dissatisfaction or concern made by residents, or their families regarding various aspects of the care, services, and environment provided.
New York average: 93 complaints
Citations indicate regulatory violations. A higher number implies the facility had several areas requiring improvement.
New York average: 29 citations
New York average: 20 health citations
New York average: 4 life safety citations
Deficiencies indicate regulatory issues. A higher number implies the facility had several areas requiring improvement.
Penalties or interventions imposed by state regulators when facilities do not comply with quality, safety or regulatory standards.
New York average 3.6
Last Health inspection on Jan 2024
Health citations are formal notices following inspections when they fail to comply with safety and care standards.
All 12 citations resulted from standard inspections.
New York average: 0.2
New York average: 0.2
Data sourced from CMS Health Deficiencies reports. Citation severity codes range from A (least serious) to L (most serious). Immediate Jeopardy (J-L) citations indicate situations where the facility's noncompliance has placed residents at risk of death or serious harm.
Assisted Living For seniors needing help with daily tasks but not full-time nursing.
Nursing Homes 24/7 care needed
Assisted Living For seniors needing help with daily tasks but not full-time nursing.
Nursing Homes 24/7 care needed
Assisted Living For seniors needing help with daily tasks but not full-time nursing.
Hospice Care
Nursing Homes 24/7 care needed
Memory Care Specialized care for those with Memory Loss, Alzheimer's, or dementia, ensuring safety and support.
Nursing Homes 24/7 care needed
Respite Care
Nursing Home 24/7 care needed
Assisted Living For seniors needing help with daily tasks but not full-time nursing.
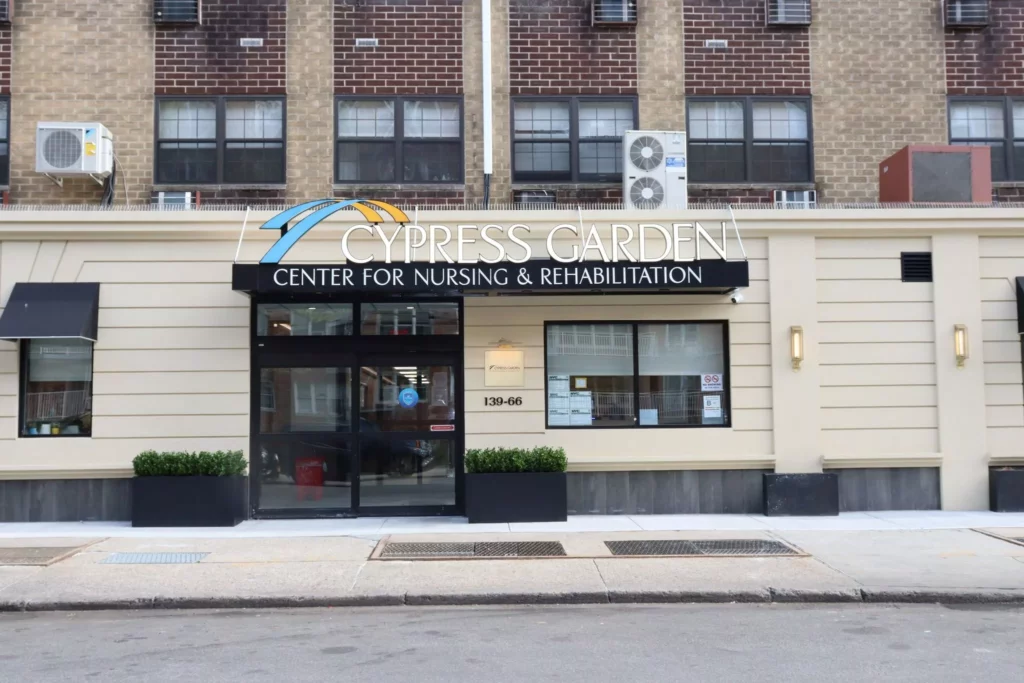 Cypress Garden Center for Nursing & Rehabilitation
  Hollis Park Manor
 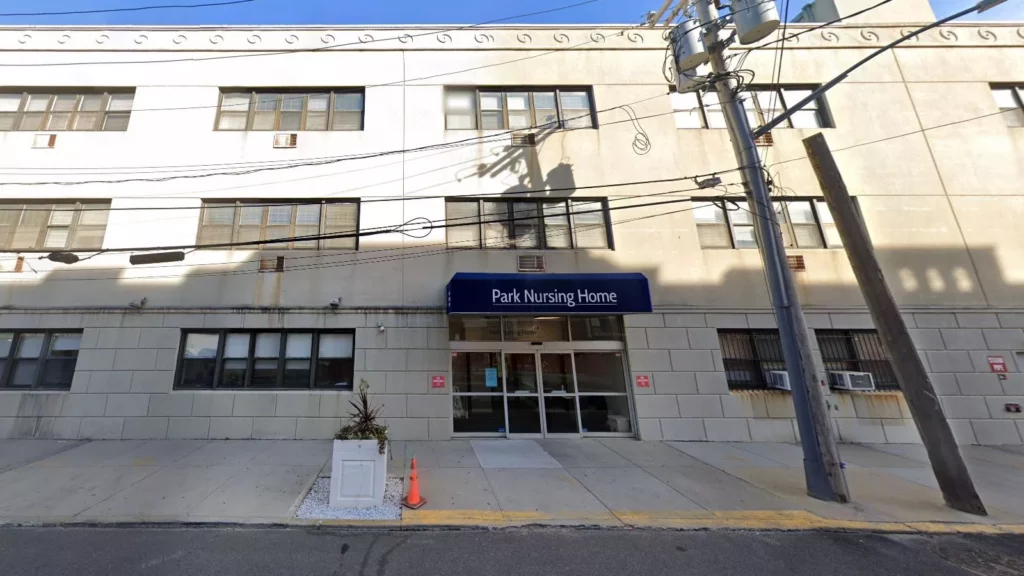 Park Nursing Home
  Little Neck Care Center
  Rego Park Health Care
![]() 2.1 miles from city center — 3.63 miles to nearest hospital (NewYork-Presbyterian Queens Hospital)
2.1 miles from city center — 3.63 miles to nearest hospital (NewYork-Presbyterian Queens Hospital)
![]() 19106 Hillside Ave., Queens, NY 11423
19106 Hillside Ave., Queens, NY 11423
Add your location
Source: CMS Payroll-Based Journal (Q2 2025)
| Role ⓘ | Count ⓘ | Avg Shift (hrs) ⓘ | Uses Contractors? ⓘ |
|---|---|---|---|
| Registered Nurse | 34 | 6.4 | Yes |
| Licensed Practical Nurse | 8 | 6.1 | Yes |
| Certified Nursing Assistant | 51 | 6.9 | Yes |
| Role ⓘ | Employees ⓘ | Contractors ⓘ | Total Staff ⓘ | Total Hours ⓘ | Days Worked ⓘ | % of Days ⓘ | Avg Shift (hrs) ⓘ |
|---|---|---|---|---|---|---|---|
| Certified Nursing Assistant | 47 | 4 | 51 | 16,668 | 91 | 100% | 6.9 |
| Registered Nurse | 28 | 6 | 34 | 8,893 | 91 | 100% | 6.4 |
| Licensed Practical Nurse | 7 | 1 | 8 | 2,181 | 91 | 100% | 6.1 |
| Other Dietary Services Staff | 2 | 0 | 2 | 887 | 78 | 86% | 7.3 |
| Dental Services Staff | 2 | 0 | 2 | 715 | 65 | 71% | 5.5 |
| Physical Therapy Aide | 0 | 4 | 4 | 687 | 65 | 71% | 5.8 |
| Respiratory Therapy Technician | 0 | 2 | 2 | 536 | 78 | 86% | 6.5 |
| Administrator | 1 | 0 | 1 | 488 | 65 | 71% | 7.5 |
| Occupational Therapy Aide | 0 | 1 | 1 | 327 | 42 | 46% | 7.8 |
| Qualified Social Worker | 1 | 0 | 1 | 260 | 65 | 71% | 4 |
| Dietitian | 0 | 1 | 1 | 260 | 65 | 71% | 4 |
| Speech Language Pathologist | 0 | 3 | 3 | 231 | 53 | 58% | 3.5 |
| Physical Therapy Assistant | 0 | 1 | 1 | 140 | 25 | 27% | 5.6 |
| Medical Director | 0 | 1 | 1 | 130 | 65 | 71% | 2 |
| Occupational Therapy Assistant | 0 | 1 | 1 | 42 | 3 | 3% | 14 |
Source: CMS Long-Term Care Facility Characteristics (Data as of Jan 2026)
Residents meet regularly to discuss policies, care quality, and activities
Family members meet regularly to discuss policies, care quality, and activities
Organized group of family members that meets regularly to discuss facility policies, resident care, and activities.
Organized group of residents that meets regularly to discuss facility policies, quality of life, and activities.
Data sourced from CMS Long-Term Care Facility Characteristics quarterly report. Payer mix reflects the current resident census by primary payment source.
These measures show how residents usually do over time at this home, based on health outcomes and preventive care.
New York average: 9.8
New York average: 18.1
New York average: 16.4%
New York average: 16.6%
New York average: 21.4%
New York average: 3.0%
New York average: 7.2%
New York average: 1.4%
New York average: 6.1%
New York average: 18.1%
New York average: 12.6%
New York average: 91.4%
New York average: 95.2%
New York average: 1.71
New York average: 1.35
New York average: 76.6%
New York average: 1.3%
New York average: 78.8%
New York average: 20.6%
New York average: 9.7%
New York average: 0.8%
New York average: 53.7%
New York average: 50.6%
Quality measures are calculated from Minimum Data Set (MDS) assessments. For most measures, lower percentages indicate better care quality.
Historical financial and operational data for Hollis Park Manor based on CMS SNF Cost Reports.
Loading trend charts...
Care Cost Calculator: See Prices in Your Area
Nursing Home Data Explorer
Don’t Wait Too Long: 7 Red Flag Signs Your Parent Needs Assisted Living Now
The True Cost of Assisted Living in 2025 – And How Families Are Paying For It
Understanding Senior Living Costs: Pricing Models, Discounts & Financial Assistance

Touring a community? Use this expert-backed checklist to stay organized, ask the right questions, and find the perfect fit.
We'll send you a PDF version of the touring checklist.


