Holy Cross Village-Notre Dame
Nursing Home · South Bend, IN
CMS overall rating Info The Overall CMS Rating is scored from 1 to 5 stars and combines results from health inspections, staffing levels, and quality measures. Health inspections carry the most weight. Staffing and quality scores can increase or decrease the final rating based on performance compared to state and national standards.

Holy Cross Village-Notre Dame

Nursing Home · South Bend, IN
CMS overall rating Info The Overall CMS Rating is scored from 1 to 5 stars and combines results from health inspections, staffing levels, and quality measures. Health inspections carry the most weight. Staffing and quality scores can increase or decrease the final rating based on performance compared to state and national standards.
Calculator: See prices in your area
Holy Cross Village-Notre Dame accepts Medicare, Medicaid, and private pay.

Overview of Holy Cross Village-notre Dame

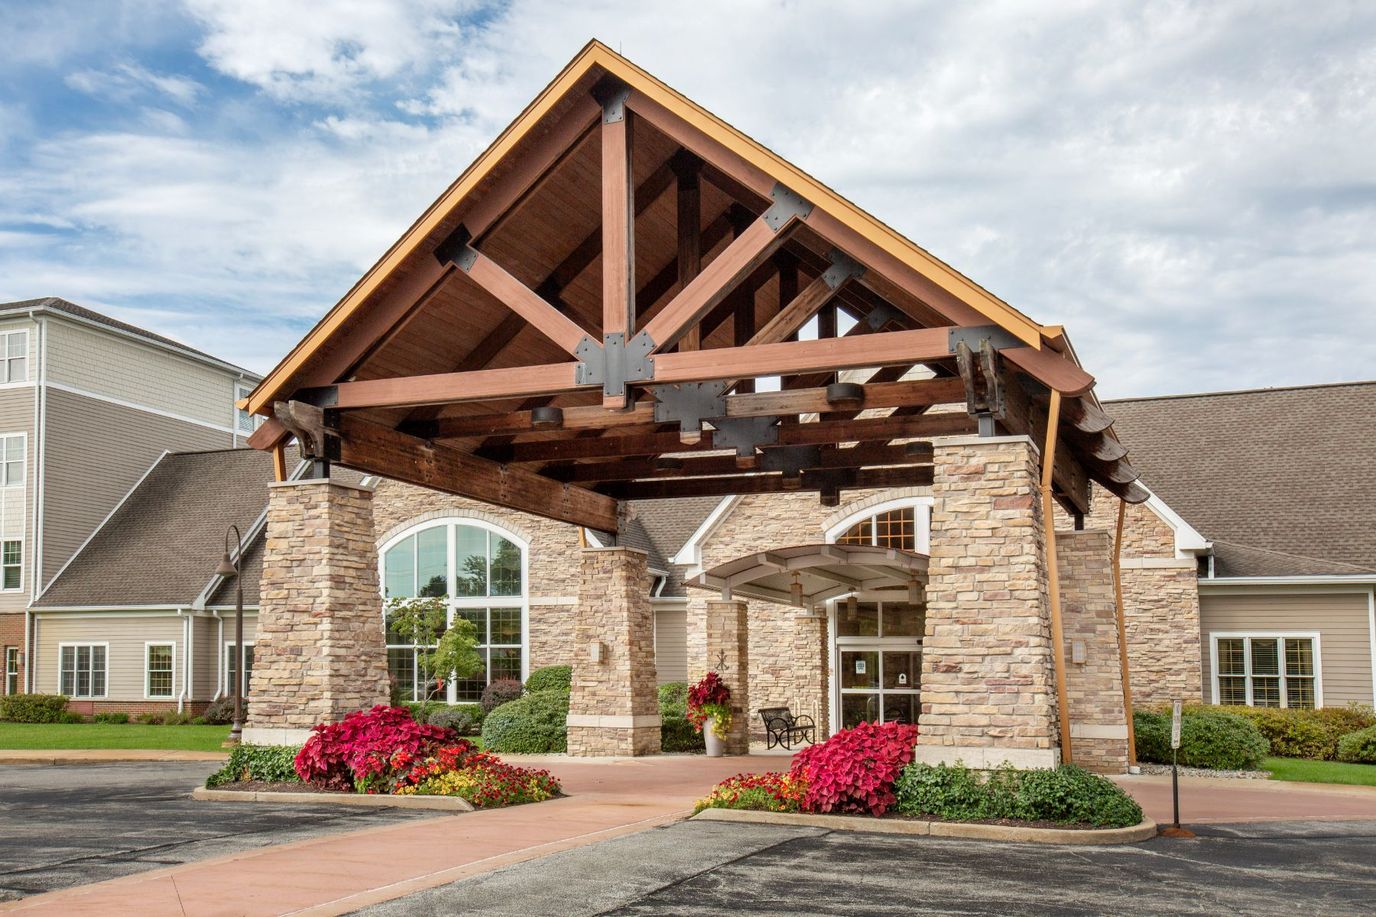
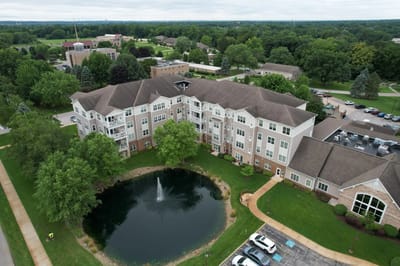
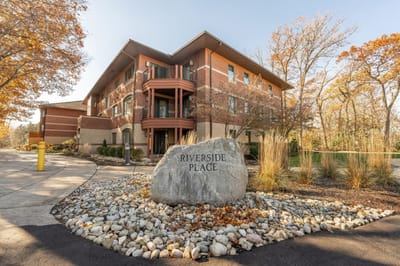
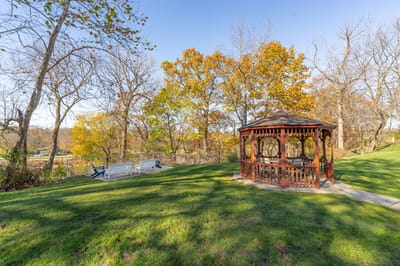
Holy Cross Village in Notre Dame is an expansive senior living community offering independent living, assisted living, and memory care. Also specializing in long-term care and short-term rehabilitation, the nursing home center is a comfortable and accommodating place with the services and features awaiting discovery. Many families have trusted Holy Cross Village over the years because of its services delivered with compassion, kindness, and professionalism.
Residents receive a range of services and access to amenities such as housekeeping, therapy, ADLs, mobility assistance, specialized programs, delicious meals served at the dining area, scheduled outings, and recreational activities in common areas are all offered.

Quality ratings

Measured by Centers for Medicare & Medicaid Services (CMS)

Overall rating Info The Overall CMS Rating combines results from health inspections, staffing levels and quality measures. Health inspections carry the most weight. Staffing and quality scores can increase or decrease the final rating based on performance compared to state and national standards.
▼ 2.8% Below IN avg.
Health Inspection Info Based on the results of the facility's three most recent standard inspections and any complaint investigations. CMS reviews the number, scope, and severity of deficiencies, with more recent findings weighted more heavily.
▲ 42.5% Above IN avg.
Staffing Info Measures average nursing staff hours per resident per day, including Registered Nurses (RNs) and total nursing staff. Ratings are adjusted based on the level of care residents require and are compared to state and national benchmarks.
▼ 59.3% Below IN avg.
Quality Measures Info Based on clinical and physical health indicators reported to CMS, such as hospital readmissions, falls, pressure ulcers, and improvements in mobility. These measures reflect how well residents' health needs are being managed.
▼ 26.6% Below IN avg.

Staffing hours breakdown

Info Daily nursing hours per resident by staff type, reported to CMS. Higher is generally better — compare this facility to state and national averages to see where staffing stands.

Hours per resident per day — compared to Indiana state averages

Staff typeHours / dayvs state avg
Registered Nurse (RN) Info RNs hold the highest nursing license and can assess residents, interpret test results, and direct care plans. More RN hours per day often signals stronger clinical oversight and faster response to health changes. 57m per day ▲ 42% State avg: 40m per day · National avg: 41m per day
LPN / LVN Info Licensed Practical Nurses (LPNs) or Licensed Vocational Nurses (LVNs) deliver routine hands-on care — medication administration, wound dressing, and monitoring vital signs. They work under RN supervision and make up a large share of daily bedside care. 46m per day ■ Avg State avg: 46m per day · National avg: 52m per day
Nurse Aide Info Certified Nurse Aides (CNAs) provide the most direct day-to-day assistance: bathing, dressing, feeding, and mobility. Nurse aide hours are typically the largest staffing category and directly affect residents' quality of life. 3h 13m per day ▲ 42% State avg: 2h 16m per day · National avg: 2h 21m per day
Total Nursing (Weekend) Info Combined nursing hours (RN + LPN + Nurse Aide) per resident per day on weekends. Staffing often drops on weekends — this figure reveals whether the facility maintains adequate coverage outside of weekday hours. 4h 27m per day ▲ 38% State avg: 3h 14m per day · National avg: 3h 26m per day
Physical Therapist Info Hours per resident per day provided by licensed Physical Therapists (PTs) or PT Assistants. PT services help residents recover mobility after injury or illness and are especially important for post-acute (short-stay) rehabilitation. 8m per day ▲ 100% State avg: 4m per day · National avg: 4m per day
RN (Weekend) Info Registered nurse hours specifically on weekends. Facilities sometimes reduce RN presence on Saturdays and Sundays — a low weekend RN figure compared to weekday hours can indicate reduced clinical oversight when most administrative staff are absent. 46m per day ▲ 70% State avg: 27m per day · National avg: 29m per day

Capacity and availability

This home usually has availability

Occupancy lower than 85% suggests more openings may be available.

Higher occupancy than the Indiana average: 69.4%
Occupancy rate 74.7%
Avg. Length of Stay 230 days
Occupancy rate
74.7%
Avg. Length of Stay
230 days

Who this home usually serves

TYPE OF STAY

Mostly short-term rehab stays

Most residents typically stay for a few weeks or months before returning home or moving on.

Breakdown by payment type

Medicare

97% of new residents, usually for short-term rehab.

Typical stay 19 days

Private pay

2% of new residents, often for short stays.

Typical stay 30 years

Medicaid

1% of new residents, often for long-term daily care.

Typical stay 6 years

Finances and operations

Voluntary non-profit community
Home revenue
$22.1M
Surplus of revenue
$730.1K
Voluntary non-profit community
Home revenue
$22.1M
Surplus of revenue
$730.1K
Payroll costs Info The portion of the home's budget spent on staff, including nurses, caregivers, and other employees who support care and operations.
$8.4M
37.9% of revenue
Other operating costs Info All remaining costs needed to run the home, such as food, utilities, building maintenance, supplies and administrative expenses.
$13.0M
Total costs $21.3M
Walk Score
Walk Score: 16 / 100
Car-dependent. Most errands require a car, with limited nearby walkable options.

About this community

Therapy & Rehabilitation

3 services
Rehabilitation Services
Respite Care
Short-Term Rehab

Additional Services

2 services
Long Term & Memory Care
Skilled Nursing & Therapy

Contact Holy Cross Village-Notre Dame

Health Inspection History

Inspections
Total health inspections 4

Indiana average 6


Last Health inspection on Sep 2024

Total health citations
14

Indiana average 25

Citations per inspection
3.5

Indiana average 4.12


Health citations are formal notices following inspections when they fail to comply with safety and care standards.

12 of 14 citations resulted from standard inspections; and 2 of 14 resulted from complaint investigations.

Breakdown of citation severity (last 3 years)
Critical Health citations More info
0
100% better than Indiana average

Indiana average: 0.2


Serious Health citations More info 1
67% worse than Indiana average

Indiana average: 0.6

0 critical citations More info Indiana average: 0.2

1 serious citation More info Indiana average: 0.6

13 moderate citations More info Indiana average: 23.8

0 minor citations More info Indiana average: 0.4
Citations history (last 3 years)
Quality of Care serious citation Info Issues related to how well residents receive appropriate treatment and support for their medical and daily care needs. Sep 27, 2024
Corrected

Abuse/Neglect moderate citation Info Issues related to protecting resident's from harm, including abuse, neglect, or mistreatment. Jun 26, 2024
Corrected

Nutrition moderate citation Info Issues related to food quality, meal service, and resident's nutritional needs. Mar 25, 2024
Corrected

Pharmacy moderate citation Info Issues related to medication management, including how drugs are stored, administered, and monitored. Mar 25, 2024
Corrected

Financial Assistance for
Nursing Home in Indiana

Holy Cross Village-Notre Dame is located in Notre Dame, Indiana.
Here are the financial assistance programs available to residents in Indiana.

Get Financial aid guidance

Aged and Disabled Waiver

Indiana Medicaid A&D Waiver

Age 65+ or disabled
General Indiana resident, Medicaid-eligible, nursing home-level care need.
Income Limits (2025) ~$2,829/month 300% FBR, individual
Asset Limits $2,000 (individual), $3,000 (couple).
IN

Requires level-of-care determination.

Benefits
Personal care (5-7 hours/day) Respite (240 hours/year) Adult day care (~$60/day) Home health services

CHOICE Program

Indiana CHOICE

Age 60+
General Indiana resident, at risk of nursing home.
Income Limits ~$2,000/month varies
Asset Limits $10,000 individual
IN

Limited funding; regional variation.

Benefits
In-home care (3-5 hours/week) Respite (up to 10 days/year) Transportation (~5 trips/month)

Residential Care Assistance Program (RCAP)

Indiana Residential Care Assistance Program

Age 65+
General or blind, or disabled, Indiana resident, in approved facility, low-income or SSI recipient.
Income Limits (2025) ~$1,004/month including SSI
Asset Limits $2,000 (individual), $3,000 (couple).
IN

~50 facilities statewide; per diem rate set by FSSA.

Benefits
Room/board Laundry Minimal care coordination (~$20-$50/day subsidy)

Medicare Savings Program (MSP)

Indiana Medicare Savings Program

Age 65+ or disabled
General Indiana resident, Medicare Part A/B.
Income Limits (2025) ~$2,510/month (QMB), ~$3,380/month (SLMB), ~$3,598/month (QI)—individual.
Asset Limits $9,430 (individual), $14,130 (couple).
IN

Three tiers; no waitlist.

Benefits
Covers Part B premiums ($174.70/month) Deductibles ($240/year) Copays (~20%)

National Family Caregiver Support Program (NFCSP) Respite

Indiana NFCSP Respite Care

Age
General Caregivers of 60+ needing care or 55+ caregivers of others; Indiana resident; functional needs (2+ ADLs).
Income Limits (2025) Prioritizes ~$24,980/year (individual); no strict cap.
Asset Limits Not assessed; need-based.
IN

16 AAAs; prioritizes low-income, rural caregivers.

Benefits
Respite (4-6 hours/week or 5 days/year) Adult day care ($60/day) Caregiver training

VA Aid and Attendance (A&A) and Housebound Benefits

Indiana VA Aid and Attendance/Housebound

Age 65+ or disabled veteran/spouse
General Indiana resident, wartime service, need for ADL help (A&A) or homebound.
Income Limits (2025) Net income < ~$1,984/month (veteran with dependent, A&A); pension offsets income.
Asset Limits ~$155,356 net worth limit
IN

High veteran demand statewide.

Benefits
Cash (~$1,433-$2,642/month veteran, ~$951-$1,318 spouse) for care costs (e.g., in-home, assisted living)

Places of interest near Holy Cross Village-Notre Dame

Address 0.7 miles from city center Info Estimated distance in miles from Notre Dame's city center to Holy Cross Village-Notre Dame's address, calculated via Google Maps.

Calculate Travel Distance to Holy Cross Village-Notre Dame

Add your location

Address

Staffing Data (Q2 2025)

This data corresponds to Q2 2025 and is based on CMS Payroll-Based Journal.

Total staff 143
Employees 72
Contractors 71
Staff to resident ratio 3.18:1
3177678% better than Indiana average

Indiana average ratio: 0.00:1

Avg staff/day 39
Average shift 7.2 hours
6% worse than Indiana average

Indiana average: 7.7 hours

Total staff hours (quarter) 25,513

Nursing staff breakdown

Registered Nurse

Manages medical care and health needs.

Total count 21
Average shift length Info Average shift length. Calculated as total hours divided by days worked and average staff per day. 8.1 hours

This role is partially covered by contractors.

Licensed Practical Nurse

Assists with medical care and medications.

Total count 26
Average shift length Info Average shift length. Calculated as total hours divided by days worked and average staff per day. 7.4 hours

This role is partially covered by contractors.

Certified Nursing Assistant

Helps with daily care and mobility.

Total count 59
Average shift length Info Average shift length. Calculated as total hours divided by days worked and average staff per day. 7.7 hours

This role is partially covered by contractors.

Contractor staffing

Total hours from contractors

15.7%

3,995 contractor hours this quarter

Certified Nursing Assistant: 21 Licensed Practical Nurse: 21 Registered Nurse: 10 Physical Therapy Aide: 4 Speech Language Pathologist: 4 Physical Therapy Assistant: 3 Occupational Therapy Aide: 2 Respiratory Therapy Technician: 2 Occupational Therapy Assistant: 2 Medical Director: 1 Qualified Social Worker: 1

Staff by category

Certified Nursing Assistant38215912,31291100%7.7
Registered Nurse1110212,98591100%8.1
Licensed Practical Nurse521262,41791100%7.4
Medication Aide/Technician4041,4469099%8.4
Other Dietary Services Staff5051,0018593%5.9
RN Director of Nursing2029686470%8
Clinical Nurse Specialist3037687582%7.3
Physical Therapy Aide0445976571%5.7
Administrator1014886167%8
Respiratory Therapy Technician0224516673%4.2
Mental Health Service Worker1014325459%8
Nurse Practitioner1014245358%8
Physical Therapy Assistant0333196470%4.8
Speech Language Pathologist0443135864%3.5
Dietitian1012285763%4
Qualified Social Worker0112145459%4
Occupational Therapy Aide0221072123%5.1
Medical Director011261314%2
Occupational Therapy Assistant022181011%1.8
59 Certified Nursing Assistant
% of Days 100%
21 Registered Nurse
% of Days 100%
26 Licensed Practical Nurse
% of Days 100%
4 Medication Aide/Technician
% of Days 99%
5 Other Dietary Services Staff
% of Days 93%
2 RN Director of Nursing
% of Days 70%
3 Clinical Nurse Specialist
% of Days 82%
4 Physical Therapy Aide
% of Days 71%
1 Administrator
% of Days 67%
2 Respiratory Therapy Technician
% of Days 73%
1 Mental Health Service Worker
% of Days 59%
1 Nurse Practitioner
% of Days 58%
3 Physical Therapy Assistant
% of Days 70%
4 Speech Language Pathologist
% of Days 64%
1 Dietitian
% of Days 63%
1 Qualified Social Worker
% of Days 59%
2 Occupational Therapy Aide
% of Days 23%
1 Medical Director
% of Days 14%
2 Occupational Therapy Assistant
% of Days 11%

Facility Characteristics

Source: CMS Long-Term Care Facility Characteristics (Data as of Jan 2026)

Total residents 45
Medicare
8
17.8% of residents
Medicaid
4
8.9% of residents
Private pay or other
33
73.3% of residents
Programs & Services
Residents Group

Residents meet regularly to discuss policies, care quality, and activities

CCRC

Part of a Continuing Care Retirement Community offering multiple care levels

Active Resident Council

Organized group of residents that meets regularly to discuss facility policies, quality of life, and activities.

Quality of care over time

These measures show how residents usually do over time at this home, based on health outcomes and preventive care.

High-risk clinical events score Info A composite score based on pressure ulcers, falls with injury, weight loss, walking ability decline, and activities of daily living decline. 15.8
97% worse than Indiana average

Indiana average: 8.0

Functional decline score Info A composite score based on activities of daily living decline, walking ability decline, and incontinence. 31.1
82% worse than Indiana average

Indiana average: 17.1

Long-stay resident measures
Average Info CMS star rating based on long-stay quality measure performance. 5 stars = significantly above average, 1 star = significantly below average.
Need for Help with Daily Activities Increased Info Percent of long-stay residents whose need for help with daily activities has increased 27.2%
126% worse than Indiana average

Indiana average: 12.0%

Walking Ability Worsened Info Percent of long-stay residents whose ability to move independently worsened 31.6%
120% worse than Indiana average

Indiana average: 14.4%

Low Risk Residents with Bowel/Bladder Incontinence Info Percent of low risk long-stay residents who lose control of their bowels or bladder 34.5%
40% worse than Indiana average

Indiana average: 24.6%

Falls with Major Injury Info Percent of long-stay residents experiencing one or more falls with major injury 8.1%
110% worse than Indiana average

Indiana average: 3.9%

High Risk Residents with Pressure Ulcers Info Percent of long-stay high risk residents with pressure ulcers 9.0%
105% worse than Indiana average

Indiana average: 4.4%

Urinary Tract Infection Info Percent of long-stay residents with a urinary tract infection 4.1%
241% worse than Indiana average

Indiana average: 1.2%

Lost Too Much Weight Info Percent of long-stay residents who lose too much weight 3.1%
46% better than Indiana average

Indiana average: 5.7%

Depressive Symptoms Info Percent of long-stay residents who have depressive symptoms 0.0%
100% better than Indiana average

Indiana average: 24.1%

Antipsychotic Use Info Percent of long-stay residents who received an antipsychotic medication 1.4%
89% better than Indiana average

Indiana average: 12.4%

Pneumococcal Vaccine Info Percent of long-stay residents assessed and appropriately given the pneumococcal vaccine 99.3%
6% better than Indiana average

Indiana average: 93.7%

Influenza Vaccine Info Percent of long-stay residents assessed and appropriately given the seasonal influenza vaccine 100.0%
5% better than Indiana average

Indiana average: 95.4%

Hospitalizations per 1,000 days Info Number of hospitalizations per 1,000 long-stay resident days. 1.52
5% better than Indiana average

Indiana average: 1.60

ED visits per 1,000 days Info Number of outpatient emergency department visits per 1,000 long-stay resident days. 0.50
66% better than Indiana average

Indiana average: 1.48

Short-stay resident measures
Below average Info CMS star rating based on short-stay quality measure performance. 5 stars = much above average, 1 star = much below average.
Pneumococcal Vaccine Info Percent of short-stay residents assessed and appropriately given the pneumococcal vaccine 91.3%
12% better than Indiana average

Indiana average: 81.7%

Antipsychotic medication increase Info Percent of short-stay residents who newly received an antipsychotic medication 0.5%
62% better than Indiana average

Indiana average: 1.4%

Influenza Vaccine Info Percent of short-stay residents assessed and appropriately given the seasonal influenza vaccine 92.9%
18% better than Indiana average

Indiana average: 79.0%

Re-hospitalized after SNF stay Info Percentage of short-stay residents who were re-hospitalized after their nursing home admission. 31.0%
38% worse than Indiana average

Indiana average: 22.4%

Emergency department visits Info Percentage of short-stay residents who had an outpatient emergency department visit. 9.5%
10% better than Indiana average

Indiana average: 10.5%

Falls with major injury Info Percentage of SNF residents who experience falls with major injury during their stay. 3.7%
381% worse than Indiana average

Indiana average: 0.8%

Ability to care for self at discharge Info Percentage of residents at or above expected ability to care for themselves at discharge. 42.4%
21% worse than Indiana average

Indiana average: 53.7%

Successful return to home or community Info Rate of successful return to home or community from a skilled nursing facility. 48.9%
In line with Indiana average

Indiana average: 50.6%

Penalties and fines

Federal penalties imposed by CMS for regulatory violations, including civil money penalties (fines) and denials of payment for new Medicare/Medicaid admissions.

Source: CMS Penalties Database

No penalties in the past 3 years

No civil money penalties or payment denials were reported in the last 3 years.

Compare Nursing Home around South Bend

The information below is reported by the Indiana Department of Health, Division of Long Term Care.

3 facilities compared · CMS & IN Dept. of Health data · Updated May 2026

Filter by care type
Cardinal Nursing and Rehabilitation
NH

Nursing Home Licensed facility providing 24/7 skilled nursing care for residents with complex, ongoing medical needs. Staffed by RNs, LPNs, and CNAs. Inspected and star-rated annually by CMS. Accepts Medicare (short-term rehab) and Medicaid (long-term care).

AL

Assisted Living A licensed, long-term care setting for seniors or individuals with disabilities who need help with daily activities — like bathing, dressing, and medication management — but not 24-hour skilled nursing. Offers housing, meals, and around-the-clock support while aiming to maximize resident independence.

South Bend144 47.4% -32%3.53 -6%+3%1193.8259 75 Kathryn Lape$9.6M$3.8M39.4%155115
Holy Cross Village-Notre Dame
NH

Nursing Home Licensed facility providing 24/7 skilled nursing care for residents with complex, ongoing medical needs. Staffed by RNs, LPNs, and CNAs. Inspected and star-rated annually by CMS. Accepts Medicare (short-term rehab) and Medicaid (long-term care).

AL

Assisted Living A licensed, long-term care setting for seniors or individuals with disabilities who need help with daily activities — like bathing, dressing, and medication management — but not 24-hour skilled nursing. Offers housing, meals, and around-the-clock support while aiming to maximize resident independence.

Notre Dame128 74.7% +8%- +55%-0143.5146 16 Brothers Of Holy Cross Inc$22.1M$6.4M29.1%155745
Briarcliff Health & Rehabilitation Center
NH

Nursing Home Licensed facility providing 24/7 skilled nursing care for residents with complex, ongoing medical needs. Staffed by RNs, LPNs, and CNAs. Inspected and star-rated annually by CMS. Accepts Medicare (short-term rehab) and Medicaid (long-term care).

AL

Assisted Living A licensed, long-term care setting for seniors or individuals with disabilities who need help with daily activities — like bathing, dressing, and medication management — but not 24-hour skilled nursing. Offers housing, meals, and around-the-clock support while aiming to maximize resident independence.

South Bend131 66.4% -4%3.55 -33%+3%1193.8396 7 Briarcliff Health Care - South Bend LLC$12.6M$3.8M29.9%155831

Guides for Better Senior Living

Care Cost Calculator: See Prices in Your Area

Nursing Home Data Explorer

Don’t Wait Too Long: 7 Red Flag Signs Your Parent Needs Assisted Living Now

The True Cost of Assisted Living in 2025 – And How Families Are Paying For It

Understanding Senior Living Costs: Pricing Models, Discounts & Financial Assistance

Frequently Asked Questions about Holy Cross Village-Notre Dame

Is Holy Cross Village-Notre Dame in a walkable area?

Holy Cross Village-Notre Dame has a walk score of 16. Car-dependent. Most errands require a car, with limited nearby walkable options.

What is the address of Holy Cross Village-Notre Dame?

Holy Cross Village-Notre Dame is located at 54515 State Hwy 933, Notre Dame, IN 46556.

What is the phone number of Holy Cross Village-Notre Dame?

(574) 287-1838 will put you in contact with the team at Holy Cross Village-Notre Dame.

Is Holy Cross Village-Notre Dame Medicare or Medicaid certified?

Yes — Holy Cross Village-Notre Dame is a CMS-certified provider of Medicare and Medicaid.

Explore Open Rooms
1 Contact details
2 What type of senior care service are you looking for?
3 What budget do you have in mind for senior care?
4 How soon do you need to find care?
5 Additional details

Thank you for your interest!

Our team will be in touch shortly to help with next steps.