Infinity Care of East Los Angeles
CMS overall rating Info CMS (the Centers for Medicare & Medicaid Services) is the federal agency that rates nursing home quality. Its Overall Rating runs from 1 to 5 stars, combining health inspections, staffing, and quality measures, with inspections weighted most heavily.

Infinity Care of East Los Angeles

CMS overall rating Info CMS (the Centers for Medicare & Medicaid Services) is the federal agency that rates nursing home quality. Its Overall Rating runs from 1 to 5 stars, combining health inspections, staffing, and quality measures, with inspections weighted most heavily.
Calculator: See prices in your area
Infinity Care of East Los Angeles accepts Medicare, Medicaid, and private pay.

Overview of Infinity Care of East Los Angeles

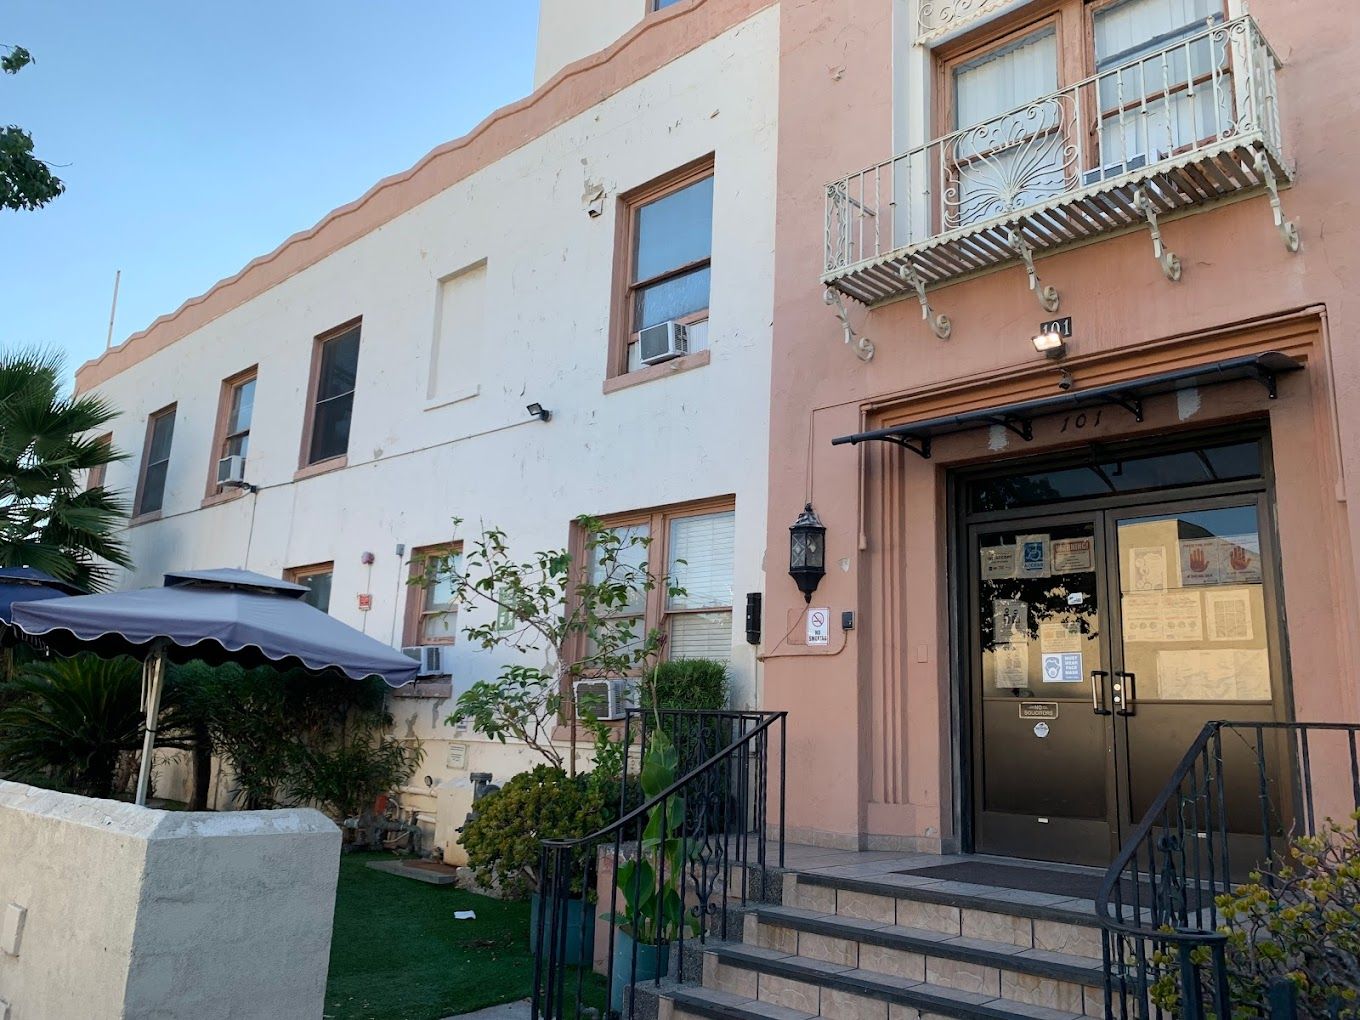
Infinity Care of East Los Angeles is a two-story, 99-bed nursing home at 101 S Fickett St in Central LA. Operated by Infinity Care Of East La, the facility accepts Medicare, Medicaid, and private pay. Dignity Health – California Hospital Medical Center is 3.37 miles away.

Occupancy sits at 77%, with 85 of 99 beds filled. The average stay is 167 days, placing this community in mixed territory between short-term rehab and longer-term nursing care. Nursing care totals 3 hours and 17 minutes per resident per day, broken down as 15 minutes of RN time, 1 hour and 3 minutes of LPN/LVN time, and 2 hours and 18 minutes from nurse aides. Two CMS-recognized programs are in place: a Residents Group and an Active Resident Council, both meeting regularly on care quality, facility policies, and day-to-day life.

The Walk Score is 94. Central LA is dense and transit-connected, and a Walker’s Paradise score here is real; restaurants, shops, and bus lines are close, which matters for visiting family and staff commuting from across the city.

Ninety-nine beds, a mixed short-and-long-stay population, Medicare and Medicaid acceptance, and a highly walkable location in one of Los Angeles’s most transit-accessible neighborhoods: that’s the profile this facility presents.

Quality ratings

Measured by Centers for Medicare & Medicaid Services (CMS)

Overall rating Info The Overall CMS Rating combines results from health inspections, staffing levels and quality measures. Health inspections carry the most weight. Staffing and quality scores can increase or decrease the final rating based on performance compared to state and national standards.
▼ 36.5% Below CA avg. ▼ 36.5% Below CA avg.CA average: 3.1Click the badge to see the full State ranking.Click here to see the full State ranking.
Health Inspection Info Based on the results of the facility's three most recent standard inspections and any complaint investigations. CMS reviews the number, scope, and severity of deficiencies, with more recent findings weighted more heavily.
▼ 64.2% Below CA avg. ▼ 64.2% Below CA avg.CA average: 2.8Click the badge to see the full State ranking.Click here to see the full State ranking.
Staffing Info Measures average nursing staff hours per resident per day, including Registered Nurses (RNs) and total nursing staff. Ratings are adjusted based on the level of care residents require and are compared to state and national benchmarks.
▼ 68.1% Below CA avg. ▼ 68.1% Below CA avg.CA average: 3.1Click the badge to see the full State ranking.Click here to see the full State ranking.
Quality Measures Info Based on clinical and physical health indicators reported to CMS, such as hospital readmissions, falls, pressure ulcers, and improvements in mobility. These measures reflect how well residents' health needs are being managed.
▲ 22.4% Above CA avg. ▲ 22.4% Above CA avg.CA average: 4.1Click the badge to see the full State ranking.Click here to see the full State ranking.

Staffing hours breakdown

Info Daily nursing hours per resident by staff type, reported to CMS. Higher is generally better — compare this facility to state and national averages to see where staffing stands.

Hours per resident per day — compared to California state averages

Total nursing care / resident Info This home is ranked 327th out of 354 homes in California for nurse hours. Total adjusted nursing hours per resident per day, combining RN, LPN, and aide time. CMS adjusts this for case-mix so facilities can be fairly compared.
3h 17m per day
Rank #327 / 354Nurse hours — State benchmarkedThis home is ranked 327th out of 354 homes in California. Shows adjusted nurse hours per resident per day benchmarked to the California average, with a ranking across 354 California facilities. More hours mean more direct care. The national average is about 3.5 hrs; below 3.0 is a red flag.Rankings are based only on facilities in California that report data for that category. Facilities without available data are excluded from the ranking.Click the rank badge to see the full State ranking.Click here to see the full State ranking.
This facility California avg (4h 13m per day)
vs California avg
-22%

6 of 6 metrics below state avg

Staff typeHours / Day / Residentvs state avg
Registered Nurse (RN) Info RNs hold the highest nursing license and can assess residents, interpret test results, and direct care plans. More RN hours per day often signals stronger clinical oversight and faster response to health changes. 15m per day ▼ 62% State avg: 39m per day · National avg: 41m per day
LPN / LVN Info Licensed Practical Nurses (LPNs) or Licensed Vocational Nurses (LVNs) deliver routine hands-on care — medication administration, wound dressing, and monitoring vital signs. They work under RN supervision and make up a large share of daily bedside care. 1h 3m per day ▼ 14% State avg: 1h 13m per day · National avg: 52m per day
Nurse Aide Info Certified Nurse Aides (CNAs) provide the most direct day-to-day assistance: bathing, dressing, feeding, and mobility. Nurse aide hours are typically the largest staffing category and directly affect residents' quality of life. 2h 18m per day ▼ 13% State avg: 2h 38m per day · National avg: 2h 20m per day
Weekend Total Nursing Info Combined nursing hours (RN + LPN + Nurse Aide) per resident per day on weekends. Staffing often drops on weekends — this figure reveals whether the facility maintains adequate coverage outside of weekday hours. 3h 24m per day ▼ 17% State avg: 4h 5m per day · National avg: 3h 26m per day
Physical Therapist Info Hours per resident per day provided by licensed Physical Therapists (PTs) or PT Assistants. PT services help residents recover mobility after injury or illness and are especially important for post-acute (short-stay) rehabilitation. 1m per day ▼ 90% State avg: 5m per day · National avg: 4m per day
Weekend RN Info Registered nurse hours specifically on weekends. Facilities sometimes reduce RN presence on Saturdays and Sundays — a low weekend RN figure compared to weekday hours can indicate reduced clinical oversight when most administrative staff are absent. 10m per day ▼ 65% State avg: 30m per day · National avg: 28m per day

Capacity and availability

This home usually has availability

Lower occupancy than the California average: 84.7%
Occupancy rate
77% Rank #764 / 1537Occupancy rate — State benchmarkedThis home is ranked 764th out of 1537 homes in California. Shows this facility's occupancy rate versus the California average, with its Statewide rank out of 1537. Higher occupancy signals strong local demand and financial stability.Rankings are based only on facilities in California that report data for that category. Facilities without available data are excluded from the ranking.Click the rank badge to see the full State ranking.Click here to see the full State ranking.
Avg. Length of Stay
167 days
Bed community size
99-bed community Rank #725 / 1657Bed count — State benchmarkedThis home is ranked 725th out of 1657 homes in California. Shows this facility's certified or reported bed count compared to other California facilities. Larger communities may offer more amenities, programs, and on-site services for residents and families.Rankings are based only on facilities in California that report data for that category. Facilities without available data are excluded from the ranking.Click the rank badge to see the full State ranking.Click here to see the full State ranking.
A larger shared setting that may offer more common spaces and organized community services.
Walk Score
Walk Score: 94 / 100 Rank #87 / 2092Walk Score — State benchmarkedThis home is ranked 87th out of 2092 homes in California. Shows how walkable this facility's neighborhood is compared to the average Walk Score across California facilities. Higher scores benefit residents, families, and staff.Rankings are based only on facilities in California that report data for that category. Facilities without available data are excluded from the ranking.Click the rank badge to see the full State ranking.Click here to see the full State ranking.
Walker's paradise. Daily errands do not require a car, with many shops and services nearby.

Contact Infinity Care of East Los Angeles

Staffing Data

Reporting period: October 1 – December 31, 2025 (Q4 2025). Source: CMS Payroll-Based Journal report.

Total staff 120
Employees 70
Contractors 50
Staff to resident ratio 1.41 : 1
22% fewer staff per resident than California average
California average ratio: 1.81 : 1 California average ratio: 1.81 : 1See full California ranking
Avg staff/day 47
Average shift 7.8 hours
0% compared with California average
California average: 7.7 hours California average shift: 7.7 hoursSee full California ranking
Total staff hours (quarter) 33,784

Nursing staff breakdown

Q4 2025 · Oct 1 – Dec 31 More info This data comes from the CMS Payroll-Based Journal report covering October 1 – December 31, 2025.
Registered Nurse

Manages medical care and health needs.

RN Staff Info All 6 RN Staff are full-time employees. No contractors work on this role. 6
Average shift length Info Average shift length. Calculated as total hours divided by days worked and average staff per day. 7.6 hours
Licensed Practical Nurse

Assists with medical care and medications.

LPN Staff Info 25 total: 18 full-time employees and 7 contractors. 25
Average shift length Info Average shift length. Calculated as total hours divided by days worked and average staff per day. 7.9 hours
Certified Nursing Assistant

Helps with daily care and mobility.

CNA Staff Info 64 total: 34 full-time employees and 30 contractors. 64
Average shift length Info Average shift length. Calculated as total hours divided by days worked and average staff per day. 8.2 hours

Contractor staffing

Q4 2025 · Oct 1 – Dec 31 More info This data comes from the CMS Payroll-Based Journal report covering October 1 – December 31, 2025.

Total hours from contractors

15.1%

5,117 contractor hours this quarter

Certified Nursing Assistant: 30 Licensed Practical Nurse: 7 Speech Language Pathologist: 5 Physical Therapy Aide: 4 Qualified Social Worker: 2 Respiratory Therapy Technician: 1 Physical Therapy Assistant: 1

Staff by category

Q4 2025 · Oct 1 – Dec 31 More info This data comes from the CMS Payroll-Based Journal report covering October 1 – December 31, 2025.
Certified Nursing Assistant34306418,33892100%8.2
Licensed Practical Nurse187257,32192100%7.9
Registered Nurse6061,3159199%7.6
Physical Therapy Aide0441,2606773%7
Speech Language Pathologist0551,2506874%5.9
RN Director of Nursing3031,0487480%7.9
Other Dietary Services Staff3039836166%8
Dental Services Staff2026834347%8.4
Nurse Practitioner1015335459%9.9
Dietitian1013504448%8
Administrator1013284145%8
Qualified Social Worker0221693134%5.4
Clinical Nurse Specialist1011281617%8
Respiratory Therapy Technician011673942%1.7
Physical Therapy Assistant0111333%4.3
64 Certified Nursing Assistant
% of Days 100%
25 Licensed Practical Nurse
% of Days 100%
6 Registered Nurse
% of Days 99%
4 Physical Therapy Aide
% of Days 73%
5 Speech Language Pathologist
% of Days 74%
3 RN Director of Nursing
% of Days 80%
3 Other Dietary Services Staff
% of Days 66%
2 Dental Services Staff
% of Days 47%
1 Nurse Practitioner
% of Days 59%
1 Dietitian
% of Days 48%
1 Administrator
% of Days 45%
2 Qualified Social Worker
% of Days 34%
1 Clinical Nurse Specialist
% of Days 17%
1 Respiratory Therapy Technician
% of Days 42%
1 Physical Therapy Assistant
% of Days 3%

Penalties and fines

Includes penalties issued in 2025

Federal penalties imposed by CMS for regulatory violations, including civil money penalties (fines) and denials of payment for new Medicare/Medicaid admissions.

Source: CMS Penalties Database (Data as of Jan 2026)

Total fines amount $63K Rank #325 / 362Federal fines — State benchmarkedThis home is ranked 325th out of 362 homes in California. Shows this facility's cumulative CMS federal fine dollars versus the California average among facilities with fines, and where it ranks among 362 facilities in the pool. Lower total dollars mean a better rank.Rankings are based only on facilities in California that report data for that category. Facilities without available data are excluded from the ranking.Click the rank badge to see the full State ranking.Click here to see the full State ranking.
16% higher than California average

California average: $55K

Number of fines 2
15% fewer fines than California average

California average: 2.4

Payment Denials Info Serious action where Medicare and/or Medicaid temporarily stops payments for new residents until issues are fixed. 0
100% fewer payment denials than California average

California average: 0.5

Fines amount comparison
This facility $63K
California average $55K
Penalty History

Penalties are imposed by CMS for violations of federal nursing home regulations.

2 penalties in the past 3 years

Multiple penalties were reported in the last 3 years.

Civil Money Penalty Info Fines imposed for noncompliance, which can be assessed per day or per instance of violation. May 31, 2025
$9K
Civil Money Penalty Info Fines imposed for noncompliance, which can be assessed per day or per instance of violation. May 11, 2025
$54K

Last updated: Jan 2026

Quality of care over time

These measures show how residents usually do over time at this home, based on health outcomes and preventive care.

High-risk clinical events score Info A composite score based on pressure ulcers, falls with injury, weight loss, walking ability decline, and activities of daily living decline. 8.3
25% worse than California average

California average: 6.6

Functional decline score Info A composite score based on activities of daily living decline, walking ability decline, and incontinence. 10.6
7% better than California average

California average: 11.3

Long-stay resident measures
Significantly above average California avg: 4.2 Info CMS star rating based on long-stay quality measure performance. 5 stars = significantly above average, 1 star = significantly below average.
Need for Help with Daily Activities Increased Info Percent of long-stay residents whose need for help with daily activities has increased 14.7%
33% worse than California average

California average: 11.1%

Walking Ability Worsened Info Percent of long-stay residents whose ability to move independently worsened 13.8%
15% worse than California average

California average: 12.0%

Low Risk Residents with Bowel/Bladder Incontinence Info Percent of low risk long-stay residents who lose control of their bowels or bladder 3.2%
72% better than California average

California average: 11.3%

Falls with Major Injury Info Percent of long-stay residents experiencing one or more falls with major injury 2.4%
43% worse than California average

California average: 1.7%

High Risk Residents with Pressure Ulcers Info Percent of long-stay high risk residents with pressure ulcers 5.7%
15% worse than California average

California average: 5.0%

Urinary Tract Infection Info Percent of long-stay residents with a urinary tract infection 3.3%
168% worse than California average

California average: 1.2%

Lost Too Much Weight Info Percent of long-stay residents who lose too much weight 5.0%
18% worse than California average

California average: 4.2%

Depressive Symptoms Info Percent of long-stay residents who have depressive symptoms 0.4%
95% better than California average

California average: 6.7%

Antipsychotic Use Info Percent of long-stay residents who received an antipsychotic medication 1.9%
82% better than California average

California average: 10.1%

Pneumococcal Vaccine Info Percent of long-stay residents assessed and appropriately given the pneumococcal vaccine 100.0%
In line with California average

California average: 98.5%

Influenza Vaccine Info Percent of long-stay residents assessed and appropriately given the seasonal influenza vaccine 100.0%
In line with California average

California average: 98.2%

Hospitalizations per 1,000 days Info Number of hospitalizations per 1,000 long-stay resident days. 2.65
18% worse than California average

California average: 2.25

ED visits per 1,000 days Info Number of outpatient emergency department visits per 1,000 long-stay resident days. 0.36
77% better than California average

California average: 1.59

Short-stay resident measures
Significantly above average California avg: 3.5 Info CMS star rating based on short-stay quality measure performance. 5 stars = much above average, 1 star = much below average.
Pneumococcal Vaccine Info Percent of short-stay residents assessed and appropriately given the pneumococcal vaccine 100.0%
6% better than California average

California average: 94.0%

Antipsychotic medication increase Info Percent of short-stay residents who newly received an antipsychotic medication 0.0%
100% better than California average

California average: 1.5%

Influenza Vaccine Info Percent of short-stay residents assessed and appropriately given the seasonal influenza vaccine 100.0%
7% better than California average

California average: 93.2%

Re-hospitalized after SNF stay Info Percentage of short-stay residents who were re-hospitalized after their nursing home admission. 13.5%
42% better than California average

California average: 23.2%

Emergency department visits Info Percentage of short-stay residents who had an outpatient emergency department visit. 6.1%
46% better than California average

California average: 11.2%

Falls with major injury Info Percentage of SNF residents who experience falls with major injury during their stay. 0.0%
100% better than California average

California average: 0.8%

Ability to care for self at discharge Info Percentage of residents at or above expected ability to care for themselves at discharge. 65.1%
21% better than California average

California average: 53.7%

Successful return to home or community Info Rate of successful return to home or community from a skilled nursing facility. 36.0%
29% worse than California average

California average: 50.6%

Breakdown by payment type

Medicare

45% of new residents, usually for short-term rehab.

Typical stay 1 - 2 months

Private pay

52% of new residents, often for short stays.

Typical stay 8 - 9 months

Medicaid

3% of new residents, often for long-term daily care.

Typical stay 3 - 4 months

Facility Characteristics

Source: CMS Long-Term Care Facility Characteristics (Data as of Jan 2026)

Total residents 85
Medicare
16
18.8% of residents
Medicaid
64
75.3% of residents
Private pay or other
5
5.9% of residents
Programs & Services
Residents Group

Residents meet regularly to discuss policies, care quality, and activities

Active Resident Council

Organized group of residents that meets regularly to discuss facility policies, quality of life, and activities.

Finances and operations

Based on CMS SNF Cost Report for fiscal year ending in 12/2023.

For-profit
Operated by a single business entity.
Net patient revenue Info Net patient revenue — what the home actually collects for resident care, after contractual allowances, bad debt and discounts are subtracted from its gross charges (CMS cost report, Worksheet G-3). It covers resident care only; money the home earns from other sources is shown separately as "Other income."
$9.8M
Net patient income Info Net patient income: net patient revenue minus the home's total operating expenses. A positive figure means it earns more from resident care than it spends to deliver it; a negative figure means the opposite. It excludes non-operating "other income."
-$1.2M
For-profit Operated by a single business entity.
Net patient revenue Info Net patient revenue — what the home actually collects for resident care, after contractual allowances, bad debt and discounts are subtracted from its gross charges (CMS cost report, Worksheet G-3). It covers resident care only; money the home earns from other sources is shown separately as "Other income."
$9.8M Rank #275 / 355Revenue — State benchmarkedThis home is ranked 275th out of 355 homes in California. Shows this facility's annual revenue compared to the California average. Higher revenue generally means more resources for staffing and capital — read alongside Payroll %.Rankings are based only on facilities in California that report data for that category. Facilities without available data are excluded from the ranking.Click the rank badge to see the full State ranking.Click here to see the full State ranking.
Net patient income Info Net patient income: net patient revenue minus the home's total operating expenses. A positive figure means it earns more from resident care than it spends to deliver it; a negative figure means the opposite. It excludes non-operating "other income."
-$1.2M
Other income Info Money the home earns outside of resident care — such as investments, grants, rentals and other non-operating sources (CMS cost report, Worksheet G-3). It is tracked separately from net patient revenue: it is not part of that figure, and it is not included in net patient income.
$76.7K
Payroll costs Info Staff salaries plus wage-related costs — benefits such as payroll taxes, health insurance and retirement — from the home's own accounting records (CMS cost report, Worksheet A). Contract or agency labor is counted separately, under other operating costs. Rank #231 / 355Payroll — State benchmarkedThis home is ranked 231st out of 355 homes in California. Shows total annual staff payroll benchmarked to the California average. Higher payroll investment relative to peers often signals better staffing and less reliance on cheaper contract labor.Rankings are based only on facilities in California that report data for that category. Facilities without available data are excluded from the ranking.Click the rank badge to see the full State ranking.Click here to see the full State ranking.
$5.3M 53.9% of net patient revenue Info Payroll as a share of revenue: staff salaries and wage-related benefits divided by net patient revenue. A higher figure means more of each revenue dollar goes to staff pay. Rank #41 / 355Payroll % — State benchmarkedThis home is ranked 41st out of 355 homes in California. Shows payroll as a percentage of revenue versus the California average. Well-run California facilities typically land around 55–67% — the top third Statewide. Below 25% may signal understaffing or heavy agency use — read with Staffing ratings.Rankings are based only on facilities in California that report data for that category. Facilities without available data are excluded from the ranking.Click the rank badge to see the full State ranking.Click here to see the full State ranking.
Other operating costs Info Everything it costs to run the home apart from payroll — food, utilities, supplies, maintenance, contract labor and administration. Calculated as total operating expense minus payroll (staff salaries and wage-related benefits).
$5.8M
Total costs Info The home's total operating expense for the year — all the costs of running it, salaries included (CMS cost report, Worksheet G-3).
$11.1M

What does this home offer?

Building type icon
Building type icon

Building Type: Two-story

Who this home usually serves

TYPE OF STAY

Mix of rehab and long-term care

This home supports both short-term rehab and long-term care, with residents staying for a wide range of durations.

Most new residents arrive under private pay (52% of admissions), and a typical private pay stay runs around 8 - 9 months.

Admissions
172 total

Coverage residents most often arrive under.

Medicare 45%
Private pay 52%
Medicaid 3%
Discharges
167 total

Coverage residents most often leave under.

Medicare 40%
Private pay 56%
Medicaid 4%

Places of interest near Infinity Care of East Los Angeles

Address 2.4 miles from city center Info Estimated distance in miles from Los Angeles's city center to Infinity Care of East Los Angeles's address, calculated via Google Maps. — 3.37 miles to nearest hospital (Dignity Health - California Hospital Medical Center)

Calculate Travel Distance to Infinity Care of East Los Angeles

Add your location

Address

Compare Nursing Homes around Los Angeles

The information below is reported by the California Department of Social Services and Department of Public Health.

5 facilities compared · CMS & CA Dept. of Health data

Angels Nursing Center
NH
NC
Los Angeles (Westlake)
41
Facility 41
CA AVG 103
Rank #1205 / 1657
90.2%
Facility 90.2%
CA AVG 84.7%
Rank #319 / 1537
+7%
4.73
Facility 4.73
CA AVG 4.22
Rank #69 / 354
-54%+12%
$71.6k
Facility $71.6k
CA AVG $56.5k
Rank #329 / 362
60
Facility 60
CA AVG 81
Rank #1294 / 1401
42
Facility 42
CA AVG 50.2
Rank #184 / 361
3.8
Facility 3.8
CA AVG 4.6
Rank #152 / 361
437A+
92
Facility 92
CA AVG 57
Rank #137 / 2092
Aret Akian
$5.8M
Facility $5.8M
CA AVG $17.0M
Rank #348 / 355
$3.8M
Facility $3.8M
CA AVG $7.0M
Rank #323 / 355
65.6%
Facility 65.6%
CA AVG 45.2%
Rank #5 / 355
55704
Palazzo Post Acute
NH
Los Angeles (East Hollywood)
99
Facility 99
CA AVG 103
Rank #725 / 1657
91.6%
Facility 91.6%
CA AVG 84.7%
Rank #276 / 1537
+8%
4.46
Facility 4.46
CA AVG 4.22
Rank #92 / 354
-25%+6%
$0
Facility $0
CA AVG $56.5k
Rank #1 / 362
-
47
Facility 47
CA AVG 50.2
Rank #214 / 361
2.5
Facility 2.5
CA AVG 4.6
Rank #33 / 361
193A+
91
Facility 91
CA AVG 57
Rank #155 / 2092
Serrano Licensee 1 LLC
$13.0M
Facility $13.0M
CA AVG $17.0M
Rank #160 / 355
$8.5M
Facility $8.5M
CA AVG $7.0M
Rank #178 / 355
65.1%
Facility 65.1%
CA AVG 45.2%
Rank #208 / 355
56456
Grand Park Convalescent Hospital
NH
Los Angeles (Westlake)
151
Facility 151
CA AVG 103
Rank #339 / 1657
87.3%
Facility 87.3%
CA AVG 84.7%
Rank #401 / 1537
+3%- -20%-
$0
Facility $0
CA AVG $56.5k
Rank #1 / 362
-
36
Facility 36
CA AVG 50.2
Rank #148 / 361
4.0
Facility 4.0
CA AVG 4.6
Rank #169 / 361
-145A+
97
Facility 97
CA AVG 57
Rank #29 / 2092
Barry Kohn
$18.9M
Facility $18.9M
CA AVG $17.0M
Rank #43 / 355
$10.4M
Facility $10.4M
CA AVG $7.0M
Rank #82 / 355
55.1%
Facility 55.1%
CA AVG 45.2%
Rank #318 / 355
56244
Fountainview at Eisenberg Village
NH
AL
IL
Reseda
216
Facility 216
CA AVG 103
Rank #126 / 1657
48.1%
Facility 48.1%
CA AVG 84.7%
Rank #1389 / 1537
-43%
2.96
Facility 2.96
CA AVG 4.22
Rank #351 / 354
+1%-30%
$0
Facility $0
CA AVG $56.5k
Rank #1 / 362
89
Facility 89
CA AVG 81
Rank #461 / 1401
66
Facility 66
CA AVG 50.2
Rank #289 / 361
3.9
Facility 3.9
CA AVG 4.6
Rank #161 / 361
-90-
49
Facility 49
CA AVG 57
Rank #1370 / 2092
Karen Pham
$16.7M
Facility $16.7M
CA AVG $17.0M
Rank #153 / 355
$8.5M
Facility $8.5M
CA AVG $7.0M
Rank #154 / 355
50.6%
Facility 50.6%
CA AVG 45.2%
Rank #189 / 355
555716
Infinity Care of East Los Angeles
NH
Los Angeles (Central La)
99
Facility 99
CA AVG 103
Rank #725 / 1657
77.0%
Facility 77.0%
CA AVG 84.7%
Rank #764 / 1537
-9%
3.28
Facility 3.28
CA AVG 4.22
Rank #327 / 354
-44%-22%
$65.8k
Facility $65.8k
CA AVG $56.5k
Rank #325 / 362
-
78
Facility 78
CA AVG 50.2
Rank #306 / 361
3.6
Facility 3.6
CA AVG 4.6
Rank #123 / 361
387-
94
Facility 94
CA AVG 57
Rank #87 / 2092
Infinity Care Of East La
$9.8M
Facility $9.8M
CA AVG $17.0M
Rank #275 / 355
$5.3M
Facility $5.3M
CA AVG $7.0M
Rank #231 / 355
53.9%
Facility 53.9%
CA AVG 45.2%
Rank #41 / 355
56063

Financial Assistance for
Nursing Home in California

Infinity Care of East Los Angeles is located in Los Angeles, California.
Here are the financial assistance programs available to residents in California.

Get Financial aid guidance

Multipurpose Senior Services Program

MSSP (Medi-Cal Waiver)

Age 65+
General California resident, Medi-Cal eligible, nursing home risk.
Income Limits (2025) ~$2,829/month 300% FBR, individual
Asset Limits $2,000 (individual), $3,000 (couple).
CA

County-managed; waitlists possible.

Benefits
In-home support (4-6 hours/day) Respite care (14 days/year) Meals (~$6/meal) Transportation (8 trips/month) Care management

In-Home Supportive Services (IHSS)

California IHSS

Age 65+
General California resident, Medicaid-eligible or low-income.
Income Limits ~$1,732/month individual, Medi-Cal threshold
Asset Limits $2,000 individual
CA

Can hire family as caregivers.

Benefits
Personal care (up to 283 hours/month) Homemaker services Respite (varies)

Multipurpose Senior Services Program (MSSP)

CA MSSP

Age 65+
General California resident, Medi-Cal-eligible, nursing home-eligible but community-capable.
Income Limits ~$2,829/month 300% FBR, individual
Asset Limits $2,000 individual
CA

Available in 38 counties; waitlists common.

Benefits
Case management Respite care (up to 10 days/year) Minor home mods (avg. $500) Adult day care (~$50/day)

Property Tax Postponement Program (PTP)

CA PTP

Age 62+
General California resident, own and live in home, 40% equity.
Income Limits (2025) ~$51,500/year household, adjusted annually
Asset Limits Equity-based; no strict asset cap.
CA

Deferred taxes accrue interest (5% as of 2024); repaid upon sale/death.

Benefits
Property tax deferral (avg. $1,000-$3,000/year, varies by county)

Assisted Living Waiver (ALW)

CA ALW

Age 65+ or disabled
General California resident, Medi-Cal-eligible, nursing home-eligible.
Income Limits ~$2,829/month 300% FBR, individual
Asset Limits $2,000 individual
CA

Available in 15 counties (e.g., LA, Sacramento); waitlists common.

Benefits
Personal care in ALFs (5-7 hours/day) Medication management Social services

California CARES Program

CA CARES

Age
General Caregivers of California residents 60+ needing help with 3+ daily activities; no caregiver age limit.
Income Limits No strict limit; cost-sharing above ~$2,500/month threshold.
Asset Limits Not applicable; need-based.
CA

High demand in urban areas; complements IHSS respite.

Benefits
Respite care (up to 10 days/year) Counseling (4-6 sessions/year) Training (2-3 workshops/year) Supplies (~$200/year)

Frequently Asked Questions about Infinity Care of East Los Angeles

What neighborhood is Infinity Care of East Los Angeles in?

Infinity Care of East Los Angeles is in the Central LA neighborhood.

Is Infinity Care of East Los Angeles in a walkable area?

Infinity Care of East Los Angeles has a walk score of 94. Walker's paradise. Daily errands do not require a car, with many shops and services nearby.

What is the occupancy rate at Infinity Care of East Los Angeles?

Infinity Care of East Los Angeles's occupancy is 77.0%.

Does Infinity Care of East Los Angeles operate as a for-profit or non-profit?

Infinity Care of East Los Angeles is registered as a for-profit.

Are there photos of Infinity Care of East Los Angeles?

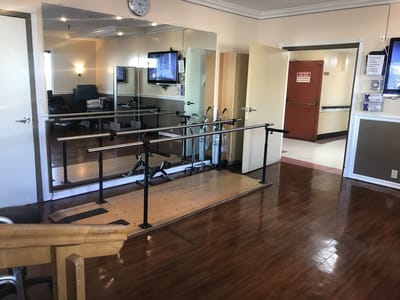
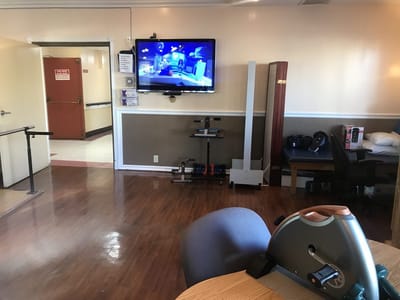
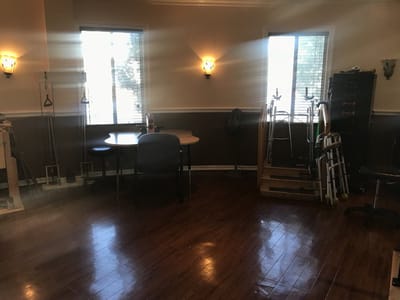
Yes — there are 4 photos of Infinity Care of East Los Angeles in the photo gallery on this page.

What is the address of Infinity Care of East Los Angeles?

Infinity Care of East Los Angeles is located at 101 S Fickett St, Los Angeles, CA 90033.

What is the phone number of Infinity Care of East Los Angeles?

(323) 261-8108 will put you in contact with the team at Infinity Care of East Los Angeles.

Guides for Better Senior Living

Care Cost Calculator: See Prices in Your Area

Nursing Home Data Explorer

Don’t Wait Too Long: 7 Red Flag Signs Your Parent Needs Assisted Living Now

The True Cost of Assisted Living in 2025 – And How Families Are Paying For It

Understanding Senior Living Costs: Pricing Models, Discounts & Financial Assistance