Unique Rehabilitation & Health Center
CMS overall rating Info CMS (the Centers for Medicare & Medicaid Services) is the federal agency that rates nursing home quality. Its Overall Rating runs from 1 to 5 stars, combining health inspections, staffing, and quality measures, with inspections weighted most heavily.

Unique Rehabilitation & Health Center

CMS overall rating Info CMS (the Centers for Medicare & Medicaid Services) is the federal agency that rates nursing home quality. Its Overall Rating runs from 1 to 5 stars, combining health inspections, staffing, and quality measures, with inspections weighted most heavily.
Calculator: See prices in your area
Unique Rehabilitation & Health Center accepts Medicare, Medicaid, and private pay.

Overview of Unique Rehabilitation & Health Center

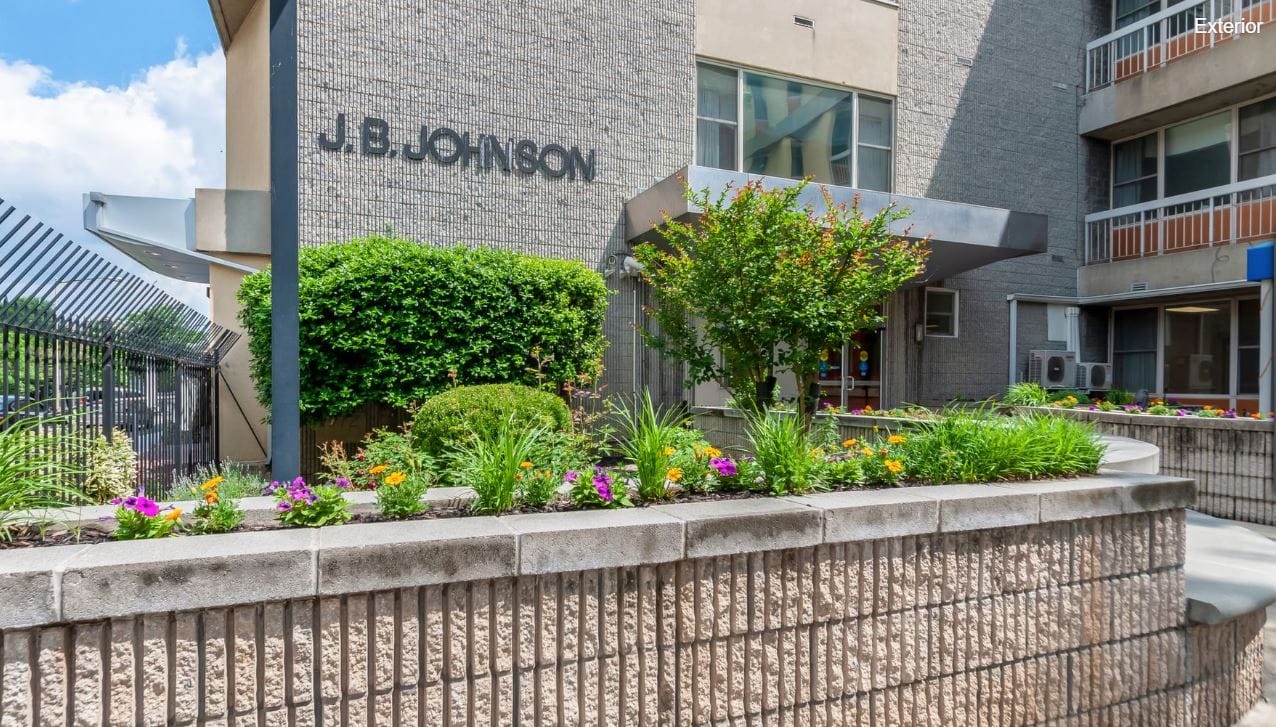
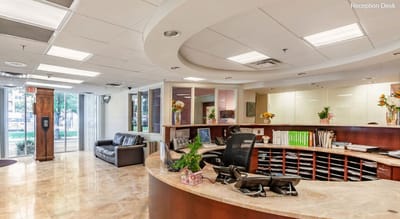
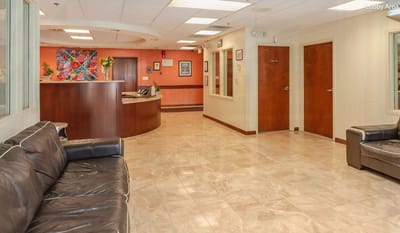
Unique Rehabilitation and Health Center is a trusted nursing home in D.C. The premier nursing home continues to offer exceptional care delivered by its patient-friendly staff, providing the best care possible for its residents. The health facility is ideal for families looking for the best solution to skilled nursing and provides a safe and secure community that cares for every patient’s needs.

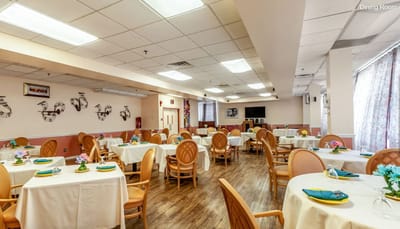
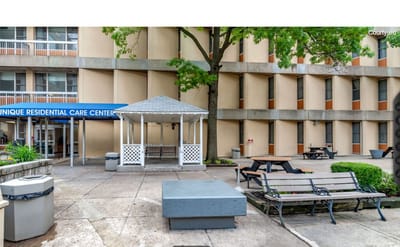
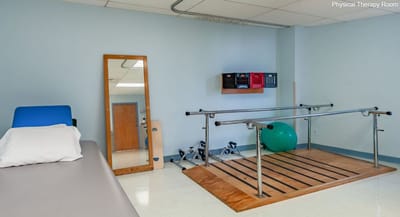
Unique Rehab and Health Center provides state-of-the-art features that cater to short-term or long-term residents; they are also guaranteed to feel comfortable and know that they belong in a home that offers 24-hour nursing care with inpatient and outpatient care in a resort-like community with the utmost hospitality.

(202) 535-1100

Quality ratings

Measured by Centers for Medicare & Medicaid Services (CMS)

Overall rating Info The Overall CMS Rating combines results from health inspections, staffing levels and quality measures. Health inspections carry the most weight. Staffing and quality scores can increase or decrease the final rating based on performance compared to state and national standards.
▼ 7.0% Below WA avg. ▼ 7.0% Below WA avg.WA average: 3.2Click the badge to see the full State ranking.Click here to see the full State ranking.
Health Inspection Info Based on the results of the facility's three most recent standard inspections and any complaint investigations. CMS reviews the number, scope, and severity of deficiencies, with more recent findings weighted more heavily.
▼ 29.0% Below WA avg. ▼ 29.0% Below WA avg.WA average: 2.8Click the badge to see the full State ranking.Click here to see the full State ranking.
Staffing Info Measures average nursing staff hours per resident per day, including Registered Nurses (RNs) and total nursing staff. Ratings are adjusted based on the level of care residents require and are compared to state and national benchmarks.
▲ 46.1% Above WA avg. ▲ 46.1% Above WA avg.WA average: 3.4Click the badge to see the full State ranking.Click here to see the full State ranking.
Quality Measures Info Based on clinical and physical health indicators reported to CMS, such as hospital readmissions, falls, pressure ulcers, and improvements in mobility. These measures reflect how well residents' health needs are being managed.
▲ 1.7% Above WA avg. ▲ 1.7% Above WA avg.WA average: 3.9Click the badge to see the full State ranking.Click here to see the full State ranking.

Staffing hours breakdown

Info Daily nursing hours per resident by staff type, reported to CMS. Higher is generally better — compare this facility to state and national averages to see where staffing stands.

Hours per resident per day — compared to Washington state averages

Total nursing care / resident Info This home is ranked 7th out of 9 homes in Washington for nurse hours. Total adjusted nursing hours per resident per day, combining RN, LPN, and aide time. CMS adjusts this for case-mix so facilities can be fairly compared.
3h 59m per day
Rank #7 / 9Nurse hours — State benchmarkedThis home is ranked 7th out of 9 homes in District of Columbia. Shows adjusted nurse hours per resident per day benchmarked to the District of Columbia average, with a ranking across 9 District of Columbia facilities. More hours mean more direct care. The national average is about 3.5 hrs; below 3.0 is a red flag.Ranking totals vary by category as each rank only includes facilities that report data for that metric. Homes missing that data point aren't included in the ranking.Click the rank badge to see the full State ranking.Click here to see the full State ranking.
This facility Washington avg (4h 13m per day)
vs Washington avg
-6%

6 of 6 metrics below state avg

Staff typeHours / Day / Residentvs state avg
Registered Nurse (RN) Info RNs hold the highest nursing license and can assess residents, interpret test results, and direct care plans. More RN hours per day often signals stronger clinical oversight and faster response to health changes. 1h 1m per day ▼ 42% State avg: 1h 45m per day · National avg: 41m per day
LPN / LVN Info Licensed Practical Nurses (LPNs) or Licensed Vocational Nurses (LVNs) deliver routine hands-on care — medication administration, wound dressing, and monitoring vital signs. They work under RN supervision and make up a large share of daily bedside care. 30m per day ▼ 12% State avg: 34m per day · National avg: 52m per day
Nurse Aide Info Certified Nurse Aides (CNAs) provide the most direct day-to-day assistance: bathing, dressing, feeding, and mobility. Nurse aide hours are typically the largest staffing category and directly affect residents' quality of life. 2h 25m per day ▼ 5% State avg: 2h 33m per day · National avg: 2h 21m per day
Weekend Total Nursing Info Combined nursing hours (RN + LPN + Nurse Aide) per resident per day on weekends. Staffing often drops on weekends — this figure reveals whether the facility maintains adequate coverage outside of weekday hours. 3h 39m per day ▼ 16% State avg: 4h 21m per day · National avg: 3h 26m per day
Physical Therapist Info Hours per resident per day provided by licensed Physical Therapists (PTs) or PT Assistants. PT services help residents recover mobility after injury or illness and are especially important for post-acute (short-stay) rehabilitation. 2m per day ▼ 71% State avg: 6m per day · National avg: 4m per day
Weekend RN Info Registered nurse hours specifically on weekends. Facilities sometimes reduce RN presence on Saturdays and Sundays — a low weekend RN figure compared to weekday hours can indicate reduced clinical oversight when most administrative staff are absent. 46m per day ▼ 45% State avg: 1h 23m per day · National avg: 29m per day

Capacity and availability

This home usually has limited availability

Higher occupancy than the Washington average: 72.5%
Occupancy rate
89.9% Rank #3 / 9Occupancy rate — State benchmarkedThis home is ranked 3rd out of 9 homes in District of Columbia. Shows this facility's occupancy rate versus the District of Columbia average, with its Statewide rank out of 9. Higher occupancy signals strong local demand and financial stability.Ranking totals vary by category as each rank only includes facilities that report data for that metric. Homes missing that data point aren't included in the ranking.Click the rank badge to see the full State ranking.Click here to see the full State ranking.
Avg. Length of Stay
207 days
Bed community size
230-bed community
A large-scale community that may provide a wide range of amenities, services, and structured programs.
Walk Score
Walk Score: 92 / 100
Walker's paradise. Daily errands do not require a car, with many shops and services nearby.

About this community

Contact Unique Rehabilitation & Health Center

Staffing Data

Reporting period: October 1 – December 31, 2025 (Q4 2025). Source: CMS Payroll-Based Journal report.

Total staff 265
Employees 243
Contractors 22
Staff to resident ratio 1.24 : 1
33% fewer staff per resident than Washington average
Washington average ratio: 1.86 : 1 Washington average ratio: 1.86 : 1See full Washington ranking
Avg staff/day 128
Average shift 8.1 hours
0% compared with Washington average
Washington average: 8.1 hours Washington average shift: 8.1 hoursSee full Washington ranking
Total staff hours (quarter) 94,873

Nursing staff breakdown

Q4 2025 · Oct 1 – Dec 31 More info This data comes from the CMS Payroll-Based Journal report covering October 1 – December 31, 2025.
Registered Nurse

Manages medical care and health needs.

RN Staff Info All 32 RN Staff are full-time employees. No contractors work on this role. 32
Average shift length Info Average shift length. Calculated as total hours divided by days worked and average staff per day. 8.5 hours
Licensed Practical Nurse

Assists with medical care and medications.

LPN Staff Info All 18 LPN Staff are full-time employees. No contractors work on this role. 18
Average shift length Info Average shift length. Calculated as total hours divided by days worked and average staff per day. 8.2 hours
Certified Nursing Assistant

Helps with daily care and mobility.

CNA Staff Info All 130 CNA Staff are full-time employees. No contractors work on this role. 130
Average shift length Info Average shift length. Calculated as total hours divided by days worked and average staff per day. 8.2 hours

Contractor staffing

Q4 2025 · Oct 1 – Dec 31 More info This data comes from the CMS Payroll-Based Journal report covering October 1 – December 31, 2025.

Total hours from contractors

4.7%

4,465 contractor hours this quarter

Speech Language Pathologist: 6 Physical Therapy Assistant: 5 Qualified Social Worker: 4 Respiratory Therapy Technician: 4 Physical Therapy Aide: 2 Qualified Activities Professional: 1

Staff by category

Q4 2025 · Oct 1 – Dec 31 More info This data comes from the CMS Payroll-Based Journal report covering October 1 – December 31, 2025.
Certified Nursing Assistant130013048,51892100%8.2
Registered Nurse3203211,26592100%8.5
Licensed Practical Nurse180188,82792100%8.2
Clinical Nurse Specialist290298,35892100%7.6
Physical Therapist180187,04292100%7.2
Speech Language Pathologist0661,6527784%7.7
Dental Services Staff4041,3696470%7.5
Other Dietary Services Staff3031,2358896%8
RN Director of Nursing2021,1818693%10.2
Physical Therapy Assistant0551,1367379%8.9
Dietitian2026946874%7.6
Respiratory Therapy Technician0445755560%9.1
Administrator1015607076%8
Nurse Practitioner1015607076%8
Qualified Social Worker0445546874%7.9
Physical Therapy Aide0225476571%7.9
Occupational Therapy Aide1014275459%7.9
Qualified Activities Professional1121934650%4.1
Mental Health Service Worker1011822426%7.6
130 Certified Nursing Assistant
% of Days 100%
32 Registered Nurse
% of Days 100%
18 Licensed Practical Nurse
% of Days 100%
29 Clinical Nurse Specialist
% of Days 100%
18 Physical Therapist
% of Days 100%
6 Speech Language Pathologist
% of Days 84%
4 Dental Services Staff
% of Days 70%
3 Other Dietary Services Staff
% of Days 96%
2 RN Director of Nursing
% of Days 93%
5 Physical Therapy Assistant
% of Days 79%
2 Dietitian
% of Days 74%
4 Respiratory Therapy Technician
% of Days 60%
1 Administrator
% of Days 76%
1 Nurse Practitioner
% of Days 76%
4 Qualified Social Worker
% of Days 74%
2 Physical Therapy Aide
% of Days 71%
1 Occupational Therapy Aide
% of Days 59%
2 Qualified Activities Professional
% of Days 50%
1 Mental Health Service Worker
% of Days 26%

Penalties and fines

Includes penalties issued in 2024

Federal penalties imposed by CMS for regulatory violations, including civil money penalties (fines) and denials of payment for new Medicare/Medicaid admissions.

Source: CMS Penalties Database (Data as of Jan 2026)

Total fines amount $62K Rank #8 / 10Federal fines — State benchmarkedThis home is ranked 8th out of 10 homes in District of Columbia. Shows this facility's cumulative CMS federal fine dollars versus the District of Columbia average among facilities with fines, and where it ranks among 10 facilities in the pool. Lower total dollars mean a better rank.Ranking totals vary by category as each rank only includes facilities that report data for that metric. Homes missing that data point aren't included in the ranking.Click the rank badge to see the full State ranking.Click here to see the full State ranking.
38% lower than Washington average

Washington average: $100K

Number of fines 2
17% more fines than Washington average

Washington average: 1.7

Payment Denials Info Serious action where Medicare and/or Medicaid temporarily stops payments for new residents until issues are fixed. 0
100% fewer payment denials than Washington average

Washington average: 0.5

Fines amount comparison
This facility $62K
Washington average $100K
Penalty History

Penalties are imposed by CMS for violations of federal nursing home regulations.

1 penalty in the past 3 years

Nov 27, 2024 · $49K

Civil Money Penalty Info Fines imposed for noncompliance, which can be assessed per day or per instance of violation. Nov 27, 2024
$49K

Last updated: Jan 2026

Quality of care over time

These measures show how residents usually do over time at this home, based on health outcomes and preventive care.

High-risk clinical events score Info A composite score based on pressure ulcers, falls with injury, weight loss, walking ability decline, and activities of daily living decline. 10.5
In line with Washington average

Washington average: 10.8

Functional decline score Info A composite score based on activities of daily living decline, walking ability decline, and incontinence. 20.3
11% better than Washington average

Washington average: 22.9

Long-stay resident measures
Significantly above average Info CMS star rating based on long-stay quality measure performance. 5 stars = significantly above average, 1 star = significantly below average.
Need for Help with Daily Activities Increased Info Percent of long-stay residents whose need for help with daily activities has increased 25.6%
11% worse than Washington average

Washington average: 23.0%

Walking Ability Worsened Info Percent of long-stay residents whose ability to move independently worsened 13.7%
40% better than Washington average

Washington average: 22.8%

Low Risk Residents with Bowel/Bladder Incontinence Info Percent of low risk long-stay residents who lose control of their bowels or bladder 21.5%
8% better than Washington average

Washington average: 23.5%

Falls with Major Injury Info Percent of long-stay residents experiencing one or more falls with major injury 1.6%
37% worse than Washington average

Washington average: 1.2%

High Risk Residents with Pressure Ulcers Info Percent of long-stay high risk residents with pressure ulcers 7.9%
In line with Washington average

Washington average: 8.1%

Urinary Tract Infection Info Percent of long-stay residents with a urinary tract infection 0.8%
57% better than Washington average

Washington average: 1.8%

Lost Too Much Weight Info Percent of long-stay residents who lose too much weight 3.5%
24% better than Washington average

Washington average: 4.6%

Depressive Symptoms Info Percent of long-stay residents who have depressive symptoms 14.4%
170% worse than Washington average

Washington average: 5.3%

Antipsychotic Use Info Percent of long-stay residents who received an antipsychotic medication 7.9%
10% worse than Washington average

Washington average: 7.2%

Pneumococcal Vaccine Info Percent of long-stay residents assessed and appropriately given the pneumococcal vaccine 99.0%
9% better than Washington average

Washington average: 90.4%

Influenza Vaccine Info Percent of long-stay residents assessed and appropriately given the seasonal influenza vaccine 99.5%
In line with Washington average

Washington average: 97.0%

Hospitalizations per 1,000 days Info Number of hospitalizations per 1,000 long-stay resident days. 0.97
9% better than Washington average

Washington average: 1.07

ED visits per 1,000 days Info Number of outpatient emergency department visits per 1,000 long-stay resident days. 0.69
5% worse than Washington average

Washington average: 0.66

Short-stay resident measures
Average Info CMS star rating based on short-stay quality measure performance. 5 stars = much above average, 1 star = much below average.
Pneumococcal Vaccine Info Percent of short-stay residents assessed and appropriately given the pneumococcal vaccine 79.8%
19% better than Washington average

Washington average: 66.9%

Antipsychotic medication increase Info Percent of short-stay residents who newly received an antipsychotic medication 1.0%
39% worse than Washington average

Washington average: 0.7%

Influenza Vaccine Info Percent of short-stay residents assessed and appropriately given the seasonal influenza vaccine 88.1%
20% better than Washington average

Washington average: 73.2%

Re-hospitalized after SNF stay Info Percentage of short-stay residents who were re-hospitalized after their nursing home admission. 21.7%
20% worse than Washington average

Washington average: 18.1%

Emergency department visits Info Percentage of short-stay residents who had an outpatient emergency department visit. 7.1%
In line with Washington average

Washington average: 7.2%

Falls with major injury Info Percentage of SNF residents who experience falls with major injury during their stay. 0.0%
100% better than Washington average

Washington average: 0.8%

Ability to care for self at discharge Info Percentage of residents at or above expected ability to care for themselves at discharge. 56.8%
6% better than Washington average

Washington average: 53.7%

Successful return to home or community Info Rate of successful return to home or community from a skilled nursing facility. 36.2%
28% worse than Washington average

Washington average: 50.6%

Breakdown by payment type

Medicare

46% of new residents, usually for short-term rehab.

Typical stay 1 - 2 months

Private pay

23% of new residents, often for short stays.

Typical stay 24 days

Medicaid

31% of new residents, often for long-term daily care.

Typical stay 1 - 2 years

Facility Characteristics

Source: CMS Long-Term Care Facility Characteristics (Data as of Jan 2026)

Total residents 213
Medicare
24
11.3% of residents
Medicaid
181
85% of residents
Private pay or other
8
3.8% of residents
Programs & Services
Residents Group

Residents meet regularly to discuss policies, care quality, and activities

Active Resident Council

Organized group of residents that meets regularly to discuss facility policies, quality of life, and activities.

Finances and operations

Based on CMS SNF Cost Report for fiscal year ending in 12/2023.

Privately-owned community
Operated by a single business entity.
Net patient revenue Info Net patient revenue — what the home actually collects for resident care, after contractual allowances, bad debt and discounts are subtracted from its gross charges (CMS cost report, Worksheet G-3). It covers resident care only; money the home earns from other sources is shown separately as "Other income."
$32.1M
Net patient income Info Net patient income: net patient revenue minus the home's total operating expenses. A positive figure means it earns more from resident care than it spends to deliver it; a negative figure means the opposite. It excludes non-operating "other income."
$3.2M
Privately-owned community Operated by a single business entity.
Net patient revenue Info Net patient revenue — what the home actually collects for resident care, after contractual allowances, bad debt and discounts are subtracted from its gross charges (CMS cost report, Worksheet G-3). It covers resident care only; money the home earns from other sources is shown separately as "Other income."
$32.1M Rank #2 / 9Revenue — State benchmarkedThis home is ranked 2nd out of 9 homes in District of Columbia. Shows this facility's annual revenue compared to the District of Columbia average. Higher revenue generally means more resources for staffing and capital — read alongside Payroll %.Ranking totals vary by category as each rank only includes facilities that report data for that metric. Homes missing that data point aren't included in the ranking.Click the rank badge to see the full State ranking.Click here to see the full State ranking.
Net patient income Info Net patient income: net patient revenue minus the home's total operating expenses. A positive figure means it earns more from resident care than it spends to deliver it; a negative figure means the opposite. It excludes non-operating "other income."
$3.2M
Other income Info Money the home earns outside of resident care — such as investments, grants, rentals and other non-operating sources (CMS cost report, Worksheet G-3). It is tracked separately from net patient revenue: it is not part of that figure, and it is not included in net patient income.
$376.4K
Payroll costs Info Staff salaries plus wage-related costs — benefits such as payroll taxes, health insurance and retirement — from the home's own accounting records (CMS cost report, Worksheet A). Contract or agency labor is counted separately, under other operating costs. Rank #2 / 9Payroll — State benchmarkedThis home is ranked 2nd out of 9 homes in District of Columbia. Shows total annual staff payroll benchmarked to the District of Columbia average. Higher payroll investment relative to peers often signals better staffing and less reliance on cheaper contract labor.Ranking totals vary by category as each rank only includes facilities that report data for that metric. Homes missing that data point aren't included in the ranking.Click the rank badge to see the full State ranking.Click here to see the full State ranking.
$17.7M 55.3% of net patient revenue Info Payroll as a share of revenue: staff salaries and wage-related benefits divided by net patient revenue. A higher figure means more of each revenue dollar goes to staff pay. Rank #6 / 9Payroll % — State benchmarkedThis home is ranked 6th out of 9 homes in District of Columbia. Shows payroll as a percentage of revenue versus the District of Columbia average. Below 25% may signal understaffing or heavy agency use — read with Staffing ratings.Ranking totals vary by category as each rank only includes facilities that report data for that metric. Homes missing that data point aren't included in the ranking.Click the rank badge to see the full State ranking.Click here to see the full State ranking.
Other operating costs Info Everything it costs to run the home apart from payroll — food, utilities, supplies, maintenance, contract labor and administration. Calculated as total operating expense minus payroll (staff salaries and wage-related benefits).
$11.2M
Total costs Info The home's total operating expense for the year — all the costs of running it, salaries included (CMS cost report, Worksheet G-3).
$28.9M

Who this home usually serves

TYPE OF STAY

Mostly short-term rehab stays

Most residents typically stay for a few weeks or months before returning home or moving on.

New residents most often arrive under Medicare (46% of admissions), and a typical Medicare stay runs around 1 - 2 months.

Admissions
370 total

Coverage residents most often arrive under.

Medicare 46%
Private pay 23%
Medicaid 31%
Discharges
364 total

Coverage residents most often leave under.

Medicare 26%
Private pay 17%
Medicaid 57%

Places of interest near Unique Rehabilitation & Health Center

Address 1.3 miles from city center Info Estimated distance in miles from Washington's city center to Unique Rehabilitation & Health Center's address, calculated via Google Maps. — 2.04 miles to nearest hospital (The GW Medical Faculty Associates)

Calculate Travel Distance to Unique Rehabilitation & Health Center

Add your location

Address

Compare Nursing Home around Washington

5 facilities compared · CMS & DC Dept. of Health data

Sibley Memorial Hosp Renaissance
NH
Nursing Homes In Washington (Northwest Washington)45--
5.77
Facility 5.77
DC AVG 4.60
Rank #1 / 9
+70%+25%
$8.8k
Facility $8.8k
DC AVG $118.4k
Rank #3 / 10
34
Facility 34
DC AVG 63.1
Rank #2 / 10
6.8
Facility 6.8
DC AVG 11.1
Rank #2 / 10
236- 26 ----95030
Ingleside at Rock Creek, a CCRC
NH
AL
HC
IL
MC
NC
Assisted Living In Washington (Northwest Washington)34
95.1%
Facility 95.1%
DC AVG 76.9%
Rank #2 / 9
+24%
5.52
Facility 5.52
DC AVG 4.60
Rank #2 / 9
+22%+20%
$39.4k
Facility $39.4k
DC AVG $118.4k
Rank #7 / 10
42
Facility 42
DC AVG 63.1
Rank #5 / 10
14.0
Facility 14.0
DC AVG 11.1
Rank #8 / 10
130- 42 Bruce Bartels
$34.3M
Facility $34.3M
DC AVG $34.0M
Rank #3 / 9
$13.1M
Facility $13.1M
DC AVG $11.6M
Rank #4 / 9
38.2%
Facility 38.2%
DC AVG 39.8%
Rank #9 / 9
95028
Knollwood Life Plan Community
NH
AL
IL
MC
NC
Assisted Living In Washington (Northwest Washington)69
77.9%
Facility 77.9%
DC AVG 76.9%
Rank #5 / 9
+1%- -4%-
$0
Facility $0
DC AVG $118.4k
Rank #1 / 10
39
Facility 39
DC AVG 63.1
Rank #3 / 10
7.8
Facility 7.8
DC AVG 11.1
Rank #3 / 10
338- 15 Sonja Brooks
$20.5M
Facility $20.5M
DC AVG $34.0M
Rank #6 / 9
$11.9M
Facility $11.9M
DC AVG $11.6M
Rank #6 / 9
57.9%
Facility 57.9%
DC AVG 39.8%
Rank #3 / 9
95026
Carroll Manor Nursing & Rehab Center
NH
IL
MC
Independent Living In Washington (Northeast Washington)252
73.2%
Facility 73.2%
DC AVG 76.9%
Rank #6 / 9
-5%
5.22
Facility 5.22
DC AVG 4.60
Rank #3 / 9
-18%+13%
$16.8k
Facility $16.8k
DC AVG $118.4k
Rank #6 / 10
54
Facility 54
DC AVG 63.1
Rank #6 / 10
18.0
Facility 18.0
DC AVG 11.1
Rank #10 / 10
2171- 34 Ascension Health Senior Care
$24.6M
Facility $24.6M
DC AVG $34.0M
Rank #5 / 9
$12.8M
Facility $12.8M
DC AVG $11.6M
Rank #3 / 9
52.1%
Facility 52.1%
DC AVG 39.8%
Rank #7 / 9
95034
Unique Rehabilitation & Health Center
NH
Nursing Homes In Washington (Northwest Washington)230
89.9%
Facility 89.9%
DC AVG 76.9%
Rank #3 / 9
+17%
3.98
Facility 3.98
DC AVG 4.60
Rank #7 / 9
-40%-14%
$48.9k
Facility $48.9k
DC AVG $118.4k
Rank #8 / 10
75
Facility 75
DC AVG 63.1
Rank #9 / 10
12.5
Facility 12.5
DC AVG 11.1
Rank #5 / 10
5218- 92 Regina Kim
$32.1M
Facility $32.1M
DC AVG $34.0M
Rank #2 / 9
$17.7M
Facility $17.7M
DC AVG $11.6M
Rank #2 / 9
55.3%
Facility 55.3%
DC AVG 39.8%
Rank #6 / 9
95036

Financial Assistance for
Nursing Home in Washington

Unique Rehabilitation & Health Center is located in Nursing Homes in Washington, Washington.
Here are the financial assistance programs available to residents in Washington.

Get Financial aid guidance

Community Options Program Entry System (COPES)

WA Medicaid COPES

Age 65+ or disabled
General Washington resident, Medicaid-eligible, nursing home-level care need.
Income Limits (2025) ~$2,829/month 300% FBR, individual
Asset Limits $2,000 (individual), $3,000 (couple).
WA

High demand in urban areas (e.g., Seattle).

Benefits
Personal care (5-7 hours/day) Respite (240 hours/year) Adult day care ($70/day) Home modifications ($1,500 avg.)

Washington Family Caregiver Support Program

WA NFCSP

Age Caregiver of someone 60+ (or with dementia)
General Washington resident.
Income Limits No strict limit; prioritizes low-income.
Asset Limits Not applicable.
WA

High urban demand; rural outreach.

Benefits
In-home respite (4-6 hours/day) Adult day care (~$70/day) Short-term facility care (up to 5 days)

Community First Choice (CFC)

Washington Community First Choice

Age 65+ (or disabled 18+)
General WA resident, Medicaid-eligible, need help with 2+ ADLs/IADLs.
Income Limits (2025) ~$2,829/month; QIT optional.
Asset Limits $2,000 (individual), $3,000 (couple).
WA

Broader than COPES; serves ~20,000; self-directed option.

Benefits
Personal care (4-6 hours/day) Respite (~240 hours/year) Assistive devices Training Transportation

Older Americans Act (OAA) Services

Washington OAA Services

Age 60+
General WA resident; no income/asset limits.
Income Limits (2025) None; donations encouraged.
Asset Limits Not assessed.
WA

13 AAAs; includes Meals on Wheels; rural focus.

Benefits
Meals (~$5-$7/meal) Transportation Homemaker services (~4 hours/week) Respite (~5 days/year) Legal aid

Medicare Savings Program (MSP)

Washington Medicare Savings Program

Age 65+ or disabled
General WA resident, Medicare Part A/B.
Income Limits (2025) ~$2,510/month (QMB), ~$3,380/month (SLMB), ~$3,598/month (QI)—individual.
Asset Limits $9,430 (individual), $14,130 (couple).
WA

Includes Extra Help for Part D; no waitlist.

Benefits
Covers Part B premiums ($174.70/month) Deductibles ($240/year) Copays (~20%)

VA Aid and Attendance (A&A) and Housebound Benefits

Washington VA Aid and Attendance/Housebound

Age 65+ or disabled veteran/spouse
General WA resident, wartime service, ADL help (A&A) or homebound.
Income Limits (2025) Net income < ~$1,984/month (veteran with dependent, A&A); pension offsets income.
Asset Limits ~$155,356 net worth
WA

High veteran use; supports rural/urban needs.

Benefits
Cash (~$1,433-$2,642/month veteran, ~$951-$1,318 spouse) for care costs

Senior Citizens Property Tax Exemption

Washington Senior Property Tax Exemption

Age 61+ or disabled retiree
General WA resident, homeowner, income-based.
Income Limits (2025) ~$45,000-$70,000/year varies by county, e.g., King: $70,000
Asset Limits Not assessed; home value cap varies ~$250,000-$400,000
WA

Saves ~$500-$1,500/year; offered statewide.

Benefits
Tax exemption (~$500-$1,500/year depending on county)

Senior Farmers’ Market Nutrition Program (SFMNP)

Washington SFMNP

Age 60+
General WA resident, low-income.
Income Limits (2025) ~$2,322/month 185% FPL
Asset Limits Not assessed.
WA

Vouchers (~$80/season); serves ~20,000 via AAAs.

Benefits
Vouchers (~$80/season) for produce at farmers’ markets

Frequently Asked Questions about Unique Rehabilitation & Health Center

What neighborhood is Unique Rehabilitation & Health Center in?

Unique Rehabilitation & Health Center is in the Northwest Washington neighborhood.

Is Unique Rehabilitation & Health Center in a walkable area?

Unique Rehabilitation & Health Center has a walk score of 92. Walker's paradise. Daily errands do not require a car, with many shops and services nearby.

What is the occupancy rate at Unique Rehabilitation & Health Center?

Unique Rehabilitation & Health Center's occupancy is 89.9%.

Are there photos of Unique Rehabilitation & Health Center?

Yes — there are 6 photos of Unique Rehabilitation & Health Center in the photo gallery on this page.

What is the phone number of Unique Rehabilitation & Health Center?

(202) 535-1100 will put you in contact with the team at Unique Rehabilitation & Health Center.

Is Unique Rehabilitation & Health Center Medicare or Medicaid certified?

Yes — Unique Rehabilitation & Health Center is a CMS-certified provider of Medicare and Medicaid.

Guides for Better Senior Living

Care Cost Calculator: See Prices in Your Area

Nursing Home Data Explorer

Don’t Wait Too Long: 7 Red Flag Signs Your Parent Needs Assisted Living Now

The True Cost of Assisted Living in 2025 – And How Families Are Paying For It

Understanding Senior Living Costs: Pricing Models, Discounts & Financial Assistance