Inspire Rehabilitation & Health Center
Nursing Home & Skilled Nursing · Washington, WA
CMS overall rating Info The Overall CMS Rating is scored from 1 to 5 stars and combines results from health inspections, staffing levels, and quality measures. Health inspections carry the most weight. Staffing and quality scores can increase or decrease the final rating based on performance compared to state and national standards.

Inspire Rehabilitation & Health Center

Nursing Home & Skilled Nursing · Washington, WA
CMS overall rating Info The Overall CMS Rating is scored from 1 to 5 stars and combines results from health inspections, staffing levels, and quality measures. Health inspections carry the most weight. Staffing and quality scores can increase or decrease the final rating based on performance compared to state and national standards.
Calculator: See prices in your area
Inspire Rehabilitation & Health Center accepts Medicare, Medicaid, and private pay.

Overview of Inspire Rehabilitation & Health Center

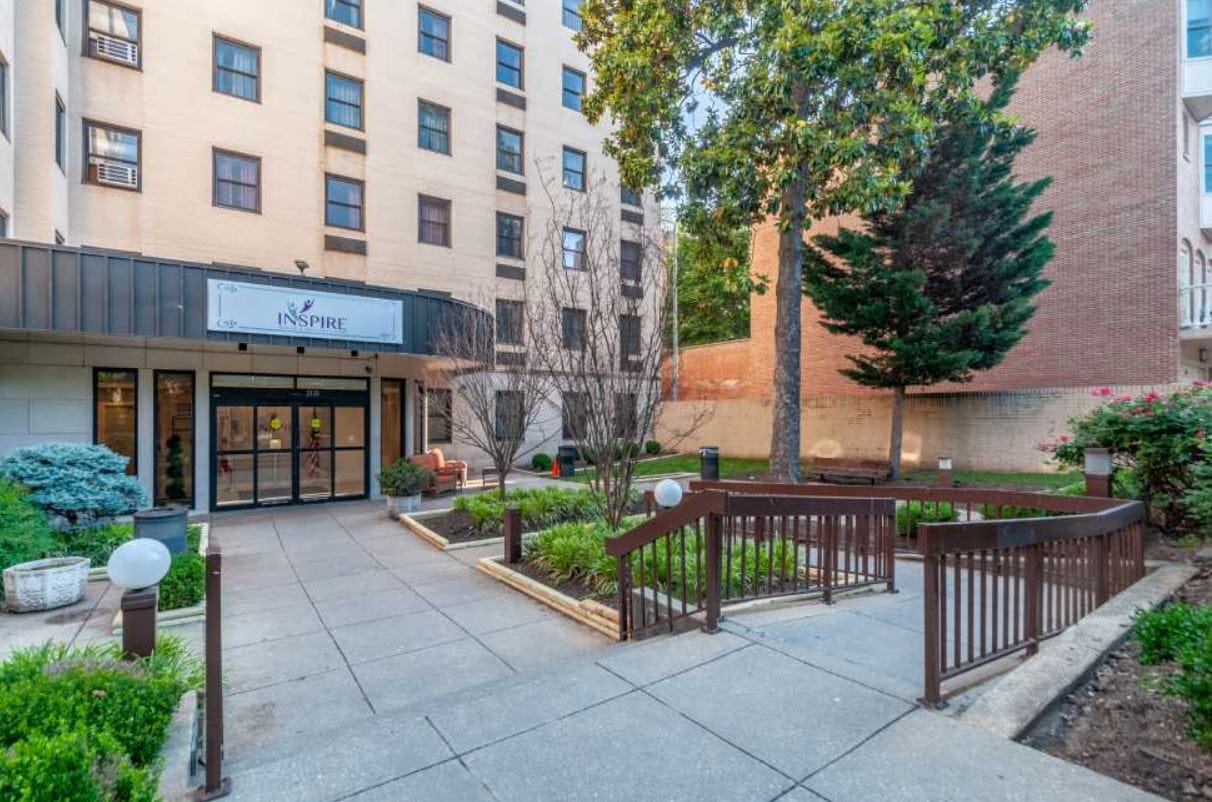
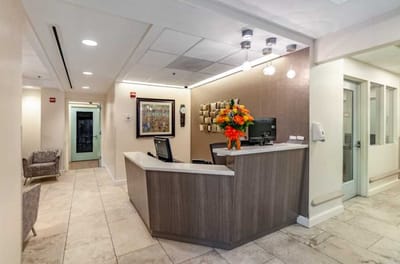
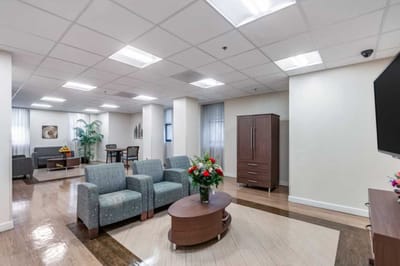
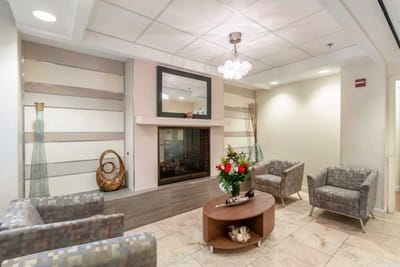
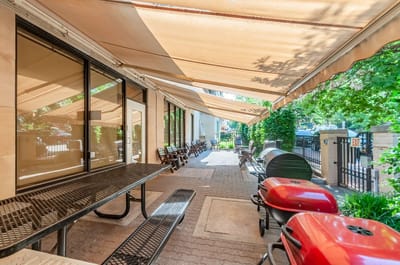
Inspire Rehabilitation and Health Center is a skilled nursing facility in Washington D.C. that is committed to creating a home away from home where senior residents are valued and cared for with dignity and respect Driven by the passion to care, the nursing center provides comprehensive long-term and rehabilitative services in a warm, comfortable, homelike setting.

Inspire Rehabilitation and Health Center strives to maintain the highest standard of care, ensuring that residents can thrive and enjoy life to the fullest, whether they’re staying for a short-term stay or a long-term living arrangement. Their staff and consultants collaboratively develop personalized treatment plans, including physical, occupational, and speech therapy, wound care, pain management, and more.

(202) 785-2577

Quality ratings

Measured by Centers for Medicare & Medicaid Services (CMS)

Overall rating Info The Overall CMS Rating combines results from health inspections, staffing levels and quality measures. Health inspections carry the most weight. Staffing and quality scores can increase or decrease the final rating based on performance compared to state and national standards.
▼ 7.0% Below WA avg. ▼ 7.0% Below WA avg.Click the badge to see the full State ranking.Click here to see the full State ranking.
Health Inspection Info Based on the results of the facility's three most recent standard inspections and any complaint investigations. CMS reviews the number, scope, and severity of deficiencies, with more recent findings weighted more heavily.
▼ 29.0% Below WA avg. ▼ 29.0% Below WA avg.Click the badge to see the full State ranking.Click here to see the full State ranking.
Staffing Info Measures average nursing staff hours per resident per day, including Registered Nurses (RNs) and total nursing staff. Ratings are adjusted based on the level of care residents require and are compared to state and national benchmarks.
▲ 16.8% Above WA avg. ▲ 16.8% Above WA avg.Click the badge to see the full State ranking.Click here to see the full State ranking.
Quality Measures Info Based on clinical and physical health indicators reported to CMS, such as hospital readmissions, falls, pressure ulcers, and improvements in mobility. These measures reflect how well residents' health needs are being managed.
▲ 27.2% Above WA avg. ▲ 27.2% Above WA avg.Click the badge to see the full State ranking.Click here to see the full State ranking.

Staffing hours breakdown

Info Daily nursing hours per resident by staff type, reported to CMS. Higher is generally better — compare this facility to state and national averages to see where staffing stands.

Hours per resident per day — compared to Washington state averages

Total nursing care / resident Info This home is ranked 7th out of 9 homes in Washington. Total adjusted nursing hours per resident per day, combining RN, LPN, and aide time. CMS adjusts this for case-mix so facilities can be fairly compared.
4h 2m per day
Rank #7 / 9Nurse hours — State benchmarkedThis home is ranked 7th out of 9 homes in District of Columbia. Shows adjusted nurse hours per resident per day benchmarked to the District of Columbia average, with a ranking across 9 District of Columbia SNFs. More hours mean more direct care. The national average is about 3.5 hrs; below 3.0 is a red flag.Click the rank badge to see the full State ranking.Click here to see the full State ranking.
This facility Washington avg (4h 13m per day)
vs Washington avg
-4%

4 of 5 metrics below state avg

Standout metric LPN / LVN is +21% above state avg
Staff typeHours / Day / Residentvs state avg
Registered Nurse (RN) Info RNs hold the highest nursing license and can assess residents, interpret test results, and direct care plans. More RN hours per day often signals stronger clinical oversight and faster response to health changes. 54m per day ▼ 49% State avg: 1h 45m per day · National avg: 41m per day
LPN / LVN Info Licensed Practical Nurses (LPNs) or Licensed Vocational Nurses (LVNs) deliver routine hands-on care — medication administration, wound dressing, and monitoring vital signs. They work under RN supervision and make up a large share of daily bedside care. 41m per day ▲ 21% State avg: 34m per day · National avg: 52m per day
Nurse Aide Info Certified Nurse Aides (CNAs) provide the most direct day-to-day assistance: bathing, dressing, feeding, and mobility. Nurse aide hours are typically the largest staffing category and directly affect residents' quality of life. 2h 27m per day ▼ 4% State avg: 2h 33m per day · National avg: 2h 21m per day
Weekend Total Nursing Info Combined nursing hours (RN + LPN + Nurse Aide) per resident per day on weekends. Staffing often drops on weekends — this figure reveals whether the facility maintains adequate coverage outside of weekday hours. 3h 34m per day ▼ 18% State avg: 4h 21m per day · National avg: 3h 26m per day
Weekend RN Info Registered nurse hours specifically on weekends. Facilities sometimes reduce RN presence on Saturdays and Sundays — a low weekend RN figure compared to weekday hours can indicate reduced clinical oversight when most administrative staff are absent. 42m per day ▼ 49% State avg: 1h 23m per day · National avg: 29m per day

Types of Care at Inspire Rehabilitation & Health Center

Skilled Nursing

Capacity and availability

This home is often near full

Occupancy higher than 95% suggests steady demand, but availability may be limited.

Higher occupancy than the Washington average: 72.5%
Occupancy rate 96.3% Rank #1 / 9Occupancy rate — State benchmarkedThis home is ranked 1st out of 9 homes in District of Columbia. Shows this facility's occupancy rate versus the District of Columbia average, with its Statewide rank out of 9. Higher occupancy signals strong local demand and financial stability.Click the rank badge to see the full State ranking.Click here to see the full State ranking.
Avg. Length of Stay 178 days
Occupancy rate
96.3% Rank #1 / 9Occupancy rate — State benchmarkedThis home is ranked 1st out of 9 homes in District of Columbia. Shows this facility's occupancy rate versus the District of Columbia average, with its Statewide rank out of 9. Higher occupancy signals strong local demand and financial stability.Click the rank badge to see the full State ranking.Click here to see the full State ranking.
Avg. Length of Stay
178 days
Walk Score
Walk Score: 99 / 100 Rank #1 / 24Walk Score — State benchmarkedThis home is ranked 1st out of 24 homes in District of Columbia. Shows how walkable this facility's neighborhood is compared to the average Walk Score across District of Columbia SNFs. Higher scores benefit residents, families, and staff.Click the rank badge to see the full State ranking.Click here to see the full State ranking.
Walker's paradise. Daily errands do not require a car, with many shops and services nearby.

About this community

Payment & Insurance

2 services
Accept Medicaid
Accept Medicare

Therapy & Rehabilitation

1 service
Rehabilitation Services

Staffing & Medical

1 service
24-Hour Staffing

Amenities & Lifestyle

Private And Semi-Private Suites
Housekeeping And Laundry Services
Dining
Media
And Activity Rooms
Complimentary Wi-Fi And Cable Television
Restaurant-Style Meals
Concierge-Style Dining Services
Daily Enrichment Programs
Fitness Center
Library
Outdoor Courtyards
On-Site Beauty And Barber Shop
Transportation Assistance
ActivitiesDaily enrichment programs and recreational activities.
Specific ProgramsSkilled Nursing & Therapy Programs, Specialized Medical Services, Long-Term

Dining & Nutrition

Food DescriptionRestaurant-style meals with a variety of menu options; nutritious, chef-prepared dishes that support wellness.

Contact Inspire Rehabilitation & Health Center

Staffing Data

Reporting period: October 1 – December 31, 2025 (Q4 2025). Source: CMS Payroll-Based Journal report.

Total staff 229
Employees 214
Contractors 15
Staff to resident ratio 1.32:1
29% worse than Washington average
Washington average ratio: 1.85:1 Washington average ratio: 1.85:1See full Washington ranking
Avg staff/day 107
Average shift 8.1 hours
0% compared with Washington average
Washington average: 8.1 hours Washington average shift: 8.1 hoursSee full Washington ranking
Total staff hours (quarter) 80,077

Nursing staff breakdown

Q4 2025 · Oct 1 – Dec 31 More info This data comes from the CMS Payroll-Based Journal report covering October 1 – December 31, 2025.
Registered Nurse

Manages medical care and health needs.

RN Staff 35
Average shift length Info Average shift length. Calculated as total hours divided by days worked and average staff per day. 8.8 hours

No contractors work on this role.

Licensed Practical Nurse

Assists with medical care and medications.

LPN Staff 34
Average shift length Info Average shift length. Calculated as total hours divided by days worked and average staff per day. 7.8 hours

No contractors work on this role.

Certified Nursing Assistant

Helps with daily care and mobility.

CNA Staff 97
Average shift length Info Average shift length. Calculated as total hours divided by days worked and average staff per day. 8.3 hours

No contractors work on this role.

Contractor staffing

Q4 2025 · Oct 1 – Dec 31 More info This data comes from the CMS Payroll-Based Journal report covering October 1 – December 31, 2025.

Total hours from contractors

4.6%

3,674 contractor hours this quarter

Respiratory Therapy Technician: 4 Physical Therapy Assistant: 3 Speech Language Pathologist: 3 Qualified Social Worker: 3 Physical Therapy Aide: 2

Staff by category

Q4 2025 · Oct 1 – Dec 31 More info This data comes from the CMS Payroll-Based Journal report covering October 1 – December 31, 2025.
Certified Nursing Assistant9709738,62392100%8.3
Licensed Practical Nurse3403410,87892100%7.8
Registered Nurse3503510,10292100%8.8
Physical Therapist150156,39592100%8.1
Clinical Nurse Specialist150154,48692100%7.6
RN Director of Nursing4041,4866874%7.9
Physical Therapy Assistant0331,0837379%8.1
Dental Services Staff2029436368%7.7
Occupational Therapy Aide2028766470%7.5
Speech Language Pathologist0338537076%6.8
Other Dietary Services Staff3037987784%7.2
Respiratory Therapy Technician0447757278%8.4
Qualified Social Worker0335936773%7.7
Administrator2025286672%8
Nurse Practitioner1015286672%8
Dietitian2023875560%7
Physical Therapy Aide0223704852%7.6
Mental Health Service Worker1013515459%6.5
Qualified Activities Professional101231617%1.4
97 Certified Nursing Assistant
% of Days 100%
34 Licensed Practical Nurse
% of Days 100%
35 Registered Nurse
% of Days 100%
15 Physical Therapist
% of Days 100%
15 Clinical Nurse Specialist
% of Days 100%
4 RN Director of Nursing
% of Days 74%
3 Physical Therapy Assistant
% of Days 79%
2 Dental Services Staff
% of Days 68%
2 Occupational Therapy Aide
% of Days 70%
3 Speech Language Pathologist
% of Days 76%
3 Other Dietary Services Staff
% of Days 84%
4 Respiratory Therapy Technician
% of Days 78%
3 Qualified Social Worker
% of Days 73%
2 Administrator
% of Days 72%
1 Nurse Practitioner
% of Days 72%
2 Dietitian
% of Days 60%
2 Physical Therapy Aide
% of Days 52%
1 Mental Health Service Worker
% of Days 59%
1 Qualified Activities Professional
% of Days 17%

Penalties and fines

Includes penalties issued in 2023

Federal penalties imposed by CMS for regulatory violations, including civil money penalties (fines) and denials of payment for new Medicare/Medicaid admissions.

Source: CMS Penalties Database (Data as of Jan 2026)

Total fines amount $12K Rank #4 / 10Federal fines — State benchmarkedThis home is ranked 4th out of 10 homes in District of Columbia. Shows this facility's cumulative CMS federal fine dollars versus the District of Columbia average among facilities with fines, and where it ranks among 10 skilled nursing facilities in the pool. Lower total dollars mean a better rank.Click the rank badge to see the full State ranking.Click here to see the full State ranking.
88% lower than Washington average

Washington average: $100K

Number of fines 1
42% fewer fines than Washington average

Washington average: 1.7

Payment Denials Info Serious action where Medicare and/or Medicaid temporarily stops payments for new residents until issues are fixed. 0
100% fewer payment denials than Washington average

Washington average: 0.5

Fines amount comparison
This facility $12K
Washington average $100K
Penalty History

Penalties are imposed by CMS for violations of federal nursing home regulations.

1 penalty in the past 3 years

Aug 9, 2023 · $12K

Civil Money Penalty Info Fines imposed for noncompliance, which can be assessed per day or per instance of violation. Aug 9, 2023
$12K

Last updated: Jan 2026

Quality of care over time

These measures show how residents usually do over time at this home, based on health outcomes and preventive care.

High-risk clinical events score Info A composite score based on pressure ulcers, falls with injury, weight loss, walking ability decline, and activities of daily living decline. 8.6
21% better than Washington average

Washington average: 10.8

Functional decline score Info A composite score based on activities of daily living decline, walking ability decline, and incontinence. 17.9
22% better than Washington average

Washington average: 22.9

Long-stay resident measures
Significantly above average Info CMS star rating based on long-stay quality measure performance. 5 stars = significantly above average, 1 star = significantly below average.
Need for Help with Daily Activities Increased Info Percent of long-stay residents whose need for help with daily activities has increased 17.7%
23% better than Washington average

Washington average: 23.0%

Walking Ability Worsened Info Percent of long-stay residents whose ability to move independently worsened 9.6%
58% better than Washington average

Washington average: 22.8%

Low Risk Residents with Bowel/Bladder Incontinence Info Percent of low risk long-stay residents who lose control of their bowels or bladder 26.3%
12% worse than Washington average

Washington average: 23.5%

Falls with Major Injury Info Percent of long-stay residents experiencing one or more falls with major injury 0.5%
59% better than Washington average

Washington average: 1.2%

High Risk Residents with Pressure Ulcers Info Percent of long-stay high risk residents with pressure ulcers 6.5%
20% better than Washington average

Washington average: 8.1%

Urinary Tract Infection Info Percent of long-stay residents with a urinary tract infection 1.2%
34% better than Washington average

Washington average: 1.8%

Lost Too Much Weight Info Percent of long-stay residents who lose too much weight 8.5%
83% worse than Washington average

Washington average: 4.6%

Depressive Symptoms Info Percent of long-stay residents who have depressive symptoms 18.7%
250% worse than Washington average

Washington average: 5.3%

Antipsychotic Use Info Percent of long-stay residents who received an antipsychotic medication 3.0%
59% better than Washington average

Washington average: 7.2%

Pneumococcal Vaccine Info Percent of long-stay residents assessed and appropriately given the pneumococcal vaccine 93.7%
In line with Washington average

Washington average: 90.4%

Influenza Vaccine Info Percent of long-stay residents assessed and appropriately given the seasonal influenza vaccine 98.2%
In line with Washington average

Washington average: 97.0%

Hospitalizations per 1,000 days Info Number of hospitalizations per 1,000 long-stay resident days. 1.82
70% worse than Washington average

Washington average: 1.07

ED visits per 1,000 days Info Number of outpatient emergency department visits per 1,000 long-stay resident days. 0.46
30% better than Washington average

Washington average: 0.66

Short-stay resident measures
Average Info CMS star rating based on short-stay quality measure performance. 5 stars = much above average, 1 star = much below average.
Pneumococcal Vaccine Info Percent of short-stay residents assessed and appropriately given the pneumococcal vaccine 89.2%
33% better than Washington average

Washington average: 66.9%

Antipsychotic medication increase Info Percent of short-stay residents who newly received an antipsychotic medication 2.4%
240% worse than Washington average

Washington average: 0.7%

Influenza Vaccine Info Percent of short-stay residents assessed and appropriately given the seasonal influenza vaccine 94.5%
29% better than Washington average

Washington average: 73.2%

Re-hospitalized after SNF stay Info Percentage of short-stay residents who were re-hospitalized after their nursing home admission. 21.5%
19% worse than Washington average

Washington average: 18.1%

Emergency department visits Info Percentage of short-stay residents who had an outpatient emergency department visit. 5.1%
29% better than Washington average

Washington average: 7.2%

Falls with major injury Info Percentage of SNF residents who experience falls with major injury during their stay. 1.0%
34% worse than Washington average

Washington average: 0.8%

Ability to care for self at discharge Info Percentage of residents at or above expected ability to care for themselves at discharge. 52.6%
In line with Washington average

Washington average: 53.7%

Successful return to home or community Info Rate of successful return to home or community from a skilled nursing facility. 39.3%
22% worse than Washington average

Washington average: 50.6%

Breakdown by payment type

Medicare

55% of new residents, usually for short-term rehab.

Typical stay 1 months

Private pay

25% of new residents, often for short stays.

Typical stay 1 months

Medicaid

20% of new residents, often for long-term daily care.

Typical stay 2 years

Facility Characteristics

Source: CMS Long-Term Care Facility Characteristics (Data as of Jan 2026)

Total residents 174
Medicare
14
8% of residents
Medicaid
151
86.8% of residents
Private pay or other
9
5.2% of residents
Programs & Services
Residents Group

Residents meet regularly to discuss policies, care quality, and activities

Clinical Research

Conducts clinical research trials to develop and test new treatments

Active Resident Council

Organized group of residents that meets regularly to discuss facility policies, quality of life, and activities.

Finances and operations

Privately-owned community
Operated by a business corporation.
Home revenue
$40.8M
Profit
$5.3M
Privately-owned community Operated by a business corporation.
Home revenue
$40.8M Rank #4 / 9Revenue — State benchmarkedThis home is ranked 4th out of 9 homes in District of Columbia. Shows this facility's annual revenue compared to the District of Columbia SNF average. Higher revenue generally means more resources for staffing and capital — read alongside Payroll %.Click the rank badge to see the full State ranking.Click here to see the full State ranking.
Profit
$5.3M
Payroll costs Info The portion of the home's budget spent on staff, including nurses, caregivers, and other employees who support care and operations. Rank #5 / 9Payroll — State benchmarkedThis home is ranked 5th out of 9 homes in District of Columbia. Shows total annual staff payroll benchmarked to the District of Columbia average. Higher payroll investment relative to peers often signals better staffing and less reliance on cheaper contract labor.Click the rank badge to see the full State ranking.Click here to see the full State ranking.
$13.7M
33.7% of revenue Rank #8 / 9Payroll % — State benchmarkedThis home is ranked 8th out of 9 homes in District of Columbia. Shows payroll as a percentage of revenue versus the District of Columbia average. Below 25% may signal understaffing or heavy agency use — read with Staffing ratings.Click the rank badge to see the full State ranking.Click here to see the full State ranking.
Other operating costs Info All remaining costs needed to run the home, such as food, utilities, building maintenance, supplies and administrative expenses.
$21.8M
Total costs $35.6M

Who this home usually serves

TYPE OF STAY

Mostly short-term rehab stays

Most residents typically stay for a few weeks or months before returning home or moving on.

Places of interest near Inspire Rehabilitation & Health Center

Address 0.9 miles from city center Info Estimated distance in miles from Washington's city center to Inspire Rehabilitation & Health Center's address, calculated via Google Maps. — 0.61 miles to nearest hospital (The GW Medical Faculty Associates)

Calculate Travel Distance to Inspire Rehabilitation & Health Center

Add your location

Address

Financial Assistance for
Nursing Home in Washington

Inspire Rehabilitation & Health Center is located in Nursing Homes in Washington, Washington.
Here are the financial assistance programs available to residents in Washington.

Get Financial aid guidance

Community Options Program Entry System (COPES)

WA Medicaid COPES

Age 65+ or disabled
General Washington resident, Medicaid-eligible, nursing home-level care need.
Income Limits (2025) ~$2,829/month 300% FBR, individual
Asset Limits $2,000 (individual), $3,000 (couple).
WA

High demand in urban areas (e.g., Seattle).

Benefits
Personal care (5-7 hours/day) Respite (240 hours/year) Adult day care ($70/day) Home modifications ($1,500 avg.)

Washington Family Caregiver Support Program

WA NFCSP

Age Caregiver of someone 60+ (or with dementia)
General Washington resident.
Income Limits No strict limit; prioritizes low-income.
Asset Limits Not applicable.
WA

High urban demand; rural outreach.

Benefits
In-home respite (4-6 hours/day) Adult day care (~$70/day) Short-term facility care (up to 5 days)

Community First Choice (CFC)

Washington Community First Choice

Age 65+ (or disabled 18+)
General WA resident, Medicaid-eligible, need help with 2+ ADLs/IADLs.
Income Limits (2025) ~$2,829/month; QIT optional.
Asset Limits $2,000 (individual), $3,000 (couple).
WA

Broader than COPES; serves ~20,000; self-directed option.

Benefits
Personal care (4-6 hours/day) Respite (~240 hours/year) Assistive devices Training Transportation

Older Americans Act (OAA) Services

Washington OAA Services

Age 60+
General WA resident; no income/asset limits.
Income Limits (2025) None; donations encouraged.
Asset Limits Not assessed.
WA

13 AAAs; includes Meals on Wheels; rural focus.

Benefits
Meals (~$5-$7/meal) Transportation Homemaker services (~4 hours/week) Respite (~5 days/year) Legal aid

Medicare Savings Program (MSP)

Washington Medicare Savings Program

Age 65+ or disabled
General WA resident, Medicare Part A/B.
Income Limits (2025) ~$2,510/month (QMB), ~$3,380/month (SLMB), ~$3,598/month (QI)—individual.
Asset Limits $9,430 (individual), $14,130 (couple).
WA

Includes Extra Help for Part D; no waitlist.

Benefits
Covers Part B premiums ($174.70/month) Deductibles ($240/year) Copays (~20%)

VA Aid and Attendance (A&A) and Housebound Benefits

Washington VA Aid and Attendance/Housebound

Age 65+ or disabled veteran/spouse
General WA resident, wartime service, ADL help (A&A) or homebound.
Income Limits (2025) Net income < ~$1,984/month (veteran with dependent, A&A); pension offsets income.
Asset Limits ~$155,356 net worth
WA

High veteran use; supports rural/urban needs.

Benefits
Cash (~$1,433-$2,642/month veteran, ~$951-$1,318 spouse) for care costs

Senior Citizens Property Tax Exemption

Washington Senior Property Tax Exemption

Age 61+ or disabled retiree
General WA resident, homeowner, income-based.
Income Limits (2025) ~$45,000-$70,000/year varies by county, e.g., King: $70,000
Asset Limits Not assessed; home value cap varies ~$250,000-$400,000
WA

Saves ~$500-$1,500/year; offered statewide.

Benefits
Tax exemption (~$500-$1,500/year depending on county)

Senior Farmers’ Market Nutrition Program (SFMNP)

Washington SFMNP

Age 60+
General WA resident, low-income.
Income Limits (2025) ~$2,322/month 185% FPL
Asset Limits Not assessed.
WA

Vouchers (~$80/season); serves ~20,000 via AAAs.

Benefits
Vouchers (~$80/season) for produce at farmers’ markets

Compare Nursing Home around Washington

5 facilities compared · CMS & DC Dept. of Health data

Filter by care type
Lisner-Louise-Dickson-Hurt-Home
NH

Nursing Home Licensed facility providing 24/7 skilled nursing care for residents with complex, ongoing medical needs. Staffed by RNs, LPNs, and CNAs. Inspected and star-rated annually by CMS. Accepts Medicare (short-term rehab) and Medicaid (long-term care).

AL

Assisted Living A licensed, long-term care setting for seniors or individuals with disabilities who need help with daily activities — like bathing, dressing, and medication management — but not 24-hour skilled nursing. Offers housing, meals, and around-the-clock support while aiming to maximize resident independence.

IL

Independent Living Lifestyle-focused communities for older adults offering dining, activities, and transportation with minimal personal care. Best for active, independent seniors who want community without medical support.

MC

Memory Care Secured, specialized care for people living with Alzheimer's or dementia. Staff trained in cognitive impairment, with higher staff-to-resident ratios and an environment designed to reduce confusion and wandering risk.

Assisted Living In Washington (Northwest Washington)116 44.9% -42%5.04 +4%+10%$0255.0-58 91 Jonathan Plater$22.2M$8.9M40.1%95025
Sibley Memorial Hosp Renaissance
NH

Nursing Home Licensed facility providing 24/7 skilled nursing care for residents with complex, ongoing medical needs. Staffed by RNs, LPNs, and CNAs. Inspected and star-rated annually by CMS. Accepts Medicare (short-term rehab) and Medicaid (long-term care).

AL

Assisted Living A licensed, long-term care setting for seniors or individuals with disabilities who need help with daily activities — like bathing, dressing, and medication management — but not 24-hour skilled nursing. Offers housing, meals, and around-the-clock support while aiming to maximize resident independence.

Nursing Homes In Washington (Northwest Washington)45--5.77 +88%+25%$23.8k346.8233 26 ----95030
Inspire Rehabilitation & Health Center
NH

Nursing Home Licensed facility providing 24/7 skilled nursing care for residents with complex, ongoing medical needs. Staffed by RNs, LPNs, and CNAs. Inspected and star-rated annually by CMS. Accepts Medicare (short-term rehab) and Medicaid (long-term care).

Nursing Homes In Washington (Northwest Washington)180 96.3% +25%4.04 -17%-12%$11.9k6312.62176 99 Bolaji Lakanse$40.8M$13.7M33.7%95031
Capitol City Rehabilitation and Healthcare DC
NH

Nursing Home Licensed facility providing 24/7 skilled nursing care for residents with complex, ongoing medical needs. Staffed by RNs, LPNs, and CNAs. Inspected and star-rated annually by CMS. Accepts Medicare (short-term rehab) and Medicaid (long-term care).

AL

Assisted Living A licensed, long-term care setting for seniors or individuals with disabilities who need help with daily activities — like bathing, dressing, and medication management — but not 24-hour skilled nursing. Offers housing, meals, and around-the-clock support while aiming to maximize resident independence.

HC

Home Care Professional care delivered in the person's own home — from companionship and errands to skilled nursing and therapy. Allows seniors to age in place. Medicare covers skilled home health when medically necessary.

RC

Respite Care Short-term temporary care — days to weeks — to give family caregivers a break. Full care provided during the stay. Often used after hospitalization or to trial a facility before a permanent placement decision.

Nursing Homes In Washington (Southeast Washington)360 85.9% +12%4.66 -13%+1%$508.6k13515.013287 73 Jacob Karmel$50.9M$27.6M54.3%95022
Unique Rehabilitation & Health Center
NH

Nursing Home Licensed facility providing 24/7 skilled nursing care for residents with complex, ongoing medical needs. Staffed by RNs, LPNs, and CNAs. Inspected and star-rated annually by CMS. Accepts Medicare (short-term rehab) and Medicaid (long-term care).

Nursing Homes In Washington (Northwest Washington)230 89.9% +17%3.98 -34%-14%$61.9k7512.55223 92 Regina Kim$48.6M$19.0M39%95036

Frequently Asked Questions about Inspire Rehabilitation & Health Center

What neighborhood is Inspire Rehabilitation & Health Center in?

Inspire Rehabilitation & Health Center is in the Northwest Washington neighborhood.

Is Inspire Rehabilitation & Health Center in a walkable area?

Inspire Rehabilitation & Health Center has a walk score of 99. Walker's paradise. Daily errands do not require a car, with many shops and services nearby.

What is the phone number of Inspire Rehabilitation & Health Center?

(202) 785-2577 will put you in contact with the team at Inspire Rehabilitation & Health Center.

Is Inspire Rehabilitation & Health Center Medicare or Medicaid certified?

Yes — Inspire Rehabilitation & Health Center is a CMS-certified provider of Medicare and Medicaid.

Guides for Better Senior Living

Care Cost Calculator: See Prices in Your Area

Nursing Home Data Explorer

Don’t Wait Too Long: 7 Red Flag Signs Your Parent Needs Assisted Living Now

The True Cost of Assisted Living in 2025 – And How Families Are Paying For It

Understanding Senior Living Costs: Pricing Models, Discounts & Financial Assistance

Explore Open Rooms
1 Contact details
2 What type of senior care service are you looking for?
3 What budget do you have in mind for senior care?
4 How soon do you need to find care?
5 Additional details

Thank you for your interest!

Our team will be in touch shortly to help with next steps.