Landmark of Plano
CMS overall rating Info CMS (the Centers for Medicare & Medicaid Services) is the federal agency that rates nursing home quality. Its Overall Rating runs from 1 to 5 stars, combining health inspections, staffing, and quality measures, with inspections weighted most heavily.

Landmark of Plano

CMS overall rating Info CMS (the Centers for Medicare & Medicaid Services) is the federal agency that rates nursing home quality. Its Overall Rating runs from 1 to 5 stars, combining health inspections, staffing, and quality measures, with inspections weighted most heavily.
Calculator: See prices in your area
Landmark of Plano accepts Medicare, Medicaid, and private pay.

Overview of Landmark of Plano

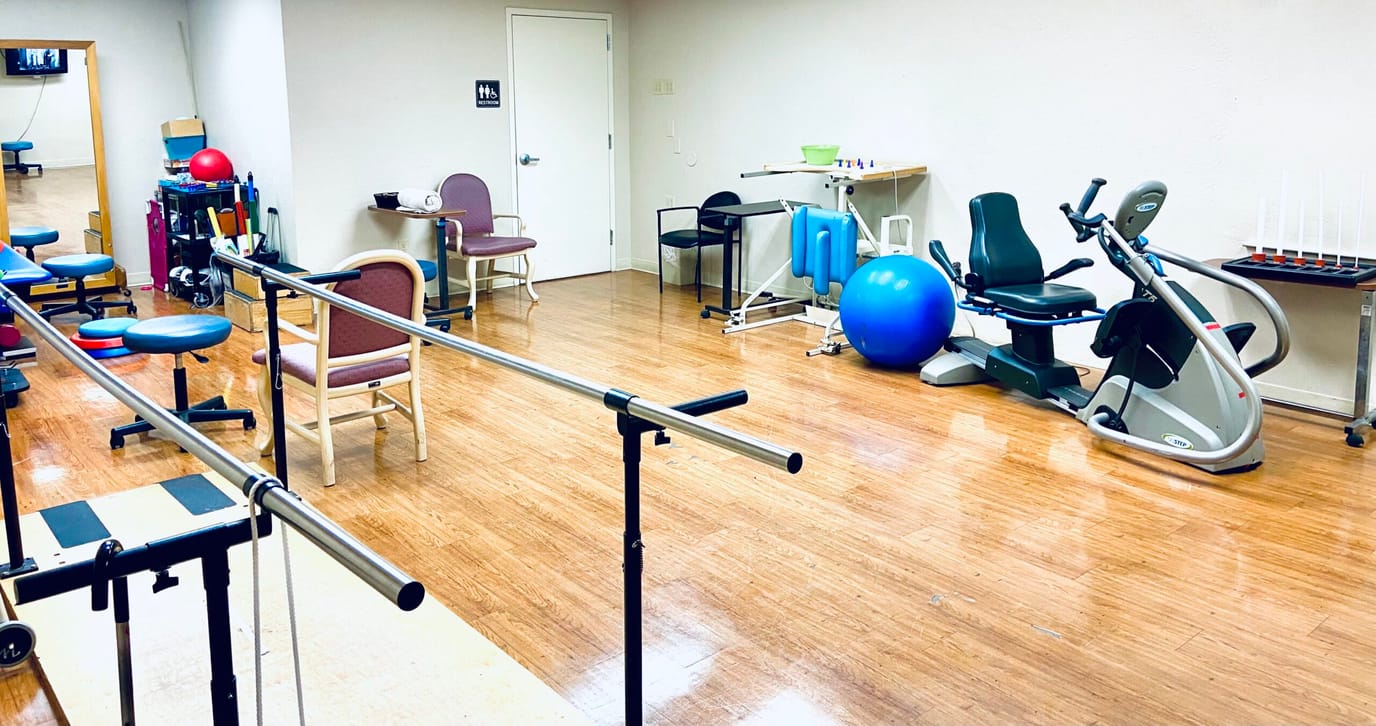
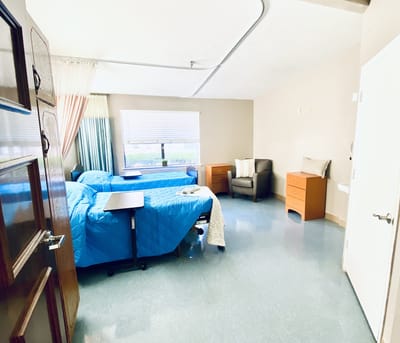
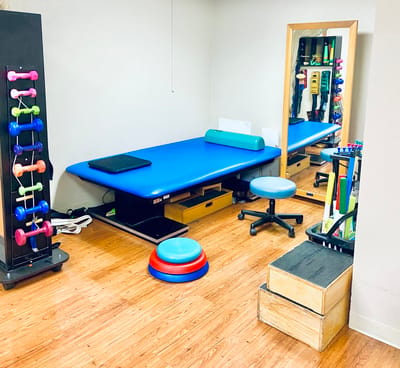
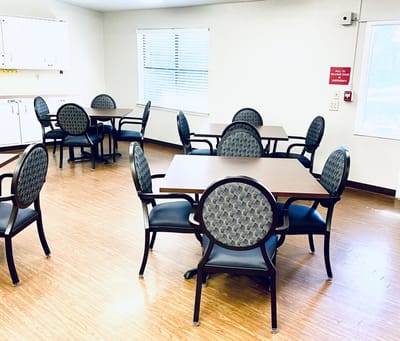
Landmark of Plano, located in Plano, TX, is a facility that offers skilled nursing and rehabilitation services to its residents. For residents in need of skilled nursing care, the team of professional and licensed staff provides 24/7 skilled nursing, early to late-stage dementia care, on-going dementia and behavioral education, as well as physical, occupational, and speech therapy.  Additionally they are accepting both Medicare and Medicaid payments, as well as most major HMO and insurances.

As part of the services provided, their residents are also given delicious menus that feature a balanced diet, and prepared under the guidance of a registered dietician. Residents are also encouraged to take advantage of the other amenities provided during their stay such as the basic cable tv service, on site podiatry, dental, and audiology services, and the secure patio for relaxation.

Quality ratings

Measured by Centers for Medicare & Medicaid Services (CMS)

Overall rating Info The Overall CMS Rating combines results from health inspections, staffing levels and quality measures. Health inspections carry the most weight. Staffing and quality scores can increase or decrease the final rating based on performance compared to state and national standards.
▼ 64.2% Below TX avg. ▼ 64.2% Below TX avg.TX average: 2.8Click the badge to see the full State ranking.Click here to see the full State ranking.
Health Inspection Info Based on the results of the facility's three most recent standard inspections and any complaint investigations. CMS reviews the number, scope, and severity of deficiencies, with more recent findings weighted more heavily.
▼ 63.8% Below TX avg. ▼ 63.8% Below TX avg.TX average: 2.8Click the badge to see the full State ranking.Click here to see the full State ranking.
Staffing Info Measures average nursing staff hours per resident per day, including Registered Nurses (RNs) and total nursing staff. Ratings are adjusted based on the level of care residents require and are compared to state and national benchmarks.
▼ 52.9% Below TX avg. ▼ 52.9% Below TX avg.TX average: 2.1Click the badge to see the full State ranking.Click here to see the full State ranking.
Quality Measures Info Based on clinical and physical health indicators reported to CMS, such as hospital readmissions, falls, pressure ulcers, and improvements in mobility. These measures reflect how well residents' health needs are being managed.
▼ 73.4% Below TX avg. ▼ 73.4% Below TX avg.TX average: 3.8Click the badge to see the full State ranking.Click here to see the full State ranking.

Staffing hours breakdown

Info Daily nursing hours per resident by staff type, reported to CMS. Higher is generally better — compare this facility to state and national averages to see where staffing stands.

Hours per resident per day — compared to Texas state averages

Total nursing care / resident Info This home is ranked 184th out of 289 homes in Texas for nurse hours. Total adjusted nursing hours per resident per day, combining RN, LPN, and aide time. CMS adjusts this for case-mix so facilities can be fairly compared.
3h 19m per day
Rank #184 / 289Nurse hours — State benchmarkedThis home is ranked 184th out of 289 homes in Texas. Shows adjusted nurse hours per resident per day benchmarked to the Texas average, with a ranking across 289 Texas facilities. More hours mean more direct care. The national average is about 3.5 hrs; below 3.0 is a red flag.Click the rank badge to see the full State ranking.Click here to see the full State ranking.
This facility Texas avg (3h 38m per day)
vs Texas avg
-9%

4 of 6 metrics below state avg

Standout metric Physical Therapist is +91% above state avg
Staff typeHours / Day / Residentvs state avg
Registered Nurse (RN) Info RNs hold the highest nursing license and can assess residents, interpret test results, and direct care plans. More RN hours per day often signals stronger clinical oversight and faster response to health changes. 24m per day ▼ 9% State avg: 26m per day · National avg: 41m per day
LPN / LVN Info Licensed Practical Nurses (LPNs) or Licensed Vocational Nurses (LVNs) deliver routine hands-on care — medication administration, wound dressing, and monitoring vital signs. They work under RN supervision and make up a large share of daily bedside care. 56m per day ■ Avg State avg: 57m per day · National avg: 52m per day
Nurse Aide Info Certified Nurse Aides (CNAs) provide the most direct day-to-day assistance: bathing, dressing, feeding, and mobility. Nurse aide hours are typically the largest staffing category and directly affect residents' quality of life. 1h 48m per day ▼ 11% State avg: 2h 1m per day · National avg: 2h 21m per day
Weekend Total Nursing Info Combined nursing hours (RN + LPN + Nurse Aide) per resident per day on weekends. Staffing often drops on weekends — this figure reveals whether the facility maintains adequate coverage outside of weekday hours. 2h 45m per day ▼ 8% State avg: 2h 59m per day · National avg: 3h 26m per day
Physical Therapist Info Hours per resident per day provided by licensed Physical Therapists (PTs) or PT Assistants. PT services help residents recover mobility after injury or illness and are especially important for post-acute (short-stay) rehabilitation. 8m per day ▲ 91% State avg: 4m per day · National avg: 4m per day
Weekend RN Info Registered nurse hours specifically on weekends. Facilities sometimes reduce RN presence on Saturdays and Sundays — a low weekend RN figure compared to weekday hours can indicate reduced clinical oversight when most administrative staff are absent. 18m per day ▼ 12% State avg: 21m per day · National avg: 29m per day

Capacity and availability

This home usually has availability

Lower occupancy than the Texas average: 63.5%
Occupancy rate
41.7% Rank #262 / 297Occupancy rate — State benchmarkedThis home is ranked 262nd out of 297 homes in Texas. Shows this facility's occupancy rate versus the Texas average, with its Statewide rank out of 297. Higher occupancy signals strong local demand and financial stability.Click the rank badge to see the full State ranking.Click here to see the full State ranking.
Avg. Length of Stay
164 days
Walk Score
Walk Score: 60 / 100 Rank #293 / 1391Walk Score — State benchmarkedThis home is ranked 293rd out of 1391 homes in Texas. Shows how walkable this facility's neighborhood is compared to the average Walk Score across Texas facilities. Higher scores benefit residents, families, and staff.Click the rank badge to see the full State ranking.Click here to see the full State ranking.
Moderately walkable. Some errands can be accomplished on foot, with a mix of nearby amenities.

About this community

Therapy & Rehabilitation

2 services
Rehabilitation Services
Respite Care

Staffing & Medical

1 service
24-Hour Staffing

Amenities & Lifestyle

Beauty & Barber Services
Transportation Services

Dining & Nutrition

Food DescriptionHealthy, nutritious, and delicious meals prepared for residents daily.

Contact Landmark of Plano

Staffing Data

Reporting period: October 1 – December 31, 2025 (Q4 2025). Source: CMS Payroll-Based Journal report.

Total staff 80
Employees 78
Contractors 2
Staff to resident ratio 1.04 : 1
30% fewer staff per resident than Texas average
Texas average ratio: 1.48 : 1 Texas average ratio: 1.48 : 1See full Texas ranking
Avg staff/day 32
Average shift 8.8 hours
9% better than Texas average
Texas average: 8.1 hours Texas average shift: 8.1 hoursSee full Texas ranking
Total staff hours (quarter) 25,927

Nursing staff breakdown

Q4 2025 · Oct 1 – Dec 31 More info This data comes from the CMS Payroll-Based Journal report covering October 1 – December 31, 2025.
Registered Nurse

Manages medical care and health needs.

RN Staff Info All 7 RN Staff are full-time employees. No contractors work on this role. 7
Average shift length Info Average shift length. Calculated as total hours divided by days worked and average staff per day. 8.6 hours
Licensed Practical Nurse

Assists with medical care and medications.

LPN Staff Info All 15 LPN Staff are full-time employees. No contractors work on this role. 15
Average shift length Info Average shift length. Calculated as total hours divided by days worked and average staff per day. 9.1 hours
Certified Nursing Assistant

Helps with daily care and mobility.

CNA Staff Info All 24 CNA Staff are full-time employees. No contractors work on this role. 24
Average shift length Info Average shift length. Calculated as total hours divided by days worked and average staff per day. 9.2 hours

Contractor staffing

Q4 2025 · Oct 1 – Dec 31 More info This data comes from the CMS Payroll-Based Journal report covering October 1 – December 31, 2025.

Total hours from contractors

0.1%

38 contractor hours this quarter

Occupational Therapy Aide: 1 Medical Director: 1

Staff by category

Q4 2025 · Oct 1 – Dec 31 More info This data comes from the CMS Payroll-Based Journal report covering October 1 – December 31, 2025.
Certified Nursing Assistant2402410,70492100%9.2
Licensed Practical Nurse150154,83892100%9.1
Medication Aide/Technician6062,20692100%11.2
RN Director of Nursing4041,81392100%10.4
Registered Nurse7071,76592100%8.6
Respiratory Therapy Technician3039126773%7.3
Qualified Social Worker3036307480%5.7
Clinical Nurse Specialist1015566672%8.4
Nurse Practitioner1015206571%8
Administrator2025126470%8
Dietitian1015116267%8.2
Physical Therapy Aide1013677480%5
Speech Language Pathologist5052133841%4.9
Physical Therapy Assistant4041854852%3.3
Other Dietary Services Staff1011592325%6.9
Occupational Therapy Aide0113278%4.6
Medical Director011633%2
24 Certified Nursing Assistant
% of Days 100%
15 Licensed Practical Nurse
% of Days 100%
6 Medication Aide/Technician
% of Days 100%
4 RN Director of Nursing
% of Days 100%
7 Registered Nurse
% of Days 100%
3 Respiratory Therapy Technician
% of Days 73%
3 Qualified Social Worker
% of Days 80%
1 Clinical Nurse Specialist
% of Days 72%
1 Nurse Practitioner
% of Days 71%
2 Administrator
% of Days 70%
1 Dietitian
% of Days 67%
1 Physical Therapy Aide
% of Days 80%
5 Speech Language Pathologist
% of Days 41%
4 Physical Therapy Assistant
% of Days 52%
1 Other Dietary Services Staff
% of Days 25%
1 Occupational Therapy Aide
% of Days 8%
1 Medical Director
% of Days 3%

Penalties and fines

Includes penalties issued in 2023-2025

Federal penalties imposed by CMS for regulatory violations, including civil money penalties (fines) and denials of payment for new Medicare/Medicaid admissions.

Source: CMS Penalties Database (Data as of Jan 2026)

Total fines amount $80K Rank #231 / 294Federal fines — State benchmarkedThis home is ranked 231st out of 294 homes in Texas. Shows this facility's cumulative CMS federal fine dollars versus the Texas average among facilities with fines, and where it ranks among 294 facilities in the pool. Lower total dollars mean a better rank.Click the rank badge to see the full State ranking.Click here to see the full State ranking.
In line with Texas average

Texas average: $80K

Number of fines 2
20% fewer fines than Texas average

Texas average: 2.5

Payment Denials Info Serious action where Medicare and/or Medicaid temporarily stops payments for new residents until issues are fixed. 1
354% more payment denials than Texas average

Texas average: 0.2

Fines amount comparison
This facility $80K
Texas average $80K
Penalty History

Penalties are imposed by CMS for violations of federal nursing home regulations.

3 penalties in the past 3 years

Multiple penalties were reported in the last 3 years.

Payment Denial Info Serious action where Medicare and/or Medicaid temporarily stops payments for new residents until issues are fixed. Aug 26, 2025
1 days
Civil Money Penalty Info Fines imposed for noncompliance, which can be assessed per day or per instance of violation. Feb 4, 2025
$9K
Civil Money Penalty Info Fines imposed for noncompliance, which can be assessed per day or per instance of violation. Jun 23, 2023
$71K

Last updated: Jan 2026

Quality of care over time

These measures show how residents usually do over time at this home, based on health outcomes and preventive care.

High-risk clinical events score Info A composite score based on pressure ulcers, falls with injury, weight loss, walking ability decline, and activities of daily living decline. 13.5
57% worse than Texas average

Texas average: 8.6

Functional decline score Info A composite score based on activities of daily living decline, walking ability decline, and incontinence. 26.7
66% worse than Texas average

Texas average: 16.0

Long-stay resident measures
Above average Texas avg: 4.1 Info CMS star rating based on long-stay quality measure performance. 5 stars = significantly above average, 1 star = significantly below average.
Need for Help with Daily Activities Increased Info Percent of long-stay residents whose need for help with daily activities has increased 36.1%
124% worse than Texas average

Texas average: 16.2%

Walking Ability Worsened Info Percent of long-stay residents whose ability to move independently worsened 20.7%
28% worse than Texas average

Texas average: 16.2%

Low Risk Residents with Bowel/Bladder Incontinence Info Percent of low risk long-stay residents who lose control of their bowels or bladder 23.2%
48% worse than Texas average

Texas average: 15.7%

Falls with Major Injury Info Percent of long-stay residents experiencing one or more falls with major injury 1.8%
45% better than Texas average

Texas average: 3.2%

High Risk Residents with Pressure Ulcers Info Percent of long-stay high risk residents with pressure ulcers 4.3%
In line with Texas average

Texas average: 4.4%

Urinary Tract Infection Info Percent of long-stay residents with a urinary tract infection 0.0%
100% better than Texas average

Texas average: 0.8%

Lost Too Much Weight Info Percent of long-stay residents who lose too much weight 4.5%
30% worse than Texas average

Texas average: 3.5%

Depressive Symptoms Info Percent of long-stay residents who have depressive symptoms 0.0%
100% better than Texas average

Texas average: 2.9%

Antipsychotic Use Info Percent of long-stay residents who received an antipsychotic medication 13.7%
74% worse than Texas average

Texas average: 7.9%

Pneumococcal Vaccine Info Percent of long-stay residents assessed and appropriately given the pneumococcal vaccine 97.3%
In line with Texas average

Texas average: 97.3%

Influenza Vaccine Info Percent of long-stay residents assessed and appropriately given the seasonal influenza vaccine 100.0%
In line with Texas average

Texas average: 97.9%

Hospitalizations per 1,000 days Info Number of hospitalizations per 1,000 long-stay resident days. 1.79
16% better than Texas average

Texas average: 2.13

ED visits per 1,000 days Info Number of outpatient emergency department visits per 1,000 long-stay resident days. 1.43
31% better than Texas average

Texas average: 2.07

Short-stay resident measures
Significantly below average Texas avg: 3.1 Info CMS star rating based on short-stay quality measure performance. 5 stars = much above average, 1 star = much below average.
Pneumococcal Vaccine Info Percent of short-stay residents assessed and appropriately given the pneumococcal vaccine 99.4%
10% better than Texas average

Texas average: 90.4%

Antipsychotic medication increase Info Percent of short-stay residents who newly received an antipsychotic medication 4.6%
219% worse than Texas average

Texas average: 1.4%

Influenza Vaccine Info Percent of short-stay residents assessed and appropriately given the seasonal influenza vaccine 100.0%
14% better than Texas average

Texas average: 88.0%

Re-hospitalized after SNF stay Info Percentage of short-stay residents who were re-hospitalized after their nursing home admission. 41.7%
61% worse than Texas average

Texas average: 25.9%

Emergency department visits Info Percentage of short-stay residents who had an outpatient emergency department visit. 18.3%
53% worse than Texas average

Texas average: 12.0%

Falls with major injury Info Percentage of SNF residents who experience falls with major injury during their stay. 4.4%
465% worse than Texas average

Texas average: 0.8%

Breakdown by payment type

Medicare

24% of new residents, usually for short-term rehab.

Typical stay 1 - 2 months

Private pay

40% of new residents, often for short stays.

Typical stay 2 - 3 months

Medicaid

36% of new residents, often for long-term daily care.

Typical stay 10 months

Facility Characteristics

Source: CMS Long-Term Care Facility Characteristics (Data as of Jan 2026)

Total residents 77
Medicare
3
3.9% of residents
Medicaid
57
74% of residents
Private pay or other
17
22.1% of residents
Programs & Services
Residents Group

Residents meet regularly to discuss policies, care quality, and activities

Active Resident Council

Organized group of residents that meets regularly to discuss facility policies, quality of life, and activities.

Finances and operations

Based on the 2024 CMS SNF Cost Report.

Privately-owned community
Operated by a single business entity.
Home revenue
$4.7M
Operating loss
-$1.4M
Privately-owned community Operated by a single business entity.
Home revenue
$4.7M Rank #279 / 297Revenue — State benchmarkedThis home is ranked 279th out of 297 homes in Texas. Shows this facility's annual revenue compared to the Texas average. Higher revenue generally means more resources for staffing and capital — read alongside Payroll %.Click the rank badge to see the full State ranking.Click here to see the full State ranking.
Operating loss
-$1.4M
Payroll costs Info The portion of the home's budget spent on staff, including nurses, caregivers, and other employees who support care and operations. Rank #263 / 297Payroll — State benchmarkedThis home is ranked 263rd out of 297 homes in Texas. Shows total annual staff payroll benchmarked to the Texas average. Higher payroll investment relative to peers often signals better staffing and less reliance on cheaper contract labor.Click the rank badge to see the full State ranking.Click here to see the full State ranking.
$3.1M
66.1% of revenue Rank #23 / 297Payroll % — State benchmarkedThis home is ranked 23rd out of 297 homes in Texas. Shows payroll as a percentage of revenue versus the Texas average. Well-run Texas facilities typically land around 51–63% — the top third Statewide. Below 25% may signal understaffing or heavy agency use — read with Staffing ratings.Click the rank badge to see the full State ranking.Click here to see the full State ranking.
Other operating costs Info All remaining costs needed to run the home, such as food, utilities, building maintenance, supplies and administrative expenses.
$3.0M
Total costs $6.1M

Who this home usually serves

TYPE OF STAY

Mix of rehab and long-term care

This home supports both short-term rehab and long-term care, with residents staying for a wide range of durations.

New residents most often arrive under private pay (40% of admissions), and a typical private pay stay runs around 2 - 3 months.

Admissions
121 total

Coverage residents most often arrive under.

Medicare 24%
Private pay 40%
Medicaid 36%
Discharges
112 total

Coverage residents most often leave under.

Medicare 11%
Private pay 39%
Medicaid 50%

Places of interest near Landmark of Plano

Address 4.3 miles from city center Info Estimated distance in miles from Plano's city center to Landmark of Plano's address, calculated via Google Maps. — 1.36 miles to nearest hospital (Baylor Scott & White Medical Center - Plano)

Calculate Travel Distance to Landmark of Plano

Add your location

Address

Financial Assistance for
Nursing Home in Texas

Landmark of Plano is located in Plano, Texas.
Here are the financial assistance programs available to residents in Texas.

Get Financial aid guidance

Community Care for the Aged and Disabled (CCAD)

TX Medicaid CCAD

Age 65+ or disabled
General Texas resident, Medicaid-eligible, care need (not always nursing home level).
Income Limits (2025) ~$2,829/month 300% FBR, individual
Asset Limits $2,000 (individual), $3,000 (couple).
TX

Large state; rural access challenges.

Benefits
Personal care (5-7 hours/day) Respite (240 hours/year) Adult day care (~$60/day) Home aides

Texas Community Care Services

TX CCS

Age 60+
General Texas resident, at risk of decline.
Income Limits ~$2,000/month individual, varies
Asset Limits $5,000 individual
TX

Limited funding; high demand in urban areas.

Benefits
In-home care (3-5 hours/week) Respite (up to 10 days/year) Transportation (~5 trips/month)

Area Agency on Aging (AAA) Services

Texas AAA Services

Age 60+
General TX resident; no income/asset limits.
Income Limits (2025) None; donations encouraged.
Asset Limits Not assessed.
TX

28 AAAs; includes Meals on Wheels in some areas.

Benefits
Meals (~$5-$7/meal) Transportation Homemaker services (~4 hours/week) Respite (~5 days/year) Legal aid

Medicare Savings Program (MSP)

Texas Medicare Savings Program

Age 65+ or disabled
General TX resident, Medicare Part A/B.
Income Limits (2025) ~$2,510/month (QMB), ~$3,380/month (SLMB), ~$3,598/month (QI)—individual.
Asset Limits $9,430 (individual), $14,130 (couple).
TX

Includes Extra Help for Part D; no waitlist.

Benefits
Covers Part B premiums ($174.70/month) Deductibles ($240/year) Copays (~20%)

Family Caregiver Support Program (FCSP)

Texas Family Caregiver Support Program

Age
General Caregivers of 60+ needing care or 55+ caregivers of others; TX resident; 2+ ADLs.
Income Limits (2025) No strict cap; prioritizes low-income ~$24,980/year
Asset Limits Not assessed.
TX

High rural demand; includes grandparent caregivers.

Benefits
Respite (4-6 hours/week or 5 days/year) Adult day care ($60/day) Training Supplies (~$500/year)

VA Aid and Attendance (A&A) and Housebound Benefits

Texas VA Aid and Attendance/Housebound

Age 65+ or disabled veteran/spouse
General TX resident, wartime service, ADL help (A&A) or homebound.
Income Limits (2025) Net income < ~$1,984/month (veteran with dependent, A&A); pension offsets income.
Asset Limits ~$155,356 net worth
TX

High veteran population; supports rural/urban needs.

Benefits
Cash (~$1,433-$2,642/month veteran, ~$951-$1,318 spouse) for care costs

Property Tax Exemption for Seniors

Texas Senior Property Tax Exemption

Age 65+
General TX resident, homeowner (homestead).
Income Limits (2025) None; tax-based eligibility.
Asset Limits Not assessed.
TX

$25,000+ exemption; optional freeze in some counties; saves ~$500-$1,000/year.

Benefits
Tax exemption or freeze (~$500-$1,000/year savings)

Senior Farmers’ Market Nutrition Program (SFMNP)

Texas SFMNP

Age 60+
General TX resident, low-income.
Income Limits (2025) ~$2,322/month 185% FPL
Asset Limits Not assessed.
TX

Vouchers (~$50/season); serves ~20,000 via 28 AAAs.

Benefits
Vouchers (~$50/season) for produce at farmers’ markets

Compare Nursing Home around Plano

The information below is reported by the Texas Health and Human Services Commission.

5 facilities compared · CMS & TX Dept. of Health data

The Legacy at Willow Bend
NH

Nursing Home Licensed facility providing 24/7 skilled nursing care for residents with complex, ongoing medical needs. Staffed by RNs, LPNs, and CNAs. Inspected and star-rated annually by CMS. Accepts Medicare (short-term rehab) and Medicaid (long-term care).

AL

Assisted Living A licensed, long-term care setting for seniors or individuals with disabilities who need help with daily activities — like bathing, dressing, and medication management — but not 24-hour skilled nursing. Offers housing, meals, and around-the-clock support while aiming to maximize resident independence.

HC

Home Care Professional care delivered in the person's own home — from companionship and errands to skilled nursing and therapy. Allows seniors to age in place. Medicare covers skilled home health when medically necessary.

HC

Home Care Professional care delivered in the person's own home — from companionship and errands to skilled nursing and therapy. Allows seniors to age in place. Medicare covers skilled home health when medically necessary.

IL

Independent Living Lifestyle-focused communities for older adults offering dining, activities, and transportation with minimal personal care. Best for active, independent seniors who want community without medical support.

MC

Memory Care Secured, specialized care for people living with Alzheimer's or dementia. Staff trained in cognitive impairment, with higher staff-to-resident ratios and an environment designed to reduce confusion and wandering risk.

Plano
60
Facility 60
TX AVG 80
Rank #583 / 988
96.5%
Facility 96.5%
TX AVG 63.5%
Rank #6 / 297
+52%
5.73
Facility 5.73
TX AVG 3.63
Rank #9 / 289
+54%+58%
$0
Facility $0
TX AVG $81.8k
Rank #1 / 294
17
Facility 17
TX AVG 25.9
Rank #89 / 292
5.7
Facility 5.7
TX AVG 3.7
Rank #277 / 292
-56A+
45
Facility 45
TX AVG 41
Rank #628 / 1391
The Legacy Willow Bend, Inc.
$29.7M
Facility $29.7M
TX AVG $8.4M
Rank #15 / 297
$13.7M
Facility $13.7M
TX AVG $3.5M
Rank #12 / 297
46%
Facility 46%
TX AVG 47%
Rank #155 / 297
676189
Life Care Center of Plano
NH

Nursing Home Licensed facility providing 24/7 skilled nursing care for residents with complex, ongoing medical needs. Staffed by RNs, LPNs, and CNAs. Inspected and star-rated annually by CMS. Accepts Medicare (short-term rehab) and Medicaid (long-term care).

Plano
120
Facility 120
TX AVG 80
Rank #210 / 988
57.2%
Facility 57.2%
TX AVG 63.5%
Rank #208 / 297
-10%
3.66
Facility 3.66
TX AVG 3.63
Rank #105 / 289
-35%+1%
$8.3k
Facility $8.3k
TX AVG $81.8k
Rank #104 / 294
19
Facility 19
TX AVG 25.9
Rank #123 / 292
3.8
Facility 3.8
TX AVG 3.7
Rank #196 / 292
162A+
83
Facility 83
TX AVG 41
Rank #23 / 1391
-
$11.2M
Facility $11.2M
TX AVG $8.4M
Rank #143 / 297
$6.1M
Facility $6.1M
TX AVG $3.5M
Rank #95 / 297
54.3%
Facility 54.3%
TX AVG 47%
Rank #69 / 297
455864
The Park in Plano
NH

Nursing Home Licensed facility providing 24/7 skilled nursing care for residents with complex, ongoing medical needs. Staffed by RNs, LPNs, and CNAs. Inspected and star-rated annually by CMS. Accepts Medicare (short-term rehab) and Medicaid (long-term care).

Plano
120
Facility 120
TX AVG 80
Rank #210 / 988
58.1%
Facility 58.1%
TX AVG 63.5%
Rank #205 / 297
-8%
3.35
Facility 3.35
TX AVG 3.63
Rank #167 / 289
+5%-8%
$0
Facility $0
TX AVG $81.8k
Rank #1 / 294
35
Facility 35
TX AVG 25.9
Rank #234 / 292
3.5
Facility 3.5
TX AVG 3.7
Rank #173 / 292
-77C-
79
Facility 79
TX AVG 41
Rank #38 / 1391
-
$7.5M
Facility $7.5M
TX AVG $8.4M
Rank #240 / 297
$4.3M
Facility $4.3M
TX AVG $3.5M
Rank #196 / 297
57.9%
Facility 57.9%
TX AVG 47%
Rank #44 / 297
675113
The Collinwood Care Center
NH

Nursing Home Licensed facility providing 24/7 skilled nursing care for residents with complex, ongoing medical needs. Staffed by RNs, LPNs, and CNAs. Inspected and star-rated annually by CMS. Accepts Medicare (short-term rehab) and Medicaid (long-term care).

PC

Palliative Care

Plano
120
Facility 120
TX AVG 80
Rank #210 / 988
52.5%
Facility 52.5%
TX AVG 63.5%
Rank #234 / 297
-17%
3.83
Facility 3.83
TX AVG 3.63
Rank #88 / 289
-22%+6%
$78.6k
Facility $78.6k
TX AVG $81.8k
Rank #226 / 294
22
Facility 22
TX AVG 25.9
Rank #158 / 292
3.7
Facility 3.7
TX AVG 3.7
Rank #190 / 292
360A+
55
Facility 55
TX AVG 41
Rank #387 / 1391
Dsj Healthcare Inc
$3.2M
Facility $3.2M
TX AVG $8.4M
Rank #294 / 297
$2.2M
Facility $2.2M
TX AVG $3.5M
Rank #284 / 297
67.6%
Facility 67.6%
TX AVG 47%
Rank #19 / 297
675453
Landmark of Plano
NH

Nursing Home Licensed facility providing 24/7 skilled nursing care for residents with complex, ongoing medical needs. Staffed by RNs, LPNs, and CNAs. Inspected and star-rated annually by CMS. Accepts Medicare (short-term rehab) and Medicaid (long-term care).

Plano (Coit Road)
160
Facility 160
TX AVG 80
Rank #44 / 988
41.7%
Facility 41.7%
TX AVG 63.5%
Rank #262 / 297
-34%
3.31
Facility 3.31
TX AVG 3.63
Rank #184 / 289
+15%-9%
$79.9k
Facility $79.9k
TX AVG $81.8k
Rank #231 / 294
41
Facility 41
TX AVG 25.9
Rank #247 / 292
3.4
Facility 3.4
TX AVG 3.7
Rank #163 / 292
378-
60
Facility 60
TX AVG 41
Rank #293 / 1391
Landmark Of Plano Rehabilitation And Nursing Center LLC
$4.7M
Facility $4.7M
TX AVG $8.4M
Rank #279 / 297
$3.1M
Facility $3.1M
TX AVG $3.5M
Rank #263 / 297
66.1%
Facility 66.1%
TX AVG 47%
Rank #23 / 297
455861

Frequently Asked Questions about Landmark of Plano

What neighborhood is Landmark of Plano in?

Landmark of Plano is in the Coit Road neighborhood.

Is Landmark of Plano in a walkable area?

Landmark of Plano has a walk score of 60. Moderately walkable. Some errands can be accomplished on foot, with a mix of nearby amenities.

What is the occupancy rate at Landmark of Plano?

Landmark of Plano's occupancy is 41.7%.

Are there photos of Landmark of Plano?

Yes — there are 7 photos of Landmark of Plano in the photo gallery on this page.

What is the phone number of Landmark of Plano?

(972) 596-7930 will put you in contact with the team at Landmark of Plano.

Is Landmark of Plano Medicare or Medicaid certified?

Yes — Landmark of Plano is a CMS-certified provider of Medicare and Medicaid.

Guides for Better Senior Living

Care Cost Calculator: See Prices in Your Area

Nursing Home Data Explorer

Don’t Wait Too Long: 7 Red Flag Signs Your Parent Needs Assisted Living Now

The True Cost of Assisted Living in 2025 – And How Families Are Paying For It

Understanding Senior Living Costs: Pricing Models, Discounts & Financial Assistance

Explore Open Rooms
1 Contact details
2 What type of senior care service are you looking for?
3 What budget do you have in mind for senior care?
4 How soon do you need to find care?
5 Additional details

Thank you for your interest!

Our team will be in touch shortly to help with next steps.