The Legacy at Willow Bend
Nursing Home, Independent Living, Assisted Living & Memory Care · Plano, TX
CMS overall rating Info The Overall CMS Rating is scored from 1 to 5 stars and combines results from health inspections, staffing levels, and quality measures. Health inspections carry the most weight. Staffing and quality scores can increase or decrease the final rating based on performance compared to state and national standards.

The Legacy at Willow Bend

Nursing Home, Independent Living, Assisted Living & Memory Care · Plano, TX
CMS overall rating Info The Overall CMS Rating is scored from 1 to 5 stars and combines results from health inspections, staffing levels, and quality measures. Health inspections carry the most weight. Staffing and quality scores can increase or decrease the final rating based on performance compared to state and national standards.
Calculator: See prices in your area
The Legacy at Willow Bend accepts Medicaid, Medicare, and private pay.

Overview of The Legacy at Willow Bend

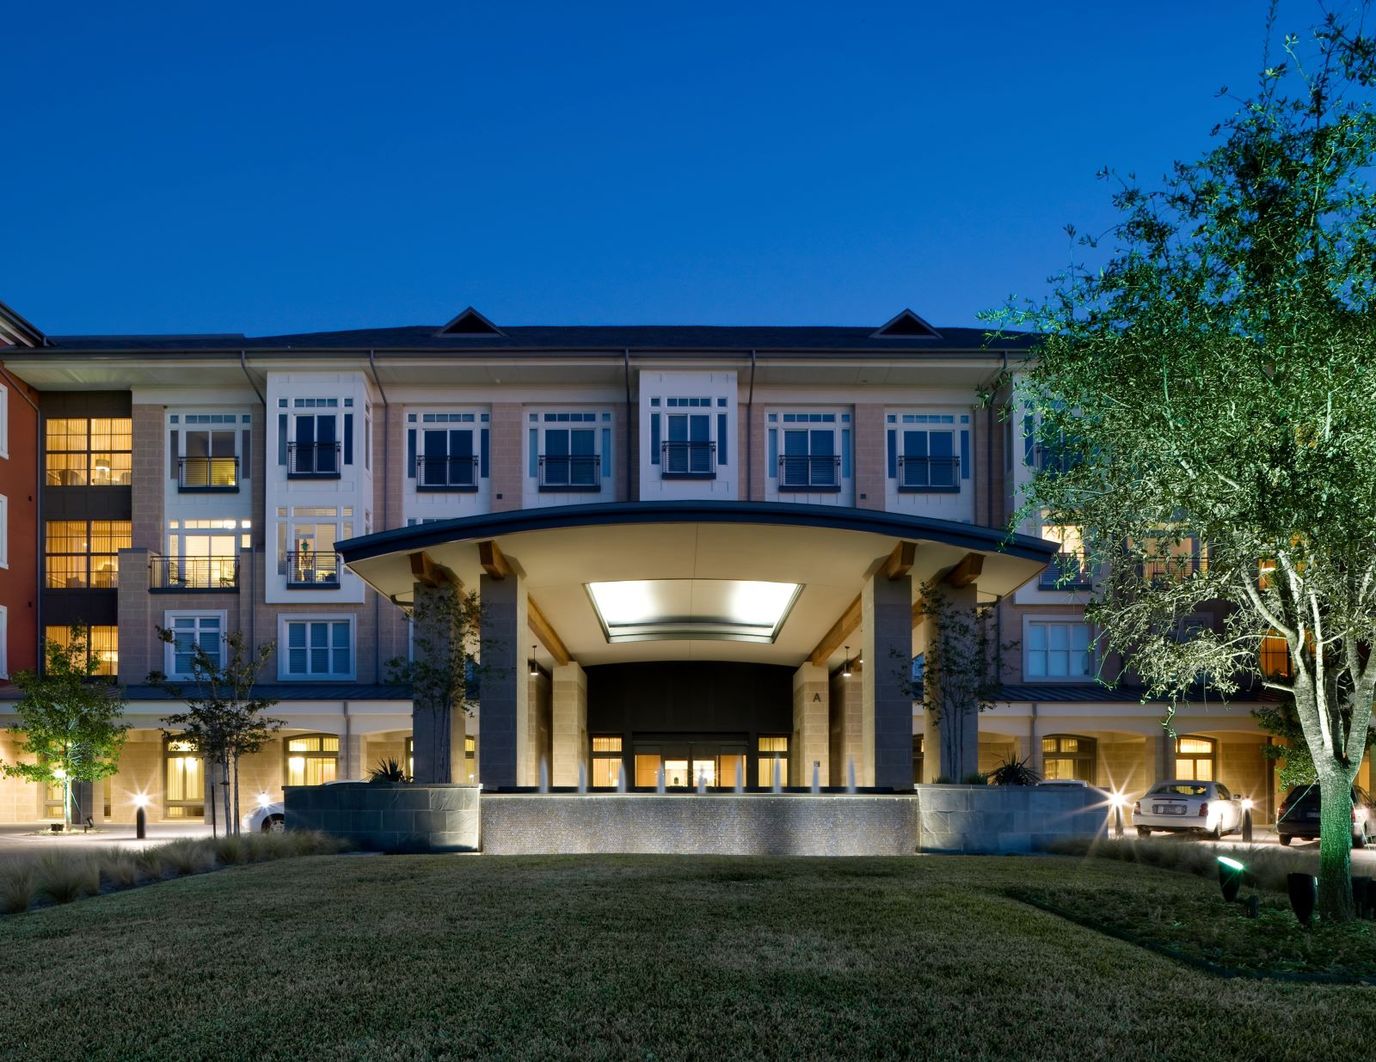
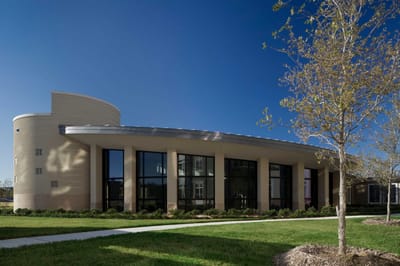
The Legacy at Willow Bend is a premier senior living community located in Plano, TX, that offers independent living, assisted living, and memory care services to its residents. They boast of their luxury surroundings and accommodations, delicious dining options, as well as five star service and amenities. Their community programs aim to keep residents active and socially engaged, and at the same time fulfilled and excited to live their retirement years to the fullest.

This senior living community offers chef prepared meals with special diet accommodations, access to fitness and aquatics center, as well as access to their full service salon. With a promise of a luxury, worry-free lifestyle, The Legacy at Willow Bend also offers weekly housekeeping and interior and exterior maintenance.

(972) 468-6200

Quality ratings

Measured by Centers for Medicare & Medicaid Services (CMS)

Overall rating Info The Overall CMS Rating combines results from health inspections, staffing levels and quality measures. Health inspections carry the most weight. Staffing and quality scores can increase or decrease the final rating based on performance compared to state and national standards.
▲ 66.1% Above TX avg. ▲ 66.1% Above TX avg.Click the badge to see the full State ranking.Click here to see the full State ranking.
Health Inspection Info Based on the results of the facility's three most recent standard inspections and any complaint investigations. CMS reviews the number, scope, and severity of deficiencies, with more recent findings weighted more heavily.
▲ 38.4% Above TX avg. ▲ 38.4% Above TX avg.Click the badge to see the full State ranking.Click here to see the full State ranking.
Staffing Info Measures average nursing staff hours per resident per day, including Registered Nurses (RNs) and total nursing staff. Ratings are adjusted based on the level of care residents require and are compared to state and national benchmarks.
▲ 108.3% Above TX avg. ▲ 108.3% Above TX avg.Click the badge to see the full State ranking.Click here to see the full State ranking.
Quality Measures Info Based on clinical and physical health indicators reported to CMS, such as hospital readmissions, falls, pressure ulcers, and improvements in mobility. These measures reflect how well residents' health needs are being managed.
▲ 26.6% Above TX avg. ▲ 26.6% Above TX avg.Click the badge to see the full State ranking.Click here to see the full State ranking.

Staffing hours breakdown

Info Daily nursing hours per resident by staff type, reported to CMS. Higher is generally better — compare this facility to state and national averages to see where staffing stands.

Hours per resident per day — compared to Texas state averages

Total nursing care / resident Info This home is ranked 9th out of 289 homes in Texas. Total adjusted nursing hours per resident per day, combining RN, LPN, and aide time. CMS adjusts this for case-mix so facilities can be fairly compared.
5h 44m per day
Rank #9 / 289Nurse hours — State benchmarkedThis home is ranked 9th out of 289 homes in Texas. Shows adjusted nurse hours per resident per day benchmarked to the Texas average, with a ranking across 289 Texas SNFs. More hours mean more direct care. The national average is about 3.5 hrs; below 3.0 is a red flag.Click the rank badge to see the full State ranking.Click here to see the full State ranking.
This facility Texas avg (3h 47m per day)
vs Texas avg
+51%

0 of 6 metrics below state avg

Standout metric Physical Therapist is +275% above state avg
Staff typeHours / Day / Residentvs state avg
Registered Nurse (RN) Info RNs hold the highest nursing license and can assess residents, interpret test results, and direct care plans. More RN hours per day often signals stronger clinical oversight and faster response to health changes. 1h 0m per day ▲ 131% State avg: 26m per day · National avg: 41m per day
LPN / LVN Info Licensed Practical Nurses (LPNs) or Licensed Vocational Nurses (LVNs) deliver routine hands-on care — medication administration, wound dressing, and monitoring vital signs. They work under RN supervision and make up a large share of daily bedside care. 58m per day ■ Avg State avg: 57m per day · National avg: 52m per day
Nurse Aide Info Certified Nurse Aides (CNAs) provide the most direct day-to-day assistance: bathing, dressing, feeding, and mobility. Nurse aide hours are typically the largest staffing category and directly affect residents' quality of life. 3h 26m per day ▲ 70% State avg: 2h 1m per day · National avg: 2h 20m per day
Weekend Total Nursing Info Combined nursing hours (RN + LPN + Nurse Aide) per resident per day on weekends. Staffing often drops on weekends — this figure reveals whether the facility maintains adequate coverage outside of weekday hours. 5h 2m per day ▲ 69% State avg: 2h 59m per day · National avg: 3h 26m per day
Physical Therapist Info Hours per resident per day provided by licensed Physical Therapists (PTs) or PT Assistants. PT services help residents recover mobility after injury or illness and are especially important for post-acute (short-stay) rehabilitation. 15m per day ▲ 275% State avg: 4m per day · National avg: 4m per day
Weekend RN Info Registered nurse hours specifically on weekends. Facilities sometimes reduce RN presence on Saturdays and Sundays — a low weekend RN figure compared to weekday hours can indicate reduced clinical oversight when most administrative staff are absent. 51m per day ▲ 155% State avg: 20m per day · National avg: 28m per day

Types of Care at The Legacy at Willow Bend

Independent Living Assisted Living Memory Care Nursing Home

Capacity and availability

Avg. Length of Stay
41 days
Bed community size
60-bed community Rank #585 / 987Bed count — State benchmarkedThis home is ranked 585th out of 987 homes in Texas. Shows this facility's certified or reported bed count compared to other Texas SNFs. Larger communities may offer more amenities, programs, and on-site services for residents and families.Click the rank badge to see the full State ranking.Click here to see the full State ranking.
A moderately sized community that may balance personal attention with shared amenities and social activities.
Years in operation
18 years in operation Rank #264 / 581Years in operation — State benchmarkedThis home is ranked 264th out of 581 homes in Texas. Shows how long this facility has been in operation compared to other Texas SNFs. Longer operating histories may benefit residents, families, and staff.Click the rank badge to see the full State ranking.Click here to see the full State ranking.
A longer operating history, which may indicate experience navigating regulations and delivering ongoing care.
Walk Score
Walk Score: 45 / 100 Rank #628 / 1392Walk Score — State benchmarkedThis home is ranked 628th out of 1392 homes in Texas. Shows how walkable this facility's neighborhood is compared to the average Walk Score across Texas SNFs. Higher scores benefit residents, families, and staff.Click the rank badge to see the full State ranking.Click here to see the full State ranking.
Somewhat walkable. A few nearby services may be reachable on foot, but most trips require transportation.
BBB Rating
BBB Rating: A+ (Not Accredited)
An independent rating from the Better Business Bureau based on factors such as complaint history, transparency, and business practices.
How BBB ratings work

About this community

Occupancy

Occupancy rate
97%
Rank #6 / 297Occupancy rate — State benchmarkedThis home is ranked 6th out of 297 homes in Texas. Shows this facility's occupancy rate versus the Texas average, with its Statewide rank out of 297. Higher occupancy signals strong local demand and financial stability.Click the rank badge to see the full State ranking.Click here to see the full State ranking.
Higher than the Texas average: 63.5%
Occupied beds
58 / 60
Average occupied beds in Texas homes 75 beds

License Details

Facility TypeType B
StatusLicensed
ExpirationJuly 24, 2027
CountyCollin
License Number147866
Year Opened7/24/2008
QualificationNursing

Ownership & Operating Entity

The Legacy at Willow Bend is legally operated by The Legacy Willow Bend, Inc., and administrated by Deanna Stansbury.

Management CompanyTHE SENIOR LEGACY COMMUNITIES, INC
OwnerLegacy Senior Communities, Inc.
Ownership TypeNonprofit Organization

Type Of Units

Alzheimer's Units
20 units
Total beds
60 units

Staffing

Key information about the people who lead and staff this community.

Leadership

ContactEddie Feldman, Director of Sales and Mar
Administrator Email[email protected]

Memory & Specialized Care

1 service
No Alzheimer's certification

Contact The Legacy at Willow Bend

Inspection History

In Texas, the Health and Human Services Commission (HHSC) is the primary regulatory body that conducts unannounced inspections and publishes quality reports for all long-term care homes.

Inspection Scorecard Info This scorecard compares key inspection, citation, and complaint metrics at this facility against the Texas state average. Metrics rated ≥15% worse than average are highlighted in red; those ≥15% better are highlighted in green.

Overall vs. TX average 0 Worse No metrics in this bucket. 2 At Avg Metrics at Texas average:
• Health citations (at TX avg)
• Inspections with citations (at TX avg)
2 Better Metrics better than Texas average:
• Total citations (67% below)
• Life safety citations (67% below)

Citations Info Citations are formal regulatory issues recorded during state inspections.

This FacilityTX Averagevs. TX Avg
Total citations Info Formal regulatory issues recorded by inspectors across all inspection types. 26 This facility has 67% fewer total citations than a typical Texas nursing home (2 vs. TX avg 6).↓ 67% better
Health citations Info Violations related to resident care, clinical practices, and day-to-day operations. 22 This facility has health citations in line with the Texas average (2 vs. TX avg 2).— At avg
Life safety citations Info Violations related to building safety — fire prevention, emergency egress, and similar. 26 This facility has 67% fewer life safety citations than a typical Texas nursing home (2 vs. TX avg 6).↓ 67% better

Inspections Info State inspections evaluate whether the facility meets health and safety standards.

This FacilityTX Averagevs. TX Avg
Inspections with citations Info Inspections that resulted in at least one regulatory citation. 11 This facility has inspections with citations in line with the Texas average (1 vs. TX avg 1).— At avg

Inspection Reports Summary Info An editor-reviewed summary of the themes and findings across this facility's recent inspection reports.

THE LEGACY AT WILLOW BEND underwent its most recent comprehensive inspection on July 14, 2022, resulting in a total of two state standard violations. Both deficiencies were classified under the Health Code. The facility was cited for failing to establish and maintain an infection control policy and procedure, which was corrected by August 20, 2022. No Life Safety Code deficiencies were listed during this inspection. The facility had no enforcement actions taken against it as a result of these violations.

Read the full inspection reports for this facility, including detailed findings and corrective actions.

Show Inspection Reports

Health Inspection History

Inspections since 2022
Total health inspections 3

Texas average 7.4


Last Health inspection on Sep 2024

Total health citations
17 Rank #89 / 292Health citations — State benchmarkedThis home is ranked 89th out of 292 homes in Texas. Shows this facility's total health deficiency citations benchmarked to the Texas State average, with a ranking across all 292 TX SNFs. Lower citation counts earn a better rank.Click the rank badge to see the full State ranking.Click here to see the full State ranking.

Texas average 25.9

Citations per inspection
5.67 Rank #277 / 292Citations per inspection — State benchmarkedThis home is ranked 277th out of 292 homes in Texas. Shows average deficiency citations per CMS inspection for this facility versus the Texas mean across 292 SNFs with citation data. Lower is better.Click the rank badge to see the full State ranking.Click here to see the full State ranking.

Texas average 3.67


Health citations are formal notices following inspections when they fail to comply with safety and care standards.

10 of 17 citations resulted from standard inspections; and 7 of 17 came from combined inspections (standard and complaint).

Breakdown of citation severity (last 4 years)
Critical health citations
0
100% better than Texas average

Texas average: 2


Serious health citations
0
100% better than Texas average

Texas average: 0.4

0 critical citations Texas average: 2

0 serious citations Texas average: 0.4

17 moderate citations Texas average: 23

0 minor citations Texas average: 0.4
Citations history (last 4 years)
Infection Control moderate citation Sep 19, 2024
Corrected

Nutrition moderate citation Sep 19, 2024
Corrected

Pharmacy moderate citation Sep 19, 2024
Corrected

Quality of Care moderate citation Sep 19, 2024
Corrected

Staffing Data

Reporting period: October 1 – December 31, 2025 (Q4 2025). Source: CMS Payroll-Based Journal report.

Total staff 119
Employees 105
Contractors 14
Staff to resident ratio 2.05:1
39% better than Texas average
Texas average ratio: 1.48:1 Texas average ratio: 1.48:1See full Texas ranking
Avg staff/day 47
Average shift 8.2 hours
0% compared with Texas average
Texas average: 8.1 hours Texas average shift: 8.1 hoursSee full Texas ranking
Total staff hours (quarter) 35,473

Nursing staff breakdown

Q4 2025 · Oct 1 – Dec 31 More info This data comes from the CMS Payroll-Based Journal report covering October 1 – December 31, 2025.
Registered Nurse

Manages medical care and health needs.

RN Staff 14
Average shift length Info Average shift length. Calculated as total hours divided by days worked and average staff per day. 10.1 hours

No contractors work on this role.

Licensed Practical Nurse

Assists with medical care and medications.

LPN Staff 10
Average shift length Info Average shift length. Calculated as total hours divided by days worked and average staff per day. 10.8 hours

No contractors work on this role.

Certified Nursing Assistant

Helps with daily care and mobility.

CNA Staff 50
Average shift length Info Average shift length. Calculated as total hours divided by days worked and average staff per day. 7.7 hours

No contractors work on this role.

Contractor staffing

Q4 2025 · Oct 1 – Dec 31 More info This data comes from the CMS Payroll-Based Journal report covering October 1 – December 31, 2025.

Total hours from contractors

1.5%

531 contractor hours this quarter

Feeding Assistant: 4 Diagnostic X-ray Services Staff: 3 Other Physician: 3 Medical Director: 1 Physician Assistant: 1 Occupational Therapy Aide: 1 Occupational Therapy Assistant: 1

Staff by category

Q4 2025 · Oct 1 – Dec 31 More info This data comes from the CMS Payroll-Based Journal report covering October 1 – December 31, 2025.
Certified Nursing Assistant5005017,11892100%7.7
Registered Nurse140144,65592100%10.1
Licensed Practical Nurse100104,22192100%10.8
Respiratory Therapy Technician3031,2926672%7.2
Medication Aide/Technician4041,2868896%12.8
Physical Therapy Assistant4041,1317177%7.1
RN Director of Nursing2029926975%7.8
Speech Language Pathologist4049077076%7.2
Dietitian2025316571%8.2
Qualified Social Worker2025146975%7.2
Nurse Practitioner1015046368%8
Mental Health Service Worker1014725964%8
Administrator1014565762%8
Physical Therapy Aide2024405762%7.7
Clinical Nurse Specialist3033504347%8.1
Diagnostic X-ray Services Staff0331814043%3.8
Other Physician033992628%3
Feeding Assistant044992932%3
Medical Director011862426%3.6
Other Social Services Staff20274910%6.1
Occupational Therapy Aide011371415%2.7
Physician Assistant0111867%3
Occupational Therapy Assistant0111133%3.6
50 Certified Nursing Assistant
% of Days 100%
14 Registered Nurse
% of Days 100%
10 Licensed Practical Nurse
% of Days 100%
3 Respiratory Therapy Technician
% of Days 72%
4 Medication Aide/Technician
% of Days 96%
4 Physical Therapy Assistant
% of Days 77%
2 RN Director of Nursing
% of Days 75%
4 Speech Language Pathologist
% of Days 76%
2 Dietitian
% of Days 71%
2 Qualified Social Worker
% of Days 75%
1 Nurse Practitioner
% of Days 68%
1 Mental Health Service Worker
% of Days 64%
1 Administrator
% of Days 62%
2 Physical Therapy Aide
% of Days 62%
3 Clinical Nurse Specialist
% of Days 47%
3 Diagnostic X-ray Services Staff
% of Days 43%
3 Other Physician
% of Days 28%
4 Feeding Assistant
% of Days 32%
1 Medical Director
% of Days 26%
2 Other Social Services Staff
% of Days 10%
1 Occupational Therapy Aide
% of Days 15%
1 Physician Assistant
% of Days 7%
1 Occupational Therapy Assistant
% of Days 3%

Penalties and fines

Federal penalties imposed by CMS for regulatory violations, including civil money penalties (fines) and denials of payment for new Medicare/Medicaid admissions.

Source: CMS Penalties Database

No penalties in the past 3 years

No civil money penalties or payment denials were reported in the last 3 years.

Quality of care over time

These measures show how residents usually do over time at this home, based on health outcomes and preventive care.

High-risk clinical events score Info A composite score based on pressure ulcers, falls with injury, weight loss, walking ability decline, and activities of daily living decline. 4.4
49% better than Texas average

Texas average: 8.6

Functional decline score Info A composite score based on activities of daily living decline, walking ability decline, and incontinence. 12.8
20% better than Texas average

Texas average: 16.0

Long-stay resident measures
Significantly above average Texas avg: 4.1 Info CMS star rating based on long-stay quality measure performance. 5 stars = significantly above average, 1 star = significantly below average.
Need for Help with Daily Activities Increased Info Percent of long-stay residents whose need for help with daily activities has increased 11.9%
27% better than Texas average

Texas average: 16.2%

Low Risk Residents with Bowel/Bladder Incontinence Info Percent of low risk long-stay residents who lose control of their bowels or bladder 13.8%
12% better than Texas average

Texas average: 15.7%

Falls with Major Injury Info Percent of long-stay residents experiencing one or more falls with major injury 0.0%
100% better than Texas average

Texas average: 3.2%

High Risk Residents with Pressure Ulcers Info Percent of long-stay high risk residents with pressure ulcers 5.7%
28% worse than Texas average

Texas average: 4.4%

Urinary Tract Infection Info Percent of long-stay residents with a urinary tract infection 0.0%
100% better than Texas average

Texas average: 0.8%

Lost Too Much Weight Info Percent of long-stay residents who lose too much weight 0.0%
100% better than Texas average

Texas average: 3.5%

Depressive Symptoms Info Percent of long-stay residents who have depressive symptoms 10.3%
260% worse than Texas average

Texas average: 2.9%

Antipsychotic Use Info Percent of long-stay residents who received an antipsychotic medication 4.5%
43% better than Texas average

Texas average: 7.9%

Pneumococcal Vaccine Info Percent of long-stay residents assessed and appropriately given the pneumococcal vaccine 100.0%
In line with Texas average

Texas average: 97.3%

Influenza Vaccine Info Percent of long-stay residents assessed and appropriately given the seasonal influenza vaccine 92.6%
5% worse than Texas average

Texas average: 97.9%

Hospitalizations per 1,000 days Info Number of hospitalizations per 1,000 long-stay resident days. 1.86
13% better than Texas average

Texas average: 2.13

ED visits per 1,000 days Info Number of outpatient emergency department visits per 1,000 long-stay resident days. 0.99
52% better than Texas average

Texas average: 2.07

Short-stay resident measures
Significantly above average Texas avg: 3.1 Info CMS star rating based on short-stay quality measure performance. 5 stars = much above average, 1 star = much below average.
Pneumococcal Vaccine Info Percent of short-stay residents assessed and appropriately given the pneumococcal vaccine 100.0%
11% better than Texas average

Texas average: 90.4%

Antipsychotic medication increase Info Percent of short-stay residents who newly received an antipsychotic medication 0.4%
74% better than Texas average

Texas average: 1.4%

Influenza Vaccine Info Percent of short-stay residents assessed and appropriately given the seasonal influenza vaccine 98.4%
12% better than Texas average

Texas average: 88.0%

Re-hospitalized after SNF stay Info Percentage of short-stay residents who were re-hospitalized after their nursing home admission. 27.4%
6% worse than Texas average

Texas average: 25.9%

Emergency department visits Info Percentage of short-stay residents who had an outpatient emergency department visit. 9.1%
24% better than Texas average

Texas average: 12.0%

Falls with major injury Info Percentage of SNF residents who experience falls with major injury during their stay. 0.0%
100% better than Texas average

Texas average: 0.8%

Ability to care for self at discharge Info Percentage of residents at or above expected ability to care for themselves at discharge. 57.8%
8% better than Texas average

Texas average: 53.7%

Successful return to home or community Info Rate of successful return to home or community from a skilled nursing facility. 67.6%
34% better than Texas average

Texas average: 50.6%

Breakdown by payment type

Medicare

57% of new residents, usually for short-term rehab.

Typical stay 24 days

Private pay

42% of new residents, often for short stays.

Typical stay 11 - 12 months

Medicaid

1% of new residents, often for long-term daily care.

Typical stay 10 - 11 months

Facility Characteristics

Source: CMS Long-Term Care Facility Characteristics (Data as of Jan 2026)

Total residents 58
Medicare
24
41.4% of residents
Medicaid
2
3.4% of residents
Private pay or other
32
55.2% of residents
Programs & Services
Residents Group

Residents meet regularly to discuss policies, care quality, and activities

CCRC

Part of a Continuing Care Retirement Community offering multiple care levels

Active Resident Council

Organized group of residents that meets regularly to discuss facility policies, quality of life, and activities.

Finances and operations

Voluntary non-profit community
Home revenue
$29.7M
Surplus of revenue
$696.8K
Voluntary non-profit community
Home revenue
$29.7M Rank #15 / 297Revenue — State benchmarkedThis home is ranked 15th out of 297 homes in Texas. Shows this facility's annual revenue compared to the Texas SNF average. Higher revenue generally means more resources for staffing and capital — read alongside Payroll %.Click the rank badge to see the full State ranking.Click here to see the full State ranking.
Surplus of revenue
$696.8K
Payroll costs Info The portion of the home's budget spent on staff, including nurses, caregivers, and other employees who support care and operations. Rank #12 / 297Payroll — State benchmarkedThis home is ranked 12th out of 297 homes in Texas. Shows total annual staff payroll benchmarked to the Texas average. Higher payroll investment relative to peers often signals better staffing and less reliance on cheaper contract labor.Click the rank badge to see the full State ranking.Click here to see the full State ranking.
$13.7M
46% of revenue Rank #155 / 297Payroll % — State benchmarkedThis home is ranked 155th out of 297 homes in Texas. Shows payroll as a percentage of revenue versus the Texas average. Well-run Texas SNFs typically land around 51–63% — the top third Statewide. Below 25% may signal understaffing or heavy agency use — read with Staffing ratings.Click the rank badge to see the full State ranking.Click here to see the full State ranking.
Other operating costs Info All remaining costs needed to run the home, such as food, utilities, building maintenance, supplies and administrative expenses.
$15.4M
Total costs $29.0M

What does this home offer?

Pets allowed icon
Pets allowed icon

Pets Allowed

Housing options icon

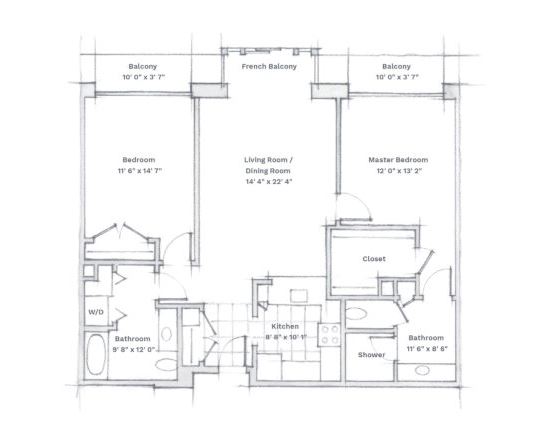
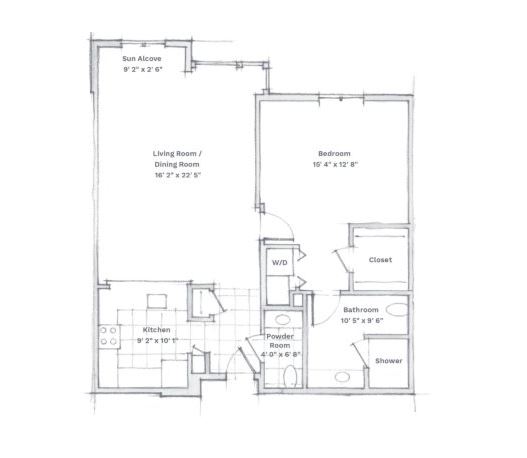
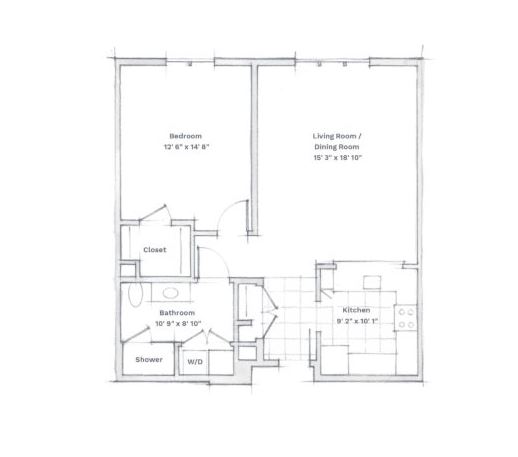
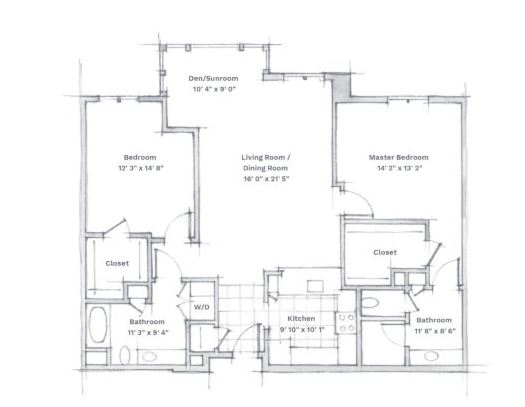
Housing Options: Private Rooms

Building type icon
Building type icon

Building Type: Mid-rise

Transportation services icon

Transportation Services

Fitness and recreation icon

Fitness and Recreation

Who this home usually serves

TYPE OF STAY

Mostly short-term rehab stays

Most residents typically stay for a few weeks or months before returning home or moving on.

Living Spaces & Floor Plans for The Legacy at Willow Bend

The Legacy At Willow Bend P3
The Legacy At Willow Bend P2
The Legacy At Willow Bend P1
The Legacy At Willow Bend P4

Places of interest near The Legacy at Willow Bend

Address 8.1 miles from city center Info Estimated distance in miles from Plano's city center to The Legacy at Willow Bend's address, calculated via Google Maps. — 2.58 miles to nearest hospital (Texas Back Institute - Plano)

Calculate Travel Distance to The Legacy at Willow Bend

Add your location

Address

Financial Assistance for
Nursing Home in Texas

The Legacy at Willow Bend is located in Plano, Texas.
Here are the financial assistance programs available to residents in Texas.

Get Financial aid guidance

Community Care for the Aged and Disabled (CCAD)

TX Medicaid CCAD

Age 65+ or disabled
General Texas resident, Medicaid-eligible, care need (not always nursing home level).
Income Limits (2025) ~$2,829/month 300% FBR, individual
Asset Limits $2,000 (individual), $3,000 (couple).
TX

Large state; rural access challenges.

Benefits
Personal care (5-7 hours/day) Respite (240 hours/year) Adult day care (~$60/day) Home aides

Texas Community Care Services

TX CCS

Age 60+
General Texas resident, at risk of decline.
Income Limits ~$2,000/month individual, varies
Asset Limits $5,000 individual
TX

Limited funding; high demand in urban areas.

Benefits
In-home care (3-5 hours/week) Respite (up to 10 days/year) Transportation (~5 trips/month)

Area Agency on Aging (AAA) Services

Texas AAA Services

Age 60+
General TX resident; no income/asset limits.
Income Limits (2025) None; donations encouraged.
Asset Limits Not assessed.
TX

28 AAAs; includes Meals on Wheels in some areas.

Benefits
Meals (~$5-$7/meal) Transportation Homemaker services (~4 hours/week) Respite (~5 days/year) Legal aid

Medicare Savings Program (MSP)

Texas Medicare Savings Program

Age 65+ or disabled
General TX resident, Medicare Part A/B.
Income Limits (2025) ~$2,510/month (QMB), ~$3,380/month (SLMB), ~$3,598/month (QI)—individual.
Asset Limits $9,430 (individual), $14,130 (couple).
TX

Includes Extra Help for Part D; no waitlist.

Benefits
Covers Part B premiums ($174.70/month) Deductibles ($240/year) Copays (~20%)

Family Caregiver Support Program (FCSP)

Texas Family Caregiver Support Program

Age
General Caregivers of 60+ needing care or 55+ caregivers of others; TX resident; 2+ ADLs.
Income Limits (2025) No strict cap; prioritizes low-income ~$24,980/year
Asset Limits Not assessed.
TX

High rural demand; includes grandparent caregivers.

Benefits
Respite (4-6 hours/week or 5 days/year) Adult day care ($60/day) Training Supplies (~$500/year)

VA Aid and Attendance (A&A) and Housebound Benefits

Texas VA Aid and Attendance/Housebound

Age 65+ or disabled veteran/spouse
General TX resident, wartime service, ADL help (A&A) or homebound.
Income Limits (2025) Net income < ~$1,984/month (veteran with dependent, A&A); pension offsets income.
Asset Limits ~$155,356 net worth
TX

High veteran population; supports rural/urban needs.

Benefits
Cash (~$1,433-$2,642/month veteran, ~$951-$1,318 spouse) for care costs

Property Tax Exemption for Seniors

Texas Senior Property Tax Exemption

Age 65+
General TX resident, homeowner (homestead).
Income Limits (2025) None; tax-based eligibility.
Asset Limits Not assessed.
TX

$25,000+ exemption; optional freeze in some counties; saves ~$500-$1,000/year.

Benefits
Tax exemption or freeze (~$500-$1,000/year savings)

Senior Farmers’ Market Nutrition Program (SFMNP)

Texas SFMNP

Age 60+
General TX resident, low-income.
Income Limits (2025) ~$2,322/month 185% FPL
Asset Limits Not assessed.
TX

Vouchers (~$50/season); serves ~20,000 via 28 AAAs.

Benefits
Vouchers (~$50/season) for produce at farmers’ markets

Frequently Asked Questions about The Legacy at Willow Bend

Who is the owner of The Legacy at Willow Bend?

The legal owner and operator of The Legacy at Willow Bend is The Legacy Willow Bend, Inc..

Is The Legacy at Willow Bend in a walkable area?

The Legacy at Willow Bend has a walk score of 45. Somewhat walkable. A few nearby services may be reachable on foot, but most trips require transportation.

What is the license number of The Legacy at Willow Bend?

According to TX state health department records, The Legacy at Willow Bend's license number is 147866.

When does The Legacy at Willow Bend's license expire?

According to TX state health department records, The Legacy at Willow Bend's license expires on July 24, 2027.

What is the occupancy rate at The Legacy at Willow Bend?

The Legacy at Willow Bend's occupancy is 97%.

Who is the administrator of The Legacy at Willow Bend?

Deanna Stansbury is the administrator of The Legacy at Willow Bend.

How many beds does The Legacy at Willow Bend have?

The Legacy at Willow Bend has 60 beds.

Guides for Better Senior Living

Care Cost Calculator: See Prices in Your Area

Nursing Home Data Explorer

Don’t Wait Too Long: 7 Red Flag Signs Your Parent Needs Assisted Living Now

The True Cost of Assisted Living in 2025 – And How Families Are Paying For It

Understanding Senior Living Costs: Pricing Models, Discounts & Financial Assistance

Explore Open Rooms
1 Contact details
2 What type of senior care service are you looking for?
3 What budget do you have in mind for senior care?
4 How soon do you need to find care?
5 Additional details

Thank you for your interest!

Our team will be in touch shortly to help with next steps.