Las Cruces Post Acute Care & Rehabilitation of Cascadia
Nursing Home & Assisted Living · Las Cruces, NM
CMS overall rating Info CMS (the Centers for Medicare & Medicaid Services) is the federal agency that rates nursing home quality. Its Overall Rating runs from 1 to 5 stars, combining health inspections, staffing, and quality measures, with inspections weighted most heavily.

Las Cruces Post Acute Care & Rehabilitation of Cascadia

Nursing Home & Assisted Living · Las Cruces, NM
CMS overall rating Info CMS (the Centers for Medicare & Medicaid Services) is the federal agency that rates nursing home quality. Its Overall Rating runs from 1 to 5 stars, combining health inspections, staffing, and quality measures, with inspections weighted most heavily.
Calculator: See prices in your area
Las Cruces Post Acute Care & Rehabilitation of Cascadia accepts Medicare, Medicaid, and private pay.

Overview of Las Cruces Post Acute Care & Rehabilitation of Cascadia

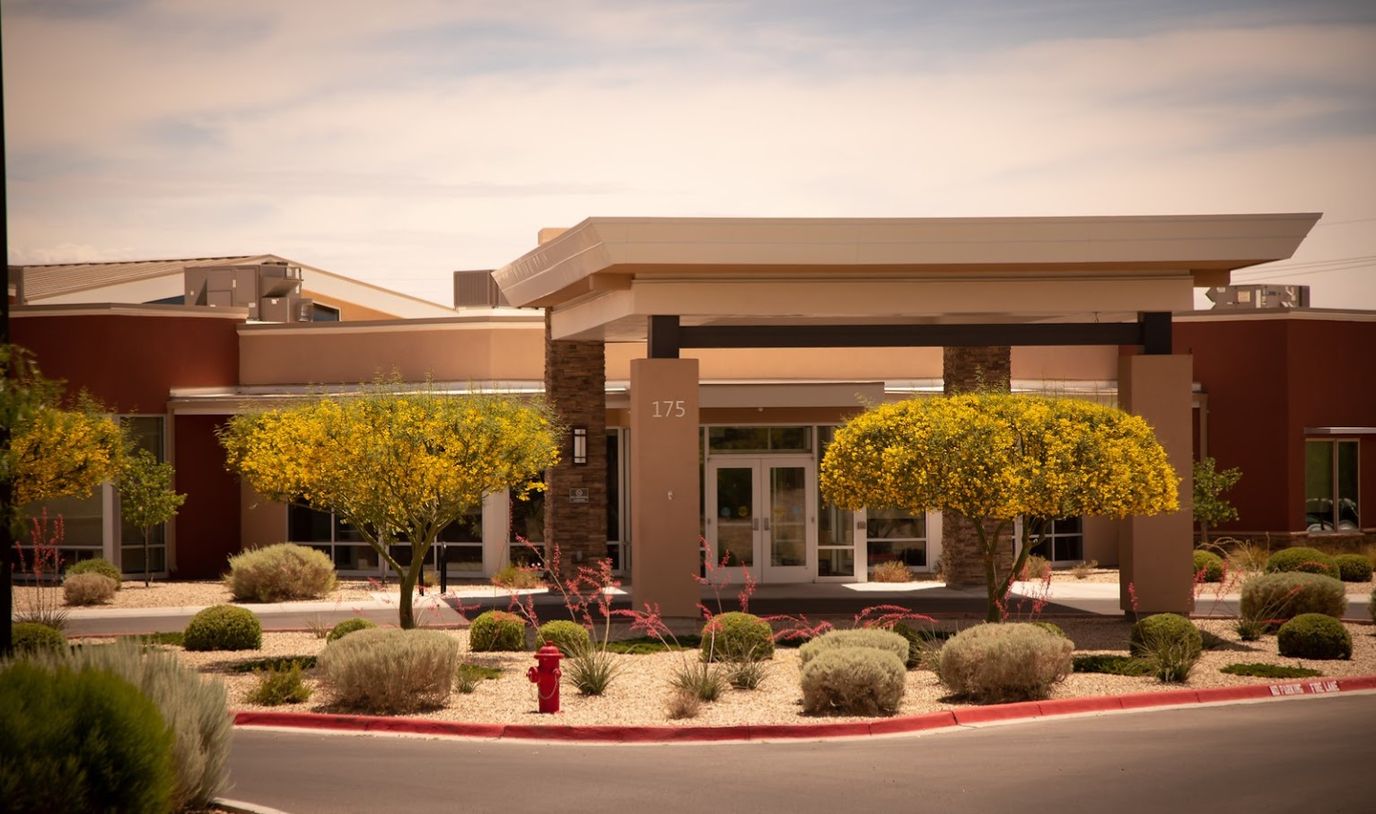
Las Cruces Post Acute Care & Rehabilitation of Cascadia upholds the highest standards in meeting nursing home requirements. With a strong commitment to compliance and quality, they ensure that all necessary regulations and guidelines are followed to create a safe and nurturing environment for residents. Their dedicated team of healthcare professionals delivers compassionate nursing home care, attending to the physical, emotional, and social needs of each resident. From skilled nursing services to specialized care programs, Las Cruces Post Acute Care & Rehabilitation of Cascadia strives to enhance the overall well-being and quality of life for every individual under their care.

Quality ratings

Measured by Centers for Medicare & Medicaid Services (CMS)

Overall rating Info The Overall CMS Rating combines results from health inspections, staffing levels and quality measures. Health inspections carry the most weight. Staffing and quality scores can increase or decrease the final rating based on performance compared to state and national standards.
▲ 3.1% Above NM avg. ▲ 3.1% Above NM avg.NM average: 2.9Click the badge to see the full State ranking.Click here to see the full State ranking.
Health Inspection Info Based on the results of the facility's three most recent standard inspections and any complaint investigations. CMS reviews the number, scope, and severity of deficiencies, with more recent findings weighted more heavily.
▲ 6.9% Above NM avg. ▲ 6.9% Above NM avg.NM average: 2.8Click the badge to see the full State ranking.Click here to see the full State ranking.
Staffing Info Measures average nursing staff hours per resident per day, including Registered Nurses (RNs) and total nursing staff. Ratings are adjusted based on the level of care residents require and are compared to state and national benchmarks.
▲ 8.8% Above NM avg. ▲ 8.8% Above NM avg.NM average: 2.8Click the badge to see the full State ranking.Click here to see the full State ranking.
Quality Measures Info Based on clinical and physical health indicators reported to CMS, such as hospital readmissions, falls, pressure ulcers, and improvements in mobility. These measures reflect how well residents' health needs are being managed.
▲ 10.0% Above NM avg. ▲ 10.0% Above NM avg.NM average: 3.6Click the badge to see the full State ranking.Click here to see the full State ranking.

Staffing hours breakdown

Info Daily nursing hours per resident by staff type, reported to CMS. Higher is generally better — compare this facility to state and national averages to see where staffing stands.

Hours per resident per day — compared to New Mexico state averages

Total nursing care / resident Info This home is ranked 17th out of 55 homes in New Mexico for nurse hours. Total adjusted nursing hours per resident per day, combining RN, LPN, and aide time. CMS adjusts this for case-mix so facilities can be fairly compared.
3h 46m per day
Rank #17 / 55Nurse hours — State benchmarkedThis home is ranked 17th out of 55 homes in New Mexico. Shows adjusted nurse hours per resident per day benchmarked to the New Mexico average, with a ranking across 55 New Mexico facilities. More hours mean more direct care. The national average is about 3.5 hrs; below 3.0 is a red flag.Rankings are based only on facilities in New Mexico that report data for that category. Facilities without available data are excluded from the ranking.Click the rank badge to see the full State ranking.Click here to see the full State ranking.
This facility New Mexico avg (4h 1m per day)
vs New Mexico avg
-6%

3 of 6 metrics below state avg

Standout metric LPN / LVN is +217% above state avg
Staff typeHours / Day / Residentvs state avg
Registered Nurse (RN) Info RNs hold the highest nursing license and can assess residents, interpret test results, and direct care plans. More RN hours per day often signals stronger clinical oversight and faster response to health changes. 35m per day ▼ 7% State avg: 37m per day · National avg: 41m per day
LPN / LVN Info Licensed Practical Nurses (LPNs) or Licensed Vocational Nurses (LVNs) deliver routine hands-on care — medication administration, wound dressing, and monitoring vital signs. They work under RN supervision and make up a large share of daily bedside care. 2h 16m per day ▲ 217% State avg: 43m per day · National avg: 52m per day
Nurse Aide Info Certified Nurse Aides (CNAs) provide the most direct day-to-day assistance: bathing, dressing, feeding, and mobility. Nurse aide hours are typically the largest staffing category and directly affect residents' quality of life. 2h 8m per day ▼ 4% State avg: 2h 14m per day · National avg: 2h 21m per day
Weekend Total Nursing Info Combined nursing hours (RN + LPN + Nurse Aide) per resident per day on weekends. Staffing often drops on weekends — this figure reveals whether the facility maintains adequate coverage outside of weekday hours. 4h 16m per day ▲ 37% State avg: 3h 7m per day · National avg: 3h 26m per day
Physical Therapist Info Hours per resident per day provided by licensed Physical Therapists (PTs) or PT Assistants. PT services help residents recover mobility after injury or illness and are especially important for post-acute (short-stay) rehabilitation. 15m per day ▲ 207% State avg: 5m per day · National avg: 4m per day
Weekend RN Info Registered nurse hours specifically on weekends. Facilities sometimes reduce RN presence on Saturdays and Sundays — a low weekend RN figure compared to weekday hours can indicate reduced clinical oversight when most administrative staff are absent. 19m per day ▼ 33% State avg: 28m per day · National avg: 29m per day

Capacity and availability

This home usually has availability

Lower occupancy than the New Mexico average: 78.9%
Occupancy rate
75.7% Rank #80 / 121Occupancy rate — State benchmarkedThis home is ranked 80th out of 121 homes in New Mexico. Shows this facility's occupancy rate versus the New Mexico average, with its Statewide rank out of 121. Higher occupancy signals strong local demand and financial stability.Rankings are based only on facilities in New Mexico that report data for that category. Facilities without available data are excluded from the ranking.Click the rank badge to see the full State ranking.Click here to see the full State ranking.
Avg. Length of Stay
21 days
Bed community size
64-bed community Rank #70 / 148Bed count — State benchmarkedThis home is ranked 70th out of 148 homes in New Mexico. Shows this facility's certified or reported bed count compared to other New Mexico facilities. Larger communities may offer more amenities, programs, and on-site services for residents and families.Rankings are based only on facilities in New Mexico that report data for that category. Facilities without available data are excluded from the ranking.Click the rank badge to see the full State ranking.Click here to see the full State ranking.
A moderately sized community that may balance personal attention with shared amenities and social activities.
Walk Score
Walk Score: 45 / 100 Rank #106 / 208Walk Score — State benchmarkedThis home is ranked 106th out of 208 homes in New Mexico. Shows how walkable this facility's neighborhood is compared to the average Walk Score across New Mexico facilities. Higher scores benefit residents, families, and staff.Rankings are based only on facilities in New Mexico that report data for that category. Facilities without available data are excluded from the ranking.Click the rank badge to see the full State ranking.Click here to see the full State ranking.
Somewhat walkable. A few nearby services may be reachable on foot, but most trips require transportation.

Contact Las Cruces Post Acute Care & Rehabilitation of Cascadia

Staffing Data

Reporting period: October 1 – December 31, 2025 (Q4 2025). Source: CMS Payroll-Based Journal report.

Total staff 88
Employees 86
Contractors 2
Staff to resident ratio 2.38 : 1
53% more staff per resident than New Mexico average
New Mexico average ratio: 1.55 : 1 New Mexico average ratio: 1.55 : 1See full New Mexico ranking
Avg staff/day 36
Average shift 8.2 hours
5% worse than New Mexico average
New Mexico average: 8.6 hours New Mexico average shift: 8.6 hoursSee full New Mexico ranking
Total staff hours (quarter) 27,318

Nursing staff breakdown

Q4 2025 · Oct 1 – Dec 31 More info This data comes from the CMS Payroll-Based Journal report covering October 1 – December 31, 2025.
Registered Nurse

Manages medical care and health needs.

RN Staff Info All 4 RN Staff are full-time employees. No contractors work on this role. 4
Average shift length Info Average shift length. Calculated as total hours divided by days worked and average staff per day. 8.5 hours
Licensed Practical Nurse

Assists with medical care and medications.

LPN Staff Info All 18 LPN Staff are full-time employees. No contractors work on this role. 18
Average shift length Info Average shift length. Calculated as total hours divided by days worked and average staff per day. 9.7 hours
Certified Nursing Assistant

Helps with daily care and mobility.

CNA Staff Info All 28 CNA Staff are full-time employees. No contractors work on this role. 28
Average shift length Info Average shift length. Calculated as total hours divided by days worked and average staff per day. 9.5 hours

Contractor staffing

Q4 2025 · Oct 1 – Dec 31 More info This data comes from the CMS Payroll-Based Journal report covering October 1 – December 31, 2025.

Total hours from contractors

0.1%

22 contractor hours this quarter

Occupational Therapy Assistant: 2

Staff by category

Q4 2025 · Oct 1 – Dec 31 More info This data comes from the CMS Payroll-Based Journal report covering October 1 – December 31, 2025.
Certified Nursing Assistant280288,13892100%9.5
Licensed Practical Nurse180186,98392100%9.7
Physical Therapist6061,99492100%6.7
RN Director of Nursing3031,6649098%8.1
Registered Nurse4041,0757885%8.5
Other Dietary Services Staff3031,0148795%6.8
Respiratory Therapy Technician4049766975%7.1
Physical Therapy Aide5057846874%5.7
Therapeutic Recreation Specialist4046836975%5.8
Nurse Practitioner1015967480%8.1
Administrator1015346267%8.6
Clinical Nurse Specialist1015206470%8.1
Dietitian1014826368%7.6
Physical Therapy Assistant3034747480%5.6
Dental Services Staff1014745863%8.2
Occupational Therapy Aide1014576672%6.9
Qualified Activities Professional1012345964%4
Qualified Social Worker1012144043%5.4
Occupational Therapy Assistant0222255%3.6
28 Certified Nursing Assistant
% of Days 100%
18 Licensed Practical Nurse
% of Days 100%
6 Physical Therapist
% of Days 100%
3 RN Director of Nursing
% of Days 98%
4 Registered Nurse
% of Days 85%
3 Other Dietary Services Staff
% of Days 95%
4 Respiratory Therapy Technician
% of Days 75%
5 Physical Therapy Aide
% of Days 74%
4 Therapeutic Recreation Specialist
% of Days 75%
1 Nurse Practitioner
% of Days 80%
1 Administrator
% of Days 67%
1 Clinical Nurse Specialist
% of Days 70%
1 Dietitian
% of Days 68%
3 Physical Therapy Assistant
% of Days 80%
1 Dental Services Staff
% of Days 63%
1 Occupational Therapy Aide
% of Days 72%
1 Qualified Activities Professional
% of Days 64%
1 Qualified Social Worker
% of Days 43%
2 Occupational Therapy Assistant
% of Days 5%

Penalties and fines

Federal penalties imposed by CMS for regulatory violations, including civil money penalties (fines) and denials of payment for new Medicare/Medicaid admissions.

Source: CMS Penalties Database (Data as of Jan 2026)

Total fines amount $12K Rank #1 / 56Federal fines — State benchmarkedThis home is ranked 1st out of 56 homes in New Mexico. Shows this facility's cumulative CMS federal fine dollars versus the New Mexico average among facilities with fines, and where it ranks among 56 facilities in the pool. Lower total dollars mean a better rank.Rankings are based only on facilities in New Mexico that report data for that category. Facilities without available data are excluded from the ranking.Click the rank badge to see the full State ranking.Click here to see the full State ranking.
86% lower than New Mexico average

New Mexico average: $86K

Number of fines 1
62% fewer fines than New Mexico average

New Mexico average: 2.6

Payment Denials Info Serious action where Medicare and/or Medicaid temporarily stops payments for new residents until issues are fixed. 1
96% more payment denials than New Mexico average

New Mexico average: 0.5

Fines amount comparison
This facility $12K
New Mexico average $86K

No penalties in the past 3 years

No civil money penalties or payment denials were reported in the last 3 years.

Quality of care over time

These measures show how residents usually do over time at this home, based on health outcomes and preventive care.

Short-stay resident measures
Above average New Mexico avg: 3.3 Info CMS star rating based on short-stay quality measure performance. 5 stars = much above average, 1 star = much below average.
Pneumococcal Vaccine Info Percent of short-stay residents assessed and appropriately given the pneumococcal vaccine 96.5%
12% better than New Mexico average

New Mexico average: 86.1%

Antipsychotic medication increase Info Percent of short-stay residents who newly received an antipsychotic medication 0.7%
46% better than New Mexico average

New Mexico average: 1.3%

Influenza Vaccine Info Percent of short-stay residents assessed and appropriately given the seasonal influenza vaccine 92.8%
7% better than New Mexico average

New Mexico average: 86.4%

Re-hospitalized after SNF stay Info Percentage of short-stay residents who were re-hospitalized after their nursing home admission. 31.3%
47% worse than New Mexico average

New Mexico average: 21.3%

Emergency department visits Info Percentage of short-stay residents who had an outpatient emergency department visit. 14.1%
11% better than New Mexico average

New Mexico average: 15.9%

Falls with major injury Info Percentage of SNF residents who experience falls with major injury during their stay. 0.9%
22% worse than New Mexico average

New Mexico average: 0.8%

Ability to care for self at discharge Info Percentage of residents at or above expected ability to care for themselves at discharge. 73.0%
36% better than New Mexico average

New Mexico average: 53.7%

Successful return to home or community Info Rate of successful return to home or community from a skilled nursing facility. 60.9%
21% better than New Mexico average

New Mexico average: 50.6%

Breakdown by payment type

Medicare

47% of new residents, usually for short-term rehab.

Typical stay 22 days

Private pay

50% of new residents, often for short stays.

Typical stay 19 days

Medicaid

3% of new residents, often for long-term daily care.

Typical stay 25 days

Facility Characteristics

Source: CMS Long-Term Care Facility Characteristics (Data as of Jan 2026)

Total residents 37
Medicare
18
48.6% of residents
Medicaid
2
5.4% of residents
Private pay or other
17
45.9% of residents
Programs & Services
Residents Group

Residents meet regularly to discuss policies, care quality, and activities

Active Resident Council

Organized group of residents that meets regularly to discuss facility policies, quality of life, and activities.

Finances and operations

Based on CMS SNF Cost Report for fiscal year ending in 12/2023.

For-profit
Operated by a single business entity.
Net patient revenue Info Net patient revenue — what the home actually collects for resident care, after contractual allowances, bad debt and discounts are subtracted from its gross charges (CMS cost report, Worksheet G-3). It covers resident care only; money the home earns from other sources is shown separately as "Other income."
$7.5M
Net patient income Info Net patient income: net patient revenue minus the home's total operating expenses. A positive figure means it earns more from resident care than it spends to deliver it; a negative figure means the opposite. It excludes non-operating "other income."
-$199.6K
For-profit Operated by a single business entity.
Net patient revenue Info Net patient revenue — what the home actually collects for resident care, after contractual allowances, bad debt and discounts are subtracted from its gross charges (CMS cost report, Worksheet G-3). It covers resident care only; money the home earns from other sources is shown separately as "Other income."
$7.5M Rank #31 / 56Revenue — State benchmarkedThis home is ranked 31st out of 56 homes in New Mexico. Shows this facility's annual revenue compared to the New Mexico average. Higher revenue generally means more resources for staffing and capital — read alongside Payroll %.Rankings are based only on facilities in New Mexico that report data for that category. Facilities without available data are excluded from the ranking.Click the rank badge to see the full State ranking.Click here to see the full State ranking.
Net patient income Info Net patient income: net patient revenue minus the home's total operating expenses. A positive figure means it earns more from resident care than it spends to deliver it; a negative figure means the opposite. It excludes non-operating "other income."
-$199.6K
Other income Info Money the home earns outside of resident care — such as investments, grants, rentals and other non-operating sources (CMS cost report, Worksheet G-3). It is tracked separately from net patient revenue: it is not part of that figure, and it is not included in net patient income.
$4.3K
Payroll costs Info Staff salaries plus wage-related costs — benefits such as payroll taxes, health insurance and retirement — from the home's own accounting records (CMS cost report, Worksheet A). Contract or agency labor is counted separately, under other operating costs. Rank #42 / 56Payroll — State benchmarkedThis home is ranked 42nd out of 56 homes in New Mexico. Shows total annual staff payroll benchmarked to the New Mexico average. Higher payroll investment relative to peers often signals better staffing and less reliance on cheaper contract labor.Rankings are based only on facilities in New Mexico that report data for that category. Facilities without available data are excluded from the ranking.Click the rank badge to see the full State ranking.Click here to see the full State ranking.
$4.4M 58.4% of net patient revenue Info Payroll as a share of revenue: staff salaries and wage-related benefits divided by net patient revenue. A higher figure means more of each revenue dollar goes to staff pay. Rank #50 / 56Payroll % — State benchmarkedThis home is ranked 50th out of 56 homes in New Mexico. Shows payroll as a percentage of revenue versus the New Mexico average. Well-run New Mexico facilities typically land around 53–59% — the top third Statewide. Below 25% may signal understaffing or heavy agency use — read with Staffing ratings.Rankings are based only on facilities in New Mexico that report data for that category. Facilities without available data are excluded from the ranking.Click the rank badge to see the full State ranking.Click here to see the full State ranking.
Other operating costs Info Everything it costs to run the home apart from payroll — food, utilities, supplies, maintenance, contract labor and administration. Calculated as total operating expense minus payroll (staff salaries and wage-related benefits).
$3.3M
Total costs Info The home's total operating expense for the year — all the costs of running it, salaries included (CMS cost report, Worksheet G-3).
$7.7M

Who this home usually serves

TYPE OF STAY

Mix of rehab and long-term care

This home supports both short-term rehab and long-term care, with residents staying for a wide range of durations.

Most new residents arrive under private pay (50% of admissions), and a typical private pay stay runs around 19 days.

Admissions
666 total

Coverage residents most often arrive under.

Medicare 47%
Private pay 50%
Medicaid 3%
Discharges
662 total

Coverage residents most often leave under.

Medicare 47%
Private pay 50%
Medicaid 3%

Places of interest near Las Cruces Post Acute Care & Rehabilitation of Cascadia

Address 4.0 miles from city center Info Estimated distance in miles from Las Cruces's city center to Las Cruces Post Acute Care & Rehabilitation of Cascadia's address, calculated via Google Maps.

Calculate Travel Distance to Las Cruces Post Acute Care & Rehabilitation of Cascadia

Add your location

Address

Compare Nursing Homes around Las Cruces

The information below is reported by the New Mexico Department of Health, Division of Health Improvement.

2 facilities compared · CMS & NM Dept. of Health data

The Village at Northrise – Hallmark
NH
AL
IL
MC
Las Cruces (Northrise Estates)
24
Facility 24
NM AVG 69
Rank #104 / 148
100.0%
Facility 100.0%
NM AVG 78.9%
Rank #1 / 121
+27%
4.76
Facility 4.76
NM AVG 4.01
Rank #6 / 55
+8%+19%
$0
Facility $0
NM AVG $83.5k
Rank #1 / 56
51
Facility 51
NM AVG 48.6
Rank #32 / 56
12.8
Facility 12.8
NM AVG 7.3
Rank #55 / 56
-121-
25
Facility 25
NM AVG 43
Rank #143 / 208
-
$10.6M
Facility $10.6M
NM AVG $11.4M
Rank #35 / 56
$4.7M
Facility $4.7M
NM AVG $5.0M
Rank #39 / 56
44.8%
Facility 44.8%
NM AVG 46.6%
Rank #42 / 56
325111
Las Cruces Post Acute Care & Rehabilitation of Cascadia
NH
AL
Las Cruces
64
Facility 64
NM AVG 69
Rank #70 / 148
75.7%
Facility 75.7%
NM AVG 78.9%
Rank #80 / 121
-4%
3.76
Facility 3.76
NM AVG 4.01
Rank #17 / 55
-62%-6%
$0
Facility $0
NM AVG $83.5k
Rank #1 / 56
56
Facility 56
NM AVG 48.6
Rank #36 / 56
8.0
Facility 8.0
NM AVG 7.3
Rank #40 / 56
141-
45
Facility 45
NM AVG 43
Rank #106 / 208
-
$7.5M
Facility $7.5M
NM AVG $11.4M
Rank #31 / 56
$4.4M
Facility $4.4M
NM AVG $5.0M
Rank #42 / 56
58.4%
Facility 58.4%
NM AVG 46.6%
Rank #50 / 56
325132

Financial Assistance for
Nursing Home in New Mexico

Las Cruces Post Acute Care & Rehabilitation of Cascadia is located in Las Cruces, New Mexico.
Here are the financial assistance programs available to residents in New Mexico.

Get Financial aid guidance

Centennial Care Community Benefit

NM Medicaid Centennial Care

Age 65+ or disabled
General New Mexico resident, Medicaid- eligible, long-term care need.
Income Limits (2025) ~$2,829/month 300% FBR, individual
Asset Limits $2,000 (individual), $3,000 (couple) (excludes home, car).
NM

Managed care model; rural outreach efforts.

Benefits
In-home care (5-7 hours/day, e.g., bathing, dressing) Respite care (up to 240 hours/year) Adult day care (~$65/day) Medical services

New Mexico Caregiver Support Program

NM NFCSP Respite

Age Caregiver of someone 60+ (or with dementia)
General New Mexico resident.
Income Limits No strict limit; prioritizes low-income.
Asset Limits Not applicable.
NM

Limited slots; rural focus due to sparse population.

Benefits
In-home respite (4-6 hours/day) Adult day care (~$65/day) Short-term facility care (up to 5 days)

Program of All-Inclusive Care for the Elderly (PACE)

New Mexico PACE (e.g., InnovAge New Mexico PACE)

Age 55+
General NM resident (specific counties), NFLOC, safe with PACE support.
Income Limits (2025) ~$2,829/month (Medicaid-eligible); private pay option available.
Asset Limits $2,000 (individual), $3,000 (couple) for Medicaid enrollees.
NM

Available in Bernalillo, Sandoval, Valencia Counties via InnovAge.

Benefits
Personal care (5-7 hours/day) Medical care Meals Transportation Respite Therapies

Older Americans Act (OAA) Services

New Mexico Older Americans Act Services

Age 60+
General NM resident (or spouse of any age); no income/asset limits.
Income Limits (2025) None; sliding scale fees may apply for some services.
Asset Limits Not assessed.
NM

Two AAAs (Albuquerque vs. Non-Metro); services vary by region.

Benefits
Meals (home-delivered or group, ~$5-$7/meal value) Transportation Homemaker services (~4 hours/week) Respite (5 days/year) Adult day care ($50/day)

Medicare Savings Program (MSP)

New Mexico Medicare Savings Program

Age 65+ or disabled
General NM resident, Medicare Part A/B.
Income Limits (2025) ~$2,510/month (QMB), ~$3,380/month (SLMB), ~$3,598/month (QI)—individual.
Asset Limits None in NM unique among states
NM

No asset test; includes Extra Help for Part D.

Benefits
Covers Part B premiums ($174.70/month) Deductibles ($240/year) Copays (~20%)

VA Aid and Attendance (A&A) and Housebound Benefits

New Mexico VA Aid and Attendance/Housebound

Age 65+ or disabled veteran/spouse
General NM resident, wartime service, need for ADL help (A&A) or homebound.
Income Limits (2025) Net income < ~$1,984/month (veteran with dependent, A&A); pension offsets income.
Asset Limits ~$155,356 net worth limit
NM

High veteran demand in rural/urban areas.

Benefits
Cash (~$1,433-$2,642/month veteran, ~$951-$1,318 spouse) for care costs (e.g., in-home, assisted living)

Property Tax Rebate for Seniors

New Mexico Property Tax Rebate

Age 65+
General NM resident, homeowner or renter, paid property taxes.
Income Limits (2025) ~$36,000/year individual, projected
Asset Limits Not assessed.
NM

Rebate up to $250-$500; annual application required.

Benefits
Tax rebate (~$250-$500/year) to offset housing costs

Frequently Asked Questions about Las Cruces Post Acute Care & Rehabilitation of Cascadia

Is Las Cruces Post Acute Care & Rehabilitation of Cascadia in a walkable area?

Las Cruces Post Acute Care & Rehabilitation of Cascadia has a walk score of 45. Somewhat walkable. A few nearby services may be reachable on foot, but most trips require transportation.

What is the occupancy rate at Las Cruces Post Acute Care & Rehabilitation of Cascadia?

Las Cruces Post Acute Care & Rehabilitation of Cascadia's occupancy is 75.7%.

Does Las Cruces Post Acute Care & Rehabilitation of Cascadia operate as a for-profit or non-profit?

Las Cruces Post Acute Care & Rehabilitation of Cascadia is registered as a for-profit.

Are there photos of Las Cruces Post Acute Care & Rehabilitation of Cascadia?

Yes — there are 4 photos of Las Cruces Post Acute Care & Rehabilitation of Cascadia in the photo gallery on this page.

What is the address of Las Cruces Post Acute Care & Rehabilitation of Cascadia?

Las Cruces Post Acute Care & Rehabilitation of Cascadia is located at 175 Roadrunner Pkwy, Las Cruces, NM 88011.

What is the phone number of Las Cruces Post Acute Care & Rehabilitation of Cascadia?

(575) 386-5800 will put you in contact with the team at Las Cruces Post Acute Care & Rehabilitation of Cascadia.

Is Las Cruces Post Acute Care & Rehabilitation of Cascadia Medicare or Medicaid certified?

Yes — Las Cruces Post Acute Care & Rehabilitation of Cascadia is a CMS-certified provider of Medicare and Medicaid.

Guides for Better Senior Living

Care Cost Calculator: See Prices in Your Area

Nursing Home Data Explorer

Don’t Wait Too Long: 7 Red Flag Signs Your Parent Needs Assisted Living Now

The True Cost of Assisted Living in 2025 – And How Families Are Paying For It

Understanding Senior Living Costs: Pricing Models, Discounts & Financial Assistance