Viviant Healthcare of Chattanooga

Nursing Home in Chattanooga

CMS overall rating Info The Overall CMS Rating is scored from 1 to 5 stars and combines results from health inspections, staffing levels, and quality measures. Health inspections carry the most weight. Staffing and quality scores can increase or decrease the final rating based on performance compared to state and national standards.
Calculator: See prices in your area
Viviant Healthcare of Chattanooga accepts Medicare, Medicaid, and private pay.

Overview of Viviant Healthcare of Chattanooga

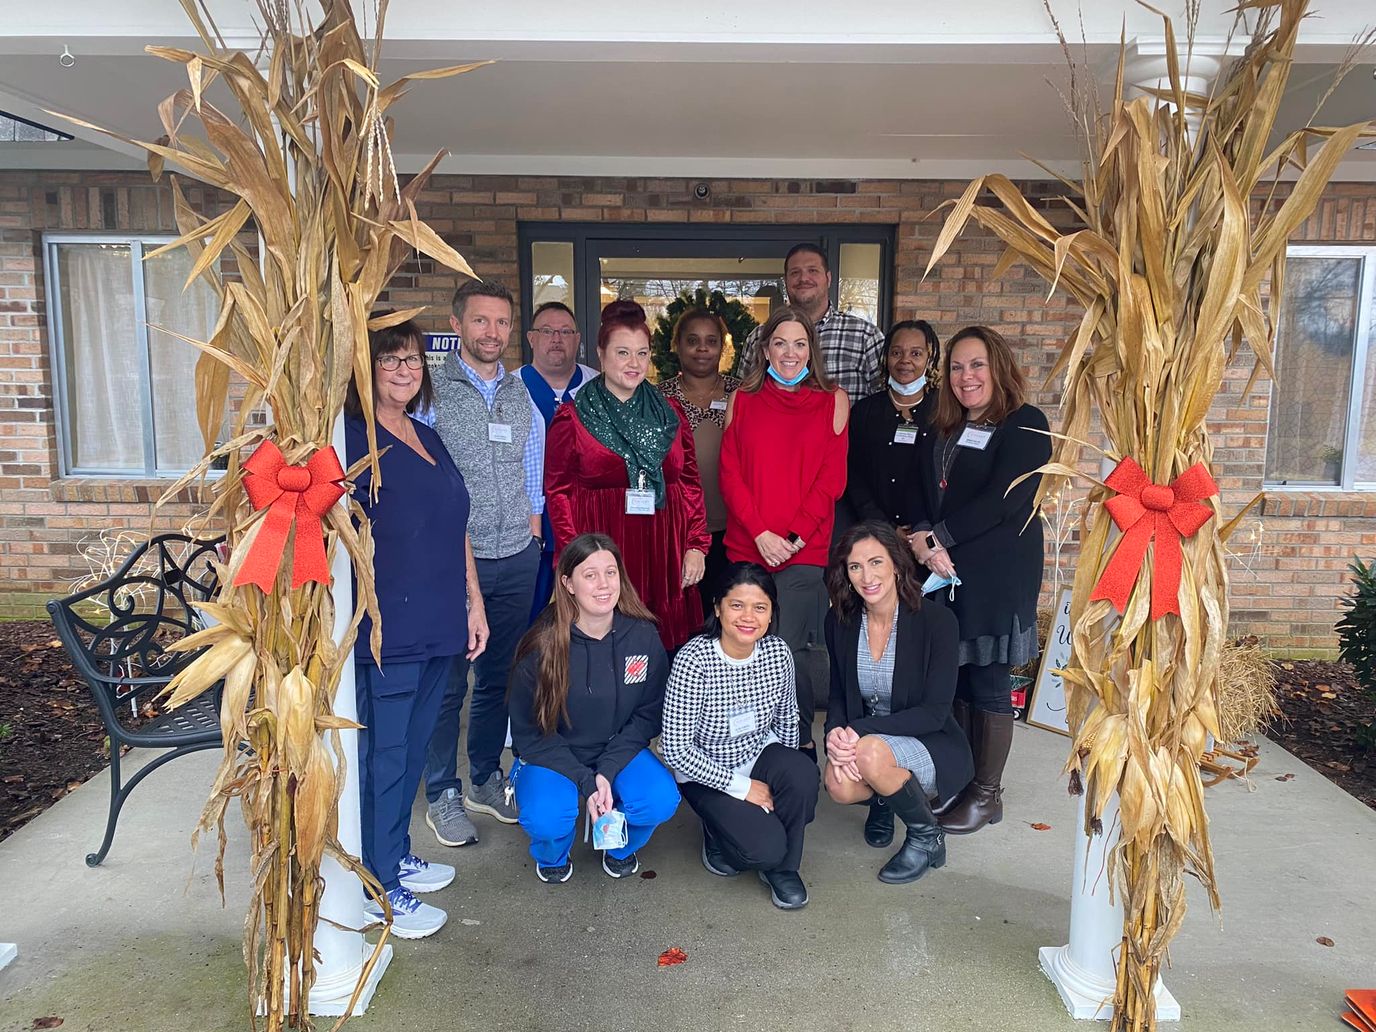
Viviant Healthcare of Chattanooga prides itself on achieving a safe and secure community for residents to experience rejuvenation and recovery in one nurturing home. Residents from different living options offer personalized care that allows them to receive the necessary care while promoting an active lifestyle. The nursing home prides its services on pride, honor, and family– entrusting many families to take care of their loved ones as their own.
Viviant’s centers of excellence are found in long-term care, skilled nursing, and short-term rehabilitation services for their senior residents. Other community features include housekeeping services, laundry services, an enclosed courtyard, pharmaceutical delivery service, and a full-service salon.

(713) 543-8774

Quality ratings

Measured by Centers for Medicare & Medicaid Services (CMS)

Overall rating Info The Overall CMS Rating combines results from health inspections, staffing levels and quality measures. Health inspections carry the most weight. Staffing and quality scores can increase or decrease the final rating based on performance compared to state and national standards.
▼ 29.4% Below TN avg.
Health Inspection Info Based on the results of the facility's three most recent standard inspections and any complaint investigations. CMS reviews the number, scope, and severity of deficiencies, with more recent findings weighted more heavily.
▼ 28.2% Below TN avg.
Staffing Info Measures average nursing staff hours per resident per day, including Registered Nurses (RNs) and total nursing staff. Ratings are adjusted based on the level of care residents require and are compared to state and national benchmarks.
▼ 17.2% Below TN avg.
Quality Measures Info Based on clinical and physical health indicators reported to CMS, such as hospital readmissions, falls, pressure ulcers, and improvements in mobility. These measures reflect how well residents' health needs are being managed.
▲ 16.3% Above TN avg.

Staffing hours breakdown

Info Daily nursing hours per resident by staff type, reported to CMS. Higher is generally better — compare this facility to state and national averages to see where staffing stands.

Hours per resident per day — compared to Tennessee state averages

Total nursing care / resident Info This home is ranked 52nd out of 134 homes in Tennessee.

Total adjusted nursing hours per resident per day, combining RN, LPN, and aide time. CMS adjusts this for case-mix so facilities can be fairly compared.
3h 36m per day
Rank #52 / 134Nurse hours — state benchmarkedThis home is ranked 52nd out of 134 homes in Tennessee.Shows adjusted nurse hours per resident per day benchmarked to the Tennessee average, with a ranking across 134 Tennessee SNFs. More hours mean more direct care. The national average is about 3.5 hrs; below 3.0 is a red flag.
This facility Tennessee avg (3h 38m per day)
vs Tennessee avg
-1%

5 of 6 metrics below state avg

Standout metric Physical Therapist is +60% above state avg
Staff typeHours / dayvs state avg
Registered Nurse (RN) Info RNs hold the highest nursing license and can assess residents, interpret test results, and direct care plans. More RN hours per day often signals stronger clinical oversight and faster response to health changes. 26m per day ▼ 30% State avg: 37m per day · National avg: 41m per day
LPN / LVN Info Licensed Practical Nurses (LPNs) or Licensed Vocational Nurses (LVNs) deliver routine hands-on care — medication administration, wound dressing, and monitoring vital signs. They work under RN supervision and make up a large share of daily bedside care. 54m per day ▼ 18% State avg: 1h 6m per day · National avg: 52m per day
Nurse Aide Info Certified Nurse Aides (CNAs) provide the most direct day-to-day assistance: bathing, dressing, feeding, and mobility. Nurse aide hours are typically the largest staffing category and directly affect residents' quality of life. 1h 47m per day ▼ 17% State avg: 2h 9m per day · National avg: 2h 21m per day
Total Nursing (Weekend) Info Combined nursing hours (RN + LPN + Nurse Aide) per resident per day on weekends. Staffing often drops on weekends — this figure reveals whether the facility maintains adequate coverage outside of weekday hours. 3h 5m per day ▼ 8% State avg: 3h 21m per day · National avg: 3h 26m per day
Physical Therapist Info Hours per resident per day provided by licensed Physical Therapists (PTs) or PT Assistants. PT services help residents recover mobility after injury or illness and are especially important for post-acute (short-stay) rehabilitation. 8m per day ▲ 60% State avg: 5m per day · National avg: 4m per day
RN (Weekend) Info Registered nurse hours specifically on weekends. Facilities sometimes reduce RN presence on Saturdays and Sundays — a low weekend RN figure compared to weekday hours can indicate reduced clinical oversight when most administrative staff are absent. 14m per day ▼ 44% State avg: 25m per day · National avg: 29m per day

Capacity and availability

This home usually has availability

Occupancy lower than 85% suggests more openings may be available.

Lower occupancy than the Tennessee average: 73%
Occupancy rate 35.1% Rank #134 / 139Occupancy rate — state benchmarkedThis home is ranked 134th out of 139 homes in Tennessee.Shows this facility's occupancy rate versus the Tennessee average, with its statewide rank out of 139. Higher occupancy signals strong local demand and financial stability.
Avg. Length of Stay 123 days
Occupancy rate
35.1% Rank #134 / 139Occupancy rate — state benchmarkedThis home is ranked 134th out of 139 homes in Tennessee.Shows this facility's occupancy rate versus the Tennessee average, with its statewide rank out of 139. Higher occupancy signals strong local demand and financial stability.
Avg. Length of Stay
123 days

Who this home usually serves

TYPE OF STAY

Mix of rehab and long-term care

This home supports both short-term rehab and long-term care, with residents staying for a wide range of durations.

Breakdown by payment type

Medicare

22% of new residents, usually for short-term rehab.

Typical stay 29 days

Private pay

40% of new residents, often for short stays.

Typical stay 2 - 3 months

Medicaid

38% of new residents, often for long-term daily care.

Typical stay 7 - 8 months

Finances and operations

Privately-owned community
Operated by a partnership between two or more business owners.
Home revenue
$5.0M
Operating loss
-$2.6M
Privately-owned community Operated by a partnership between two or more business owners.
Home revenue
$5.0M Rank #130 / 139Revenue — state benchmarkedThis home is ranked 130th out of 139 homes in Tennessee.Shows this facility's annual revenue compared to the Tennessee SNF average. Higher revenue generally means more resources for staffing and capital — read alongside Payroll %.
Operating loss
-$2.6M
Payroll costs Info The portion of the home's budget spent on staff, including nurses, caregivers, and other employees who support care and operations. Rank #91 / 139Payroll — state benchmarkedThis home is ranked 91st out of 139 homes in Tennessee.Shows total annual staff payroll benchmarked to the Tennessee average. Higher payroll investment relative to peers often signals better staffing and less reliance on cheaper contract labor.
$3.6M
72.5% of revenue Rank #5 / 139Payroll % — state benchmarkedThis home is ranked 5th out of 139 homes in Tennessee.Shows payroll as a percentage of revenue versus the Tennessee average. Well-run SNFs often land around 55–65%. Below 25% may signal understaffing or heavy agency use — read with Staffing ratings.
Other operating costs Info All remaining costs needed to run the home, such as food, utilities, building maintenance, supplies and administrative expenses.
$4.0M
Total costs $7.6M
Walk Score
Walk Score: 19 / 100 Rank #43 / 56Walk Score — state benchmarkedThis home is ranked 43rd out of 56 homes in Tennessee.Shows how walkable this facility's neighborhood is compared to the average Walk Score across Tennessee SNFs. Higher scores benefit residents, families, and staff.
Car-dependent. Most errands require a car, with limited nearby walkable options.

Contact Viviant Healthcare of Chattanooga

Health Inspection History

Inspections
Total health inspections 5

Tennessee average 3.5


Last Health inspection on Aug 2025

Total health citations
23 Rank #113 / 138Health citations — state benchmarkedThis home is ranked 113th out of 138 homes in Tennessee.Shows this facility's total health deficiency citations benchmarked to the Tennessee state average, with a ranking across all 138 TN SNFs. Lower citation counts earn a better rank.

Tennessee average 15.4

Citations per inspection
4.6 Rank #73 / 138Citations per inspection — state benchmarkedThis home is ranked 73rd out of 138 homes in Tennessee.Shows average deficiency citations per CMS inspection for this facility versus the Tennessee mean across 138 SNFs with citation data. Lower is better.

Tennessee average 4.39


Health citations are formal notices following inspections when they fail to comply with safety and care standards.

18 of 23 citations resulted from standard inspections; and 5 of 23 resulted from complaint investigations.

Breakdown of citation severity (last 3 years)
Critical Health citations More info
0
100% better than Tennessee average

Tennessee average: 1.1


Serious Health citations More info 0
100% better than Tennessee average

Tennessee average: 0.6

0 critical citations More info Tennessee average: 1.1

0 serious citations More info Tennessee average: 0.6

22 moderate citations More info Tennessee average: 13.7

1 minor citation More info Tennessee average: 0.1
Citations history (last 3 years)
Environmental minor citation Info Issues related to building safety, cleanliness, maintenance, and overall living conditions. Aug 06, 2025
Corrected

Nutrition moderate citation Info Issues related to food quality, meal service, and resident's nutritional needs. Aug 06, 2025
Corrected

Nutrition moderate citation Info Issues related to food quality, meal service, and resident's nutritional needs. Aug 06, 2025
Corrected

Pharmacy moderate citation Info Issues related to medication management, including how drugs are stored, administered, and monitored. Aug 06, 2025
Corrected

Financial Assistance for
Nursing Home in Tennessee

Viviant Healthcare of Chattanooga is located in Chattanooga, Tennessee.
Here are the financial assistance programs available to residents in Tennessee.

Get Financial aid guidance

CHOICES Program

TN Medicaid CHOICES

Age 65+ or disabled
General Tennessee resident, Medicaid-eligible, nursing home-level care need.
Income Limits (2025) ~$2,829/month 300% FBR, individual
Asset Limits $2,000 (individual), $3,000 (couple).
TN

Managed care model; high rural demand.

Benefits
Personal care (5-7 hours/day) Respite (240 hours/year) Adult day care ($65/day) Home modifications ($1,500 avg.)

Tennessee Options for Community Living

TN Options

Age 60+
General Tennessee resident, at risk of nursing home.
Income Limits ~$2,000/month individual, varies
Asset Limits $5,000 individual
TN

Limited funding; rural/urban balance.

Benefits
In-home care (3-5 hours/week) Respite (up to 10 days/year) Transportation (~5 trips/month)

Medicare Savings Program (MSP)

Tennessee Medicare Savings Program

Age 65+ or disabled
General TN resident, Medicare Part A/B.
Income Limits (2025) ~$2,510/month (QMB), ~$3,380/month (SLMB), ~$3,598/month (QI)—individual.
Asset Limits $9,430 (individual), $14,130 (couple).
TN

Three tiers; includes Extra Help for Part D; no waitlist.

Benefits
Covers Part B premiums ($174.70/month) Deductibles ($240/year) Copays (~20%)

Low-Income Home Energy Assistance Program (LIHEAP)

Tennessee LIHEAP

Age 60+ prioritized
General TN resident, low-income household.
Income Limits (2025) ~$3,970/month individual, 185% FPL
Asset Limits Not assessed; income-focused.
TN

Covers gas, electric, propane; emergency aid available.

Benefits
Heating/cooling aid ($300-$1,000/season) Emergency aid ($500 max)

Family Caregiver Support Program (FCSP)

Tennessee Family Caregiver Support Program

Age
General Caregivers of 60+ needing care or 55+ caregivers of others; TN resident; functional needs (2+ ADLs).
Income Limits (2025) No strict cap; prioritizes low-income ~$24,980/year
Asset Limits Not assessed; need-based.
TN

Includes grandparent caregivers; high rural demand.

Benefits
Respite (4-6 hours/week or 5 days/year) Adult day care ($60/day) Training Supplies (~$500/year)

Senior Community Service Employment Program (SCSEP)

Tennessee SCSEP

Age 55+
General unemployed, low-income, TN resident.
Income Limits (2025) ~$1,983/month 125% FPL
Asset Limits Not specified; income-focused.
TN

Priority for veterans, rural residents; AARP/Goodwill partnership.

Benefits
Paid training (~20 hours/week at ~$7.25/hour) Job placement

VA Aid and Attendance (A&A) and Housebound Benefits

Tennessee VA Aid and Attendance/Housebound

Age 65+ or disabled veteran/spouse
General TN resident, wartime service, need for ADL help (A&A) or homebound.
Income Limits (2025) Net income < ~$1,984/month (veteran with dependent, A&A); pension offsets income.
Asset Limits ~$155,356 net worth limit
TN

High veteran population; supports rural/urban care needs.

Benefits
Cash (~$1,433-$2,642/month veteran, ~$951-$1,318 spouse) for care costs (e.g., in-home, assisted living)

Elderly Nutrition Program

Tennessee Elderly Nutrition Program

Age 60+
General TN resident; no income limit but prioritizes low-income.
Income Limits (2025) None; donations encouraged.
Asset Limits Not assessed.
TN

Serves ~50,000 annually; 200+ congregate sites plus Meals on Wheels.

Benefits
Congregate meals ($5-$7/meal value) at senior centers Home-delivered meals ($5-$7/meal)

Property Tax Relief Program

Tennessee Property Tax Relief Program

Age 65+
General TN resident, homeowner/renter (or widow/er 50+, disabled 18+).
Income Limits (2025) ~$45,000/year household, excludes half of Social Security
Asset Limits Not assessed; income-focused.
TN

Rebates up to $1,000; serves ~100,000 annually.

Benefits
Tax rebates (~$250-$1,000 based on income; e.g., $1,000 if income < $8,000)

Places of interest near Viviant Healthcare of Chattanooga

Address 16.4 miles from city center Info Estimated distance in miles from Chattanooga's city center to Viviant Healthcare of Chattanooga's address, calculated via Google Maps. — 2.33 miles to nearest hospital (Parkridge Valley Mental Health and Wellness Adult and Adolescent Acute Campus)

Calculate Travel Distance to Viviant Healthcare of Chattanooga

Add your location

Address

Staffing Data (Q2 2025)

This data corresponds to Q2 2025 and is based on CMS Payroll-Based Journal.

Total staff 114
Employees 108
Contractors 6
Staff to resident ratio 1.56:1
13% worse than Tennessee average

Tennessee average ratio: 1.79:1

Avg staff/day 37
Average shift 8.2 hours
0% compared with Tennessee average

Tennessee average: 8.3 hours

Total staff hours (quarter) 27,592
Nursing staff breakdown
Registered Nurse

Manages medical care and health needs.

Total count 12
Average shift length Info Average shift length. Calculated as total hours divided by days worked and average staff per day. 8.6 hours

No contractors work on this role.

Licensed Practical Nurse

Assists with medical care and medications.

Total count 22
Average shift length Info Average shift length. Calculated as total hours divided by days worked and average staff per day. 9.3 hours

No contractors work on this role.

Certified Nursing Assistant

Helps with daily care and mobility.

Total count 50
Average shift length Info Average shift length. Calculated as total hours divided by days worked and average staff per day. 8.4 hours

No contractors work on this role.

Contractor staffing

Total hours from contractors

1.9%

520 contractor hours this quarter

Diagnostic X-ray Services Staff: 2 Feeding Assistant: 2 Occupational Therapy Assistant: 1 Medical Director: 1
Staff by category
Certified Nursing Assistant5005012,39991100%8.4
Licensed Practical Nurse220226,73891100%9.3
Registered Nurse120121,3938998%8.6
Therapeutic Recreation Specialist3031,0918088%6.8
Respiratory Therapy Technician5059017178%6.5
Clinical Nurse Specialist1015566571%8.5
Physical Therapy Aide3035217380%6.2
Qualified Social Worker2025176571%7.9
Administrator1015046369%8
Mental Health Service Worker1015046369%8
Dietitian1014966268%8
Physical Therapy Assistant3034786673%7
RN Director of Nursing1014725965%8
Nurse Practitioner1014285459%7.9
Feeding Assistant0223556167%3.6
Medical Director011962426%4
Occupational Therapy Aide101721415%5.2
Diagnostic X-ray Services Staff022631314%2.5
Occupational Therapy Assistant011633%2
Qualified Activities Professional101111%1
50 Certified Nursing Assistant
% of Days 100%
22 Licensed Practical Nurse
% of Days 100%
12 Registered Nurse
% of Days 98%
3 Therapeutic Recreation Specialist
% of Days 88%
5 Respiratory Therapy Technician
% of Days 78%
1 Clinical Nurse Specialist
% of Days 71%
3 Physical Therapy Aide
% of Days 80%
2 Qualified Social Worker
% of Days 71%
1 Administrator
% of Days 69%
1 Mental Health Service Worker
% of Days 69%
1 Dietitian
% of Days 68%
3 Physical Therapy Assistant
% of Days 73%
1 RN Director of Nursing
% of Days 65%
1 Nurse Practitioner
% of Days 59%
2 Feeding Assistant
% of Days 67%
1 Medical Director
% of Days 26%
1 Occupational Therapy Aide
% of Days 15%
2 Diagnostic X-ray Services Staff
% of Days 14%
1 Occupational Therapy Assistant
% of Days 3%
1 Qualified Activities Professional
% of Days 1%

Facility Characteristics

Source: CMS Long-Term Care Facility Characteristics (Data as of Jan 2026)

Total residents 73
Medicare
7
9.6% of residents
Medicaid
46
63% of residents
Private pay or other
20
27.4% of residents
Programs & Services
Residents Group

Residents meet regularly to discuss policies, care quality, and activities

Family Member Group

Family members meet regularly to discuss policies, care quality, and activities

Active Family Council

Organized group of family members that meets regularly to discuss facility policies, resident care, and activities.

Active Resident Council

Organized group of residents that meets regularly to discuss facility policies, quality of life, and activities.

Quality of care over time

These measures show how residents usually do over time at this home, based on health outcomes and preventive care.

High-risk clinical events score Info A composite score based on pressure ulcers, falls with injury, weight loss, walking ability decline, and activities of daily living decline. 7.4
29% better than Tennessee average

Tennessee average: 10.5

Functional decline score Info A composite score based on activities of daily living decline, walking ability decline, and incontinence. 14.9
24% better than Tennessee average

Tennessee average: 19.5

Long-stay resident measures
Average Tennessee avg: 3.7 Info CMS star rating based on long-stay quality measure performance. 5 stars = significantly above average, 1 star = significantly below average.
Need for Help with Daily Activities Increased Info Percent of long-stay residents whose need for help with daily activities has increased 8.3%
48% better than Tennessee average

Tennessee average: 16.0%

Walking Ability Worsened Info Percent of long-stay residents whose ability to move independently worsened 18.1%
17% better than Tennessee average

Tennessee average: 21.7%

Low Risk Residents with Bowel/Bladder Incontinence Info Percent of low risk long-stay residents who lose control of their bowels or bladder 18.3%
12% better than Tennessee average

Tennessee average: 20.7%

Falls with Major Injury Info Percent of long-stay residents experiencing one or more falls with major injury 4.5%
23% worse than Tennessee average

Tennessee average: 3.7%

High Risk Residents with Pressure Ulcers Info Percent of long-stay high risk residents with pressure ulcers 2.9%
46% better than Tennessee average

Tennessee average: 5.4%

Urinary Tract Infection Info Percent of long-stay residents with a urinary tract infection 3.1%
50% worse than Tennessee average

Tennessee average: 2.1%

Lost Too Much Weight Info Percent of long-stay residents who lose too much weight 3.4%
47% better than Tennessee average

Tennessee average: 6.3%

Depressive Symptoms Info Percent of long-stay residents who have depressive symptoms 7.4%
33% better than Tennessee average

Tennessee average: 11.0%

Antipsychotic Use Info Percent of long-stay residents who received an antipsychotic medication 38.0%
130% worse than Tennessee average

Tennessee average: 16.5%

Pneumococcal Vaccine Info Percent of long-stay residents assessed and appropriately given the pneumococcal vaccine 88.0%
In line with Tennessee average

Tennessee average: 89.9%

Influenza Vaccine Info Percent of long-stay residents assessed and appropriately given the seasonal influenza vaccine 79.3%
16% worse than Tennessee average

Tennessee average: 94.5%

Hospitalizations per 1,000 days Info Number of hospitalizations per 1,000 long-stay resident days. 1.68
6% worse than Tennessee average

Tennessee average: 1.58

ED visits per 1,000 days Info Number of outpatient emergency department visits per 1,000 long-stay resident days. 1.51
In line with Tennessee average

Tennessee average: 1.57

Short-stay resident measures
Average Tennessee avg: 3.4 Info CMS star rating based on short-stay quality measure performance. 5 stars = much above average, 1 star = much below average.
Pneumococcal Vaccine Info Percent of short-stay residents assessed and appropriately given the pneumococcal vaccine 60.9%
24% worse than Tennessee average

Tennessee average: 79.7%

Antipsychotic medication increase Info Percent of short-stay residents who newly received an antipsychotic medication 3.6%
114% worse than Tennessee average

Tennessee average: 1.7%

Influenza Vaccine Info Percent of short-stay residents assessed and appropriately given the seasonal influenza vaccine 58.7%
26% worse than Tennessee average

Tennessee average: 79.8%

Re-hospitalized after SNF stay Info Percentage of short-stay residents who were re-hospitalized after their nursing home admission. 17.3%
22% better than Tennessee average

Tennessee average: 22.2%

Emergency department visits Info Percentage of short-stay residents who had an outpatient emergency department visit. 8.0%
29% better than Tennessee average

Tennessee average: 11.2%

Falls with major injury Info Percentage of SNF residents who experience falls with major injury during their stay. 0.0%
100% better than Tennessee average

Tennessee average: 0.8%

Penalties and fines

Federal penalties imposed by CMS for regulatory violations, including civil money penalties (fines) and denials of payment for new Medicare/Medicaid admissions.

Source: CMS Penalties Database (Data as of Jan 2026)

Total fines amount $7K
92% lower than Tennessee average

Tennessee average: $86K

Number of fines 1
43% fewer fines than Tennessee average

Tennessee average: 1.7

Payment Denials Info Serious action where Medicare and/or Medicaid temporarily stops payments for new residents until issues are fixed. 0
100% fewer payment denials than Tennessee average

Tennessee average: 0.5

Fines amount comparison
This facility $7K
Tennessee average $86K
Penalty History

Penalties are imposed by CMS for violations of federal nursing home regulations.

1 penalty in the past 3 years

Oct 2, 2023 · $7K

Civil Money Penalty Info Fines imposed for noncompliance, which can be assessed per day or per instance of violation. Oct 2, 2023
$7K

Last updated: Jan 2026

Compare Nursing Home around Chattanooga The information below is reported by the Tennessee Department of Health, Division of Health Care Facilities.

5 facilities compared · CMS & TN Dept. of Health data · Updated Apr 2026

Filter by care type
Life Care Center of East Ridge
NH

Nursing Home Licensed facility providing 24/7 skilled nursing care for residents with complex, ongoing medical needs. Staffed by RNs, LPNs, and CNAs. Inspected and star-rated annually by CMS. Accepts Medicare (short-term rehab) and Medicaid (long-term care).

AL

Assisted Living A licensed, long-term care setting for seniors or individuals with disabilities who need help with daily activities — like bathing, dressing, and medication management — but not 24-hour skilled nursing. Offers housing, meals, and around-the-clock support while aiming to maximize resident independence.

East Ridge (Castle Park)108 61.7% -15%3.71 -8%+2%0153.8083- 31 Center, Parker$14.4M$6.2M42.8%445528
Life Care Center of Red Bank
NH

Nursing Home Licensed facility providing 24/7 skilled nursing care for residents with complex, ongoing medical needs. Staffed by RNs, LPNs, and CNAs. Inspected and star-rated annually by CMS. Accepts Medicare (short-term rehab) and Medicaid (long-term care).

AL

Assisted Living A licensed, long-term care setting for seniors or individuals with disabilities who need help with daily activities — like bathing, dressing, and medication management — but not 24-hour skilled nursing. Offers housing, meals, and around-the-clock support while aiming to maximize resident independence.

Chattanooga (Mountain Creek)54 94.4% +29%3.45 +37%-5%1275.4583A+ 9 Broom, Sherry$14.0M$5.7M41%445240
Viviant Healthcare of Chattanooga
NH

Nursing Home Licensed facility providing 24/7 skilled nursing care for residents with complex, ongoing medical needs. Staffed by RNs, LPNs, and CNAs. Inspected and star-rated annually by CMS. Accepts Medicare (short-term rehab) and Medicaid (long-term care).

AL

Assisted Living A licensed, long-term care setting for seniors or individuals with disabilities who need help with daily activities — like bathing, dressing, and medication management — but not 24-hour skilled nursing. Offers housing, meals, and around-the-clock support while aiming to maximize resident independence.

Chattanooga (East Brainerd)127 35.1% -52%3.59 +21%-1%1234.6064- 19 Chattanooga One Op Holdings Llc$5.0M$3.6M72.5%445205
Consulate Health Care of Chattanooga
NH

Nursing Home Licensed facility providing 24/7 skilled nursing care for residents with complex, ongoing medical needs. Staffed by RNs, LPNs, and CNAs. Inspected and star-rated annually by CMS. Accepts Medicare (short-term rehab) and Medicaid (long-term care).

AL

Assisted Living A licensed, long-term care setting for seniors or individuals with disabilities who need help with daily activities — like bathing, dressing, and medication management — but not 24-hour skilled nursing. Offers housing, meals, and around-the-clock support while aiming to maximize resident independence.

IL

Independent Living Lifestyle-focused communities for older adults offering dining, activities, and transportation with minimal personal care. Best for active, independent seniors who want community without medical support.

MC

Memory Care Secured, specialized care for people living with Alzheimer's or dementia. Staff trained in cognitive impairment, with higher staff-to-resident ratios and an environment designed to reduce confusion and wandering risk.

Chattanooga (East Brainerd)127 35.1% -52%3.59 +21%-1%1234.6064- 17 Chattanooga One Op Holdings Llc$5.0M$3.6M72.5%445205
Martin-Boyd Christian Home -
NH

Nursing Home Licensed facility providing 24/7 skilled nursing care for residents with complex, ongoing medical needs. Staffed by RNs, LPNs, and CNAs. Inspected and star-rated annually by CMS. Accepts Medicare (short-term rehab) and Medicaid (long-term care).

AL

Assisted Living A licensed, long-term care setting for seniors or individuals with disabilities who need help with daily activities — like bathing, dressing, and medication management — but not 24-hour skilled nursing. Offers housing, meals, and around-the-clock support while aiming to maximize resident independence.

Chattanooga124--------000.00--------

Guides for Better Senior Living

Care Cost Calculator: See Prices in Your Area

Nursing Home Data Explorer

Don’t Wait Too Long: 7 Red Flag Signs Your Parent Needs Assisted Living Now

The True Cost of Assisted Living in 2025 – And How Families Are Paying For It

Understanding Senior Living Costs: Pricing Models, Discounts & Financial Assistance

Explore Open Rooms
1 Contact details
2 What type of senior care service are you looking for?
3 What budget do you have in mind for senior care?
4 How soon do you need to find care?
5 Additional details

Thank you for your interest!

Our team will be in touch shortly to help with next steps.