Lorien Taneytown
CMS overall rating Info CMS (the Centers for Medicare & Medicaid Services) is the federal agency that rates nursing home quality. Its Overall Rating runs from 1 to 5 stars, combining health inspections, staffing, and quality measures, with inspections weighted most heavily.

Lorien Taneytown

CMS overall rating Info CMS (the Centers for Medicare & Medicaid Services) is the federal agency that rates nursing home quality. Its Overall Rating runs from 1 to 5 stars, combining health inspections, staffing, and quality measures, with inspections weighted most heavily.
Calculator: See prices in your area
Lorien Taneytown accepts Medicare, Medicaid, and private pay.

Overview of Lorien Taneytown

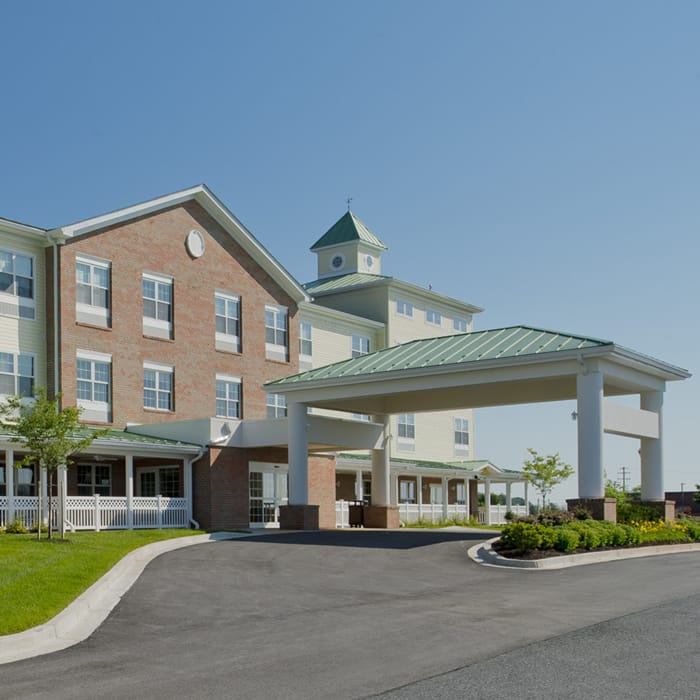
Lorien Taneytown is a 69-bed assisted living and skilled nursing community located at 100 Antrium Boulevard in Taneytown, Maryland. Serving older adults in Carroll County, the facility is owned and operated by Maryland Health Enterprises and provides levels of care ranging from assisted living to sub-acute rehabilitation.

Nursing hours at this facility are generally consistent with Maryland state averages. Nurse aide hours are reported at 2 hours and 22 minutes per resident per day, which is 10% above the state average. RN hours are 4% below the state average at 47 minutes per day, and weekend RN coverage is 5% below the state average at 35 minutes. LPN and physical therapist hours match state averages.

The Maryland Department of Health, Office of Health Care Quality, oversees the inspection of this facility. No specific inspection history is reported in the current source records, and the community maintains a citations-per-inspection rate of zero. Records show that no civil money penalties or payment denials have been imposed by CMS within the past three years.

The community offers skilled nursing, hospice, and respite care, along with a program that extends services to residents in their homes. Twenty-four-hour staffing and nursing coverage are in place. Specific details regarding on-site amenities, dining menus, and monthly pricing are not reported in the available source data, so families should request these details during a tour.

Providing a continuum of care with options for both on-site and in-home support makes this a viable option for local families. Families evaluating Lorien Taneytown should confirm Medicaid acceptance, current occupancy, and the full inspection history directly with the Maryland Department of Health before making a placement decision.

(410) 756-6400

Quality ratings

Measured by Centers for Medicare & Medicaid Services (CMS)

Overall rating Info The Overall CMS Rating combines results from health inspections, staffing levels and quality measures. Health inspections carry the most weight. Staffing and quality scores can increase or decrease the final rating based on performance compared to state and national standards.
▼ 41.3% Below MD avg. ▼ 41.3% Below MD avg.Click the badge to see the full State ranking.Click here to see the full State ranking.
Health Inspection Info Based on the results of the facility's three most recent standard inspections and any complaint investigations. CMS reviews the number, scope, and severity of deficiencies, with more recent findings weighted more heavily.
▼ 37.5% Below MD avg. ▼ 37.5% Below MD avg.Click the badge to see the full State ranking.Click here to see the full State ranking.
Staffing Info Measures average nursing staff hours per resident per day, including Registered Nurses (RNs) and total nursing staff. Ratings are adjusted based on the level of care residents require and are compared to state and national benchmarks.
▲ 13.0% Above MD avg. ▲ 13.0% Above MD avg.Click the badge to see the full State ranking.Click here to see the full State ranking.
Quality Measures Info Based on clinical and physical health indicators reported to CMS, such as hospital readmissions, falls, pressure ulcers, and improvements in mobility. These measures reflect how well residents' health needs are being managed.
▼ 46.4% Below MD avg. ▼ 46.4% Below MD avg.Click the badge to see the full State ranking.Click here to see the full State ranking.

Staffing hours breakdown

Info Daily nursing hours per resident by staff type, reported to CMS. Higher is generally better — compare this facility to state and national averages to see where staffing stands.

Hours per resident per day — compared to Maryland state averages

Total nursing care / resident Info This home is ranked 35th out of 144 homes in Maryland for nurse hours. Total adjusted nursing hours per resident per day, combining RN, LPN, and aide time. CMS adjusts this for case-mix so facilities can be fairly compared.
3h 59m per day
Rank #35 / 144Nurse hours — State benchmarkedThis home is ranked 35th out of 144 homes in Maryland. Shows adjusted nurse hours per resident per day benchmarked to the Maryland average, with a ranking across 144 Maryland facilities. More hours mean more direct care. The national average is about 3.5 hrs; below 3.0 is a red flag.Click the rank badge to see the full State ranking.Click here to see the full State ranking.
This facility Maryland avg (4h 17m per day)
vs Maryland avg
-7%

1 of 6 metrics below state avg

Standout metric Weekend RN is +13% above state avg
Staff typeHours / Day / Residentvs state avg
Registered Nurse (RN) Info RNs hold the highest nursing license and can assess residents, interpret test results, and direct care plans. More RN hours per day often signals stronger clinical oversight and faster response to health changes. 52m per day ▲ 7% State avg: 49m per day · National avg: 41m per day
LPN / LVN Info Licensed Practical Nurses (LPNs) or Licensed Vocational Nurses (LVNs) deliver routine hands-on care — medication administration, wound dressing, and monitoring vital signs. They work under RN supervision and make up a large share of daily bedside care. 1h 0m per day ▲ 10% State avg: 55m per day · National avg: 52m per day
Nurse Aide Info Certified Nurse Aides (CNAs) provide the most direct day-to-day assistance: bathing, dressing, feeding, and mobility. Nurse aide hours are typically the largest staffing category and directly affect residents' quality of life. 2h 20m per day ▲ 9% State avg: 2h 9m per day · National avg: 2h 20m per day
Weekend Total Nursing Info Combined nursing hours (RN + LPN + Nurse Aide) per resident per day on weekends. Staffing often drops on weekends — this figure reveals whether the facility maintains adequate coverage outside of weekday hours. 3h 34m per day ▲ 3% State avg: 3h 28m per day · National avg: 3h 26m per day
Physical Therapist Info Hours per resident per day provided by licensed Physical Therapists (PTs) or PT Assistants. PT services help residents recover mobility after injury or illness and are especially important for post-acute (short-stay) rehabilitation. 3m per day ▼ 34% State avg: 5m per day · National avg: 4m per day
Weekend RN Info Registered nurse hours specifically on weekends. Facilities sometimes reduce RN presence on Saturdays and Sundays — a low weekend RN figure compared to weekday hours can indicate reduced clinical oversight when most administrative staff are absent. 42m per day ▲ 13% State avg: 37m per day · National avg: 28m per day

Capacity and availability

Avg. Length of Stay
68 days
Bed community size
69-bed community Rank #195 / 697Bed count — State benchmarkedThis home is ranked 195th out of 697 homes in Maryland. Shows this facility's certified or reported bed count compared to other Maryland facilities. Larger communities may offer more amenities, programs, and on-site services for residents and families.Click the rank badge to see the full State ranking.Click here to see the full State ranking.
A moderately sized community that may balance personal attention with shared amenities and social activities.
Years in operation
12 years in operation Rank #145 / 208Years in operation — State benchmarkedThis home is ranked 145th out of 208 homes in Maryland. Shows how long this facility has been in operation compared to other Maryland facilities. Longer operating histories may benefit residents, families, and staff.Click the rank badge to see the full State ranking.Click here to see the full State ranking.
A community with a solid operating history and experience delivering ongoing care.
Walk Score
Walk Score: 62 / 100 Rank #286 / 985Walk Score — State benchmarkedThis home is ranked 286th out of 985 homes in Maryland. Shows how walkable this facility's neighborhood is compared to the average Walk Score across Maryland facilities. Higher scores benefit residents, families, and staff.Click the rank badge to see the full State ranking.Click here to see the full State ranking.
Moderately walkable. Some errands can be accomplished on foot, with a mix of nearby amenities.

About this community

Occupancy

Occupancy rate
75%
Rank #102 / 146Occupancy rate — State benchmarkedThis home is ranked 102nd out of 146 homes in Maryland. Shows this facility's occupancy rate versus the Maryland average, with its Statewide rank out of 146. Higher occupancy signals strong local demand and financial stability.Click the rank badge to see the full State ranking.Click here to see the full State ranking.
Higher than the Maryland average: 60%
Occupied beds
52 / 69
Average occupied beds in Maryland homes 104 beds

Awards

AwardsBest Nursing Home for 2018-19 by the US News and World Report, The Daily Record's 2019 Advancements Nursing and 2019 Nurse of the Year, The Baltimore Sun's 'Baltimore's Best' Elder Care (Reader's Choice)

License Details

Facility TypeAl
IssuanceDecember 1, 2013
CountyCarroll

Ownership & Operating Entity

Owner NameLorien - Maryland Health Enterprises
Profit StatusTrue

Room costs

Apartment $184 - $245 per day

Therapy & Rehabilitation

2 services
Rehabilitation Services
Respite Care

Staffing & Medical

1 service
24-Hour Staffing

Amenities & Lifestyle

Specific ProgramsSub-Acute Rehab / Skilled Nursing, Lorien at Home, Hospice Services

Contact Lorien Taneytown

Inspection History

In Maryland, the Department of Health, Office of Health Care Quality is the state agency that conducts unannounced inspections and issues reports for all assisted living and nursing facilities.

Since 2019 · 7 years of data 39 citations 4 inspections

Inspection Scorecard Info This scorecard compares key inspection, citation, and complaint metrics at this facility against the Maryland state average. Metrics rated ≥15% worse than average are highlighted in red; those ≥15% better are highlighted in green.

Since 2019 vs. Maryland state average
Overall vs. MD average 3 Worse Metrics worse than Maryland average:
• Total citations (875% above)
• Citations per year (833% above)
• Citations per inspection (1125% above)
1 Better Metrics better than Maryland average:
• Total inspections (20% below)
Latest Inspection September 25, 2025 Complaint Investigation

Citations Info Citations are formal regulatory issues recorded during state inspections.

This FacilityMD Averagevs. MD Avg
Total citations Info Formal regulatory issues recorded by inspectors across all inspection types. 394 This facility has 875% more total citations than a typical Maryland nursing home (39 vs. MD avg 4).↑ 875% worse
Citations per year Info Average citations per year since 2019. 5.60.6 This facility has 833% more citations per year than a typical Maryland nursing home (5.6 vs. MD avg 0.6).↑ 833% worse
Citations per inspection Info Average citations per inspection. 9.80.8 This facility has 1125% more citations per inspection than a typical Maryland nursing home (9.8 vs. MD avg 0.8).↑ 1125% worse

Inspections Info State inspections evaluate whether the facility meets health and safety standards.

This FacilityMD Averagevs. MD Avg
Total inspections Info Combined count of all routine and focused inspections. Excludes complaint investigations. 45 This facility has 20% fewer total inspections than a typical Maryland nursing home (4 vs. MD avg 5).↓ 20% better

Health Inspection History

Inspections since 2017
Total health inspections 5

Maryland average 3.9


Last Health inspection on Sep 2025

Total health citations
43 Rank #80 / 146Health citations — State benchmarkedThis home is ranked 80th out of 146 homes in Maryland. Shows this facility's total health deficiency citations benchmarked to the Maryland State average, with a ranking across all 146 MD facilities. Lower citation counts earn a better rank.Click the rank badge to see the full State ranking.Click here to see the full State ranking.

Maryland average 49.9

Citations per inspection
8.6 Rank #46 / 146Citations per inspection — State benchmarkedThis home is ranked 46th out of 146 homes in Maryland. Shows average deficiency citations per CMS inspection for this facility versus the Maryland mean across 146 facilities with citation data. Lower is better.Click the rank badge to see the full State ranking.Click here to see the full State ranking.

Maryland average 12.81


Health citations are formal notices following inspections when they fail to comply with safety and care standards.

34 of 43 citations resulted from standard inspections; and 9 of 43 resulted from complaint investigations.

Breakdown of citation severity (last 9 years)
Critical health citations
2
300% worse than Maryland average

Maryland average: 0.5


Serious health citations
0
100% better than Maryland average

Maryland average: 0.6

2 critical citations Maryland average: 0.5

0 serious citations Maryland average: 0.6

36 moderate citations Maryland average: 47.2

5 minor citations Maryland average: 1.7
Citations history (last 9 years)
Abuse/Neglect moderate citation Sep 25, 2025

Nutrition moderate citation Sep 25, 2025

Administration moderate citation Jun 27, 2025
Corrected

Administration moderate citation Jun 27, 2025
Corrected

Staffing Data

Reporting period: October 1 – December 31, 2025 (Q4 2025). Source: CMS Payroll-Based Journal report.

Total staff 139
Employees 76
Contractors 63
Staff to resident ratio 2.57 : 1
42% more staff per resident than Maryland average
Maryland average ratio: 1.81 : 1 Maryland average ratio: 1.81 : 1See full Maryland ranking
Avg staff/day 40
Average shift 7.2 hours
10% worse than Maryland average
Maryland average: 8 hours Maryland average shift: 8 hoursSee full Maryland ranking
Total staff hours (quarter) 26,556

Nursing staff breakdown

Q4 2025 · Oct 1 – Dec 31 More info This data comes from the CMS Payroll-Based Journal report covering October 1 – December 31, 2025.
Registered Nurse

Manages medical care and health needs.

RN Staff Info 24 total: 13 full-time employees and 11 contractors. 24
Average shift length Info Average shift length. Calculated as total hours divided by days worked and average staff per day. 7 hours
Licensed Practical Nurse

Assists with medical care and medications.

LPN Staff Info 20 total: 8 full-time employees and 12 contractors. 20
Average shift length Info Average shift length. Calculated as total hours divided by days worked and average staff per day. 7.9 hours
Certified Nursing Assistant

Helps with daily care and mobility.

CNA Staff Info 58 total: 33 full-time employees and 25 contractors. 58
Average shift length Info Average shift length. Calculated as total hours divided by days worked and average staff per day. 7.4 hours

Contractor staffing

Q4 2025 · Oct 1 – Dec 31 More info This data comes from the CMS Payroll-Based Journal report covering October 1 – December 31, 2025.

Total hours from contractors

29.2%

7,763 contractor hours this quarter

Certified Nursing Assistant: 25 Licensed Practical Nurse: 12 Registered Nurse: 11 Speech Language Pathologist: 4 Respiratory Therapy Technician: 3 Physical Therapy Assistant: 2 Qualified Social Worker: 2 Physical Therapy Aide: 1 Medical Director: 1 Occupational Therapy Aide: 1 Occupational Therapy Assistant: 1

Staff by category

Q4 2025 · Oct 1 – Dec 31 More info This data comes from the CMS Payroll-Based Journal report covering October 1 – December 31, 2025.
Certified Nursing Assistant33255811,26592100%7.4
Licensed Practical Nurse812203,63392100%7.9
Registered Nurse1311243,51092100%7
Other Dietary Services Staff110111,47392100%5.9
RN Director of Nursing3031,4066470%8
Dietitian2029466975%7.8
Speech Language Pathologist0447366874%6.3
Mental Health Service Worker1014656166%7.6
Administrator1014535762%7.9
Nurse Practitioner1014295459%7.9
Clinical Nurse Specialist1014245459%7.8
Qualified Social Worker0223596470%5.4
Physical Therapy Aide0113255762%5.7
Physical Therapy Assistant0223146368%4.8
Medication Aide/Technician1012833841%7.5
Respiratory Therapy Technician0332734953%5.6
Nurse Aide in Training1011411718%8.3
Occupational Therapy Aide011631112%5.7
Medical Director011431314%3.3
Occupational Therapy Assistant0111533%5
58 Certified Nursing Assistant
% of Days 100%
20 Licensed Practical Nurse
% of Days 100%
24 Registered Nurse
% of Days 100%
11 Other Dietary Services Staff
% of Days 100%
3 RN Director of Nursing
% of Days 70%
2 Dietitian
% of Days 75%
4 Speech Language Pathologist
% of Days 74%
1 Mental Health Service Worker
% of Days 66%
1 Administrator
% of Days 62%
1 Nurse Practitioner
% of Days 59%
1 Clinical Nurse Specialist
% of Days 59%
2 Qualified Social Worker
% of Days 70%
1 Physical Therapy Aide
% of Days 62%
2 Physical Therapy Assistant
% of Days 68%
1 Medication Aide/Technician
% of Days 41%
3 Respiratory Therapy Technician
% of Days 53%
1 Nurse Aide in Training
% of Days 18%
1 Occupational Therapy Aide
% of Days 12%
1 Medical Director
% of Days 14%
1 Occupational Therapy Assistant
% of Days 3%

Penalties and fines

Federal penalties imposed by CMS for regulatory violations, including civil money penalties (fines) and denials of payment for new Medicare/Medicaid admissions.

Source: CMS Penalties Database

No penalties in the past 3 years

No civil money penalties or payment denials were reported in the last 3 years.

Quality of care over time

These measures show how residents usually do over time at this home, based on health outcomes and preventive care.

High-risk clinical events score Info A composite score based on pressure ulcers, falls with injury, weight loss, walking ability decline, and activities of daily living decline. 17.9
38% worse than Maryland average

Maryland average: 12.9

Functional decline score Info A composite score based on activities of daily living decline, walking ability decline, and incontinence. 35.6
39% worse than Maryland average

Maryland average: 25.7

Long-stay resident measures
Significantly below average Info CMS star rating based on long-stay quality measure performance. 5 stars = significantly above average, 1 star = significantly below average.
Need for Help with Daily Activities Increased Info Percent of long-stay residents whose need for help with daily activities has increased 28.8%
22% worse than Maryland average

Maryland average: 23.7%

Walking Ability Worsened Info Percent of long-stay residents whose ability to move independently worsened 49.8%
80% worse than Maryland average

Maryland average: 27.7%

Low Risk Residents with Bowel/Bladder Incontinence Info Percent of low risk long-stay residents who lose control of their bowels or bladder 28.1%
8% worse than Maryland average

Maryland average: 25.9%

Falls with Major Injury Info Percent of long-stay residents experiencing one or more falls with major injury 3.7%
61% worse than Maryland average

Maryland average: 2.3%

High Risk Residents with Pressure Ulcers Info Percent of long-stay high risk residents with pressure ulcers 4.5%
32% better than Maryland average

Maryland average: 6.5%

Urinary Tract Infection Info Percent of long-stay residents with a urinary tract infection 11.0%
589% worse than Maryland average

Maryland average: 1.6%

Lost Too Much Weight Info Percent of long-stay residents who lose too much weight 2.9%
50% better than Maryland average

Maryland average: 5.8%

Depressive Symptoms Info Percent of long-stay residents who have depressive symptoms 16.7%
17% better than Maryland average

Maryland average: 20.2%

Antipsychotic Use Info Percent of long-stay residents who received an antipsychotic medication 23.0%
78% worse than Maryland average

Maryland average: 12.9%

Pneumococcal Vaccine Info Percent of long-stay residents assessed and appropriately given the pneumococcal vaccine 100.0%
9% better than Maryland average

Maryland average: 92.0%

Influenza Vaccine Info Percent of long-stay residents assessed and appropriately given the seasonal influenza vaccine 95.7%
In line with Maryland average

Maryland average: 96.6%

Hospitalizations per 1,000 days Info Number of hospitalizations per 1,000 long-stay resident days. 1.48
12% worse than Maryland average

Maryland average: 1.32

ED visits per 1,000 days Info Number of outpatient emergency department visits per 1,000 long-stay resident days. 1.39
15% worse than Maryland average

Maryland average: 1.21

Short-stay resident measures
Average Info CMS star rating based on short-stay quality measure performance. 5 stars = much above average, 1 star = much below average.
Pneumococcal Vaccine Info Percent of short-stay residents assessed and appropriately given the pneumococcal vaccine 97.3%
24% better than Maryland average

Maryland average: 78.4%

Antipsychotic medication increase Info Percent of short-stay residents who newly received an antipsychotic medication 1.9%
40% worse than Maryland average

Maryland average: 1.4%

Influenza Vaccine Info Percent of short-stay residents assessed and appropriately given the seasonal influenza vaccine 88.2%
9% better than Maryland average

Maryland average: 80.6%

Re-hospitalized after SNF stay Info Percentage of short-stay residents who were re-hospitalized after their nursing home admission. 25.1%
18% worse than Maryland average

Maryland average: 21.2%

Emergency department visits Info Percentage of short-stay residents who had an outpatient emergency department visit. 10.0%
In line with Maryland average

Maryland average: 9.9%

Falls with major injury Info Percentage of SNF residents who experience falls with major injury during their stay. 1.3%
64% worse than Maryland average

Maryland average: 0.8%

Ability to care for self at discharge Info Percentage of residents at or above expected ability to care for themselves at discharge. 54.6%
In line with Maryland average

Maryland average: 53.7%

Successful return to home or community Info Rate of successful return to home or community from a skilled nursing facility. 65.3%
29% better than Maryland average

Maryland average: 50.6%

Breakdown by payment type

Medicare

73% of new residents, usually for short-term rehab.

Typical stay 24 days

Private pay

22% of new residents, often for short stays.

Typical stay 10 months

Medicaid

5% of new residents, often for long-term daily care.

Typical stay 2 years

Facility Characteristics

Source: CMS Long-Term Care Facility Characteristics (Data as of Jan 2026)

Total residents 54
Medicare
13
24.1% of residents
Medicaid
33
61.1% of residents
Private pay or other
8
14.8% of residents
Programs & Services
Residents Group

Residents meet regularly to discuss policies, care quality, and activities

Active Resident Council

Organized group of residents that meets regularly to discuss facility policies, quality of life, and activities.

Finances and operations

Voluntary non-profit community
Operated by a church.
Home revenue
$13.2M
Operating deficit
-$657.1K
Voluntary non-profit community Operated by a church.
Home revenue
$13.2M Rank #113 / 145Revenue — State benchmarkedThis home is ranked 113th out of 145 homes in Maryland. Shows this facility's annual revenue compared to the Maryland average. Higher revenue generally means more resources for staffing and capital — read alongside Payroll %.Click the rank badge to see the full State ranking.Click here to see the full State ranking.
Operating deficit
-$657.1K
Payroll costs Info The portion of the home's budget spent on staff, including nurses, caregivers, and other employees who support care and operations. Rank #121 / 145Payroll — State benchmarkedThis home is ranked 121st out of 145 homes in Maryland. Shows total annual staff payroll benchmarked to the Maryland average. Higher payroll investment relative to peers often signals better staffing and less reliance on cheaper contract labor.Click the rank badge to see the full State ranking.Click here to see the full State ranking.
$5.8M
43.6% of revenue Rank #78 / 145Payroll % — State benchmarkedThis home is ranked 78th out of 145 homes in Maryland. Shows payroll as a percentage of revenue versus the Maryland average. Well-run Maryland facilities typically land around 49–57% — the top third Statewide. Below 25% may signal understaffing or heavy agency use — read with Staffing ratings.Click the rank badge to see the full State ranking.Click here to see the full State ranking.
Other operating costs Info All remaining costs needed to run the home, such as food, utilities, building maintenance, supplies and administrative expenses.
$8.1M
Total costs $13.8M

Who this home usually serves

TYPE OF STAY

Mostly short-term rehab stays

Most residents typically stay for a few weeks or months before returning home or moving on.

Places of interest near Lorien Taneytown

Address 0.0 miles from city center Info Estimated distance in miles from Taneytown's city center to Lorien Taneytown's address, calculated via Google Maps.

Calculate Travel Distance to Lorien Taneytown

Add your location

Address

Financial Assistance for
Nursing Home in Maryland

Lorien Taneytown is located in Taneytown, Maryland.
Here are the financial assistance programs available to residents in Maryland.

Get Financial aid guidance

Community Options Waiver

Maryland Medicaid Community Options Waiver

Age 65+ or disabled
General Maryland resident, Medicaid- eligible, nursing home-level care need.
Income Limits (2025) ~$2,829/month 300% FBR, individual
Asset Limits $2,000 (individual), $3,000 (couple) (excludes home, car).
MD

High urban demand; rural outreach efforts.

Benefits
Personal care (5-7 hours/day, e.g., bathing, dressing) Respite care (up to 240 hours/year) Adult day care ($70/day) Home modifications ($1,500 avg.)

Senior Care Program

Maryland Senior Care

Age 65+
General Maryland resident, at risk of nursing home placement.
Income Limits ~$2,000/month individual, varies by county
Asset Limits $11,000 individual
MD

Limited funding; waitlists common in high-demand areas.

Benefits
In-home care (3-5 hours/week) Respite care (up to 10 days/year) Meals (~$6/meal) Transportation (~5 trips/month) Case management

Maryland Nursing Home Medicaid

Maryland Medical Assistance (Medicaid) Nursing Home Program

Age 65+
General Maryland resident, Medicaid-eligible, requires nursing home-level care.
Income Limits (2025) $943/month (individual); most income applied to care costs.
Asset Limits $2,500 (individual), $3,000 (couple); spousal protections up to $155,356.
MD

Home equity limit $636,000; estate recovery applies post-55.

Benefits
24/7 nursing care Meals Therapy Medications (unlimited per medical need)

Senior Assisted Living Subsidy Program

Maryland Senior Assisted Living Group Home Subsidy

Age 62+
General Maryland resident, in or moving to approved assisted living, low/moderate income.
Income Limits (2025) ~$34,000/year individual, varies by county
Asset Limits Not strict; prioritizes low-income.
MD

Not available statewide; facility must be licensed by MDH.

Benefits
Personal care Meals 24-hour supervision (up to $1,500/month subsidy typical)

Veterans Aid and Attendance (A&A) Benefit

Maryland VA Aid and Attendance

Age
General Wartime veteran/spouse, age 65+ or disabled, needs ADL help, Maryland resident.
Income Limits (2025) Net income minus medical expenses < $1,984/month individual with A&A
Asset Limits $155,356 net worth limit
MD

High veteran population in suburban/rural areas.

Benefits
Cash benefit ($1,478-$2,471/month, varies by status) for care costs

Senior Prescription Drug Assistance Program (SPDAP)

Maryland Senior Prescription Drug Assistance Program

Age 65+
General Maryland resident (6+ months), Medicare Part D enrolled.
Income Limits (2025) $48,560/year individual, 300% FPL
Asset Limits None specified.
MD

Supplements Medicare Part D; annual enrollment required.

Benefits
Up to $40/month premium subsidy Reducing drug costs

Medicare Savings Programs (MSP)

Maryland Medicare Savings Programs

Age 65+
General Maryland resident, Medicare Part A/B enrollee.
Income Limits (2025) $2,014/month (QMB), $2,706/month (SLMB/QI, individual).
Asset Limits $9,090 (individual), $13,630 (couple).
MD

Includes QMB, SLMB, QI categories.

Benefits
Covers premiums (up to $174.70/month Part B) Co-pays Deductibles

Community Personal Assistance Services (CPAS)

Maryland Medicaid Community Personal Assistance Services

Age 65+
General Maryland resident, Medicaid-eligible, needs ADL assistance.
Income Limits (2025) $943/month (individual); spend-down available.
Asset Limits $2,500 (individual), $3,000 (couple).
MD

Consumer-directed option allows hiring family caregivers.

Benefits
Personal care (hours vary, typically 20-30/week) Chores Nurse supervision

Compare Nursing Home around Maryland

The information below is reported by the Maryland Department of Health, Office of Health Care Quality.

5 facilities compared · CMS & MD Dept. of Health data

Riderwood Village
NH

Nursing Home Licensed facility providing 24/7 skilled nursing care for residents with complex, ongoing medical needs. Staffed by RNs, LPNs, and CNAs. Inspected and star-rated annually by CMS. Accepts Medicare (short-term rehab) and Medicaid (long-term care).

AL

Assisted Living A licensed, long-term care setting for seniors or individuals with disabilities who need help with daily activities — like bathing, dressing, and medication management — but not 24-hour skilled nursing. Offers housing, meals, and around-the-clock support while aiming to maximize resident independence.

MC

Memory Care Secured, specialized care for people living with Alzheimer's or dementia. Staff trained in cognitive impairment, with higher staff-to-resident ratios and an environment designed to reduce confusion and wandering risk.

Silver Spring
275
Facility 275
MD AVG 43
Rank #3 / 697
73.9%
Facility 73.9%
MD AVG 82.4%
Rank #105 / 146
-10%
4.90
Facility 4.90
MD AVG 3.77
Rank #12 / 144
-27%+30%
$0
Facility $0
MD AVG $65.0k
Rank #1 / 146
18
Facility 18
MD AVG 49.9
Rank #9 / 146
6.0
Facility 6.0
MD AVG 12.8
Rank #9 / 146
-67-
33
Facility 33
MD AVG 43
Rank #597 / 985
Linda Wanner
$176.2M
Facility $176.2M
MD AVG $18.7M
Rank #1 / 145
$59.0M
Facility $59.0M
MD AVG $6.5M
Rank #1 / 145
33.5%
Facility 33.5%
MD AVG 38.5%
Rank #132 / 145
215343
Friends House Retirement Community
NH

Nursing Home Licensed facility providing 24/7 skilled nursing care for residents with complex, ongoing medical needs. Staffed by RNs, LPNs, and CNAs. Inspected and star-rated annually by CMS. Accepts Medicare (short-term rehab) and Medicaid (long-term care).

AL

Assisted Living A licensed, long-term care setting for seniors or individuals with disabilities who need help with daily activities — like bathing, dressing, and medication management — but not 24-hour skilled nursing. Offers housing, meals, and around-the-clock support while aiming to maximize resident independence.

Sandy Spring
24
Facility 24
MD AVG 43
Rank #256 / 697
--
4.26
Facility 4.26
MD AVG 3.77
Rank #26 / 144
-19%+13%
$23.0k
Facility $23.0k
MD AVG $65.0k
Rank #112 / 146
17
Facility 17
MD AVG 49.9
Rank #8 / 146
4.3
Facility 4.3
MD AVG 12.8
Rank #3 / 146
-65-
6
Facility 6
MD AVG 43
Rank #891 / 985
Kendall Anthony
$17.9M
Facility $17.9M
MD AVG $18.7M
Rank #76 / 145
$9.3M
Facility $9.3M
MD AVG $6.5M
Rank #54 / 145
51.8%
Facility 51.8%
MD AVG 38.5%
Rank #34 / 145
215211
Bedford Court, a CCRC
NH

Nursing Home Licensed facility providing 24/7 skilled nursing care for residents with complex, ongoing medical needs. Staffed by RNs, LPNs, and CNAs. Inspected and star-rated annually by CMS. Accepts Medicare (short-term rehab) and Medicaid (long-term care).

AL

Assisted Living A licensed, long-term care setting for seniors or individuals with disabilities who need help with daily activities — like bathing, dressing, and medication management — but not 24-hour skilled nursing. Offers housing, meals, and around-the-clock support while aiming to maximize resident independence.

IL

Independent Living Lifestyle-focused communities for older adults offering dining, activities, and transportation with minimal personal care. Best for active, independent seniors who want community without medical support.

Silver Spring (International Drive)
76
Facility 76
MD AVG 43
Rank #184 / 697
--
4.81
Facility 4.81
MD AVG 3.77
Rank #16 / 144
-36%+27%
$0
Facility $0
MD AVG $65.0k
Rank #1 / 146
23
Facility 23
MD AVG 49.9
Rank #21 / 146
7.7
Facility 7.7
MD AVG 12.8
Rank #35 / 146
-43-
64
Facility 64
MD AVG 43
Rank #261 / 985
Welltower Opco Group LLC
$26.5M
Facility $26.5M
MD AVG $18.7M
Rank #36 / 145
$10.4M
Facility $10.4M
MD AVG $6.5M
Rank #41 / 145
39.2%
Facility 39.2%
MD AVG 38.5%
Rank #112 / 145
215246
Complete Care at Springbrook
NH

Nursing Home Licensed facility providing 24/7 skilled nursing care for residents with complex, ongoing medical needs. Staffed by RNs, LPNs, and CNAs. Inspected and star-rated annually by CMS. Accepts Medicare (short-term rehab) and Medicaid (long-term care).

AL

Assisted Living A licensed, long-term care setting for seniors or individuals with disabilities who need help with daily activities — like bathing, dressing, and medication management — but not 24-hour skilled nursing. Offers housing, meals, and around-the-clock support while aiming to maximize resident independence.

Silver Spring
93
Facility 93
MD AVG 43
Rank #151 / 697
83.9%
Facility 83.9%
MD AVG 82.4%
Rank #76 / 146
+2%
2.77
Facility 2.77
MD AVG 3.77
Rank #142 / 144
-72%-27%
$0
Facility $0
MD AVG $65.0k
Rank #1 / 146
33
Facility 33
MD AVG 49.9
Rank #45 / 146
6.6
Facility 6.6
MD AVG 12.8
Rank #15 / 146
184A+
36
Facility 36
MD AVG 43
Rank #563 / 985
-
$17.9M
Facility $17.9M
MD AVG $18.7M
Rank #79 / 145
$7.0M
Facility $7.0M
MD AVG $6.5M
Rank #95 / 145
39.2%
Facility 39.2%
MD AVG 38.5%
Rank #112 / 145
215052
Lorien Taneytown
NH

Nursing Home Licensed facility providing 24/7 skilled nursing care for residents with complex, ongoing medical needs. Staffed by RNs, LPNs, and CNAs. Inspected and star-rated annually by CMS. Accepts Medicare (short-term rehab) and Medicaid (long-term care).

AL

Assisted Living A licensed, long-term care setting for seniors or individuals with disabilities who need help with daily activities — like bathing, dressing, and medication management — but not 24-hour skilled nursing. Offers housing, meals, and around-the-clock support while aiming to maximize resident independence.

Taneytown
69
Facility 69
MD AVG 43
Rank #195 / 697
74.8%
Facility 74.8%
MD AVG 82.4%
Rank #102 / 146
-9%
3.98
Facility 3.98
MD AVG 3.77
Rank #35 / 144
+26%+6%
$65.4k
Facility $65.4k
MD AVG $65.0k
Rank #1 / 146
43
Facility 43
MD AVG 49.9
Rank #80 / 146
8.6
Facility 8.6
MD AVG 12.8
Rank #46 / 146
255-
62
Facility 62
MD AVG 43
Rank #286 / 985
Bernadette Beard
$13.2M
Facility $13.2M
MD AVG $18.7M
Rank #113 / 145
$5.8M
Facility $5.8M
MD AVG $6.5M
Rank #121 / 145
43.6%
Facility 43.6%
MD AVG 38.5%
Rank #78 / 145
215348

Frequently Asked Questions about Lorien Taneytown

Who is the owner of Lorien Taneytown?

The legal owner and operator of Lorien Taneytown is Lorien - Maryland Health Enterprises.

Is Lorien Taneytown in a walkable area?

Lorien Taneytown has a walk score of 62. Moderately walkable. Some errands can be accomplished on foot, with a mix of nearby amenities.

What is the occupancy rate at Lorien Taneytown?

Lorien Taneytown's occupancy is 75%.

How many beds does Lorien Taneytown have?

Lorien Taneytown has 69 beds.

Are there photos of Lorien Taneytown?

Yes — there are 3 photos of Lorien Taneytown in the photo gallery on this page.

What is the address of Lorien Taneytown?

Lorien Taneytown is located at 100 Antrium Boulevard.

What is the phone number of Lorien Taneytown?

(410) 756-6400 will put you in contact with the team at Lorien Taneytown.

Guides for Better Senior Living

Care Cost Calculator: See Prices in Your Area

Nursing Home Data Explorer

Don’t Wait Too Long: 7 Red Flag Signs Your Parent Needs Assisted Living Now

The True Cost of Assisted Living in 2025 – And How Families Are Paying For It

Understanding Senior Living Costs: Pricing Models, Discounts & Financial Assistance

Explore Open Rooms
1 Contact details
2 What type of senior care service are you looking for?
3 What budget do you have in mind for senior care?
4 How soon do you need to find care?
5 Additional details

Thank you for your interest!

Our team will be in touch shortly to help with next steps.