Manor Hills
Memory Care & Assisted Living · New York, NY
CMS overall rating Info The Overall CMS Rating is scored from 1 to 5 stars and combines results from health inspections, staffing levels, and quality measures. Health inspections carry the most weight. Staffing and quality scores can increase or decrease the final rating based on performance compared to state and national standards.

Manor Hills

Memory Care & Assisted Living · New York, NY
CMS overall rating Info The Overall CMS Rating is scored from 1 to 5 stars and combines results from health inspections, staffing levels, and quality measures. Health inspections carry the most weight. Staffing and quality scores can increase or decrease the final rating based on performance compared to state and national standards.
Calculator: See prices in your area
Manor Hills accepts Medicare, Medicaid, and private pay.

Overview of Manor Hills

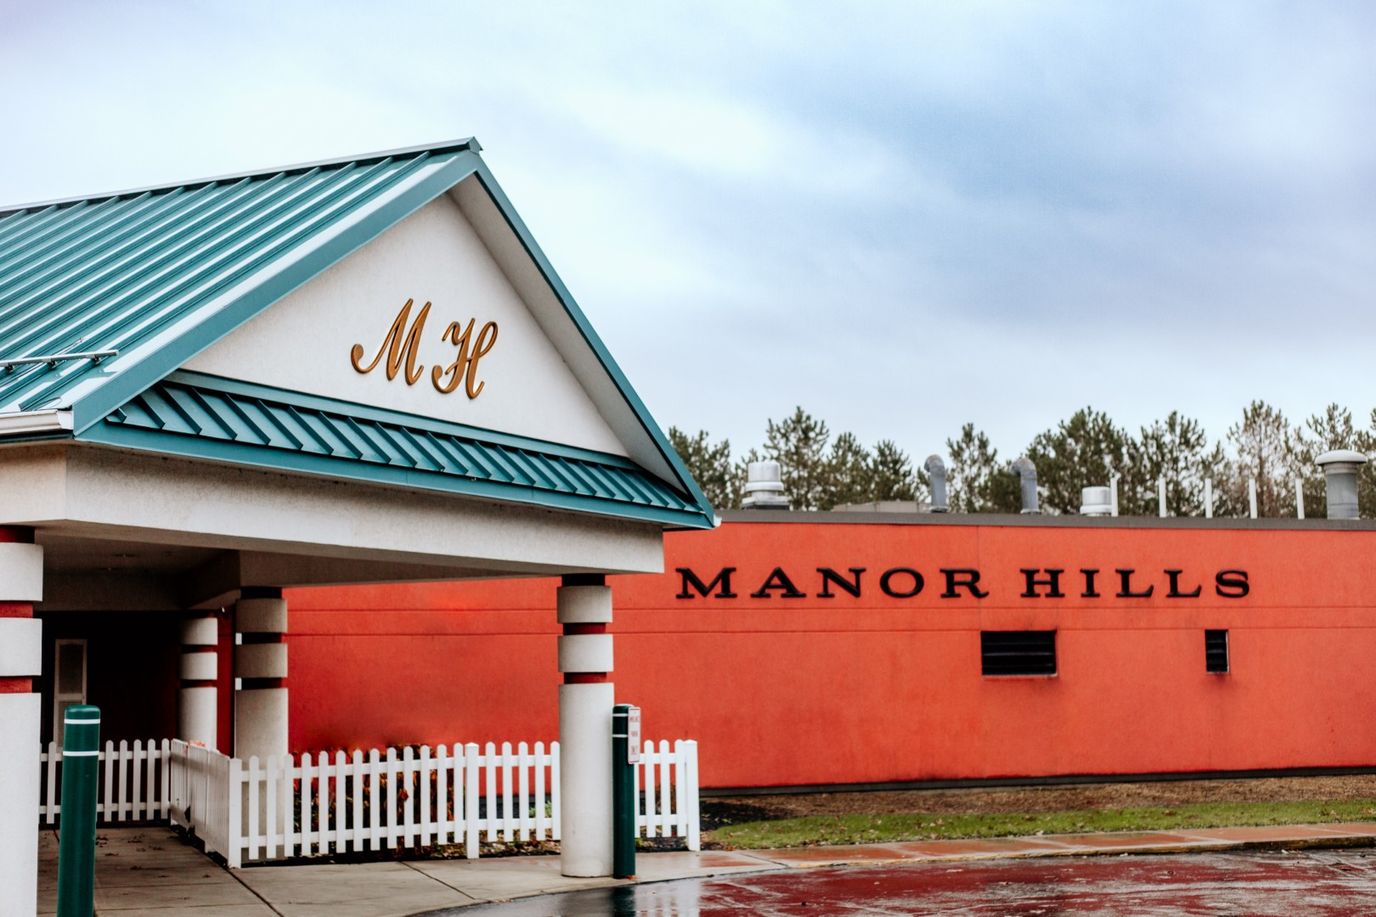
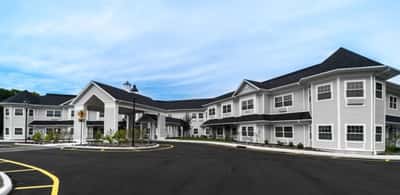
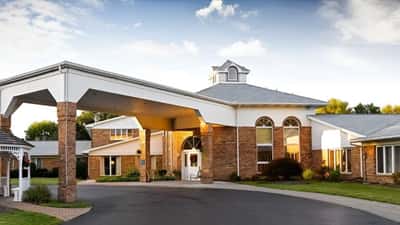
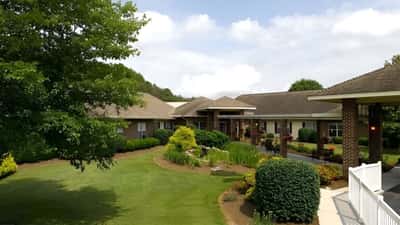
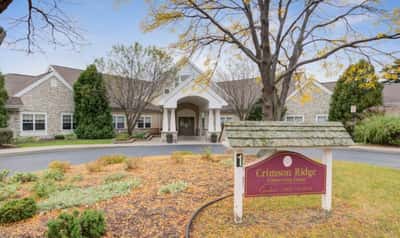
Manor Hills is a compassionate assisted living and memory care community in Wellsville, NY, that offers personal care and memory care. With a warm and welcoming environment, the community ensures older adults are comfortable. Housekeeping, meal service, and onsite activities are also offered, so residents have a hassle-free living. The community utilizes personalized approach to care to enhance residents’ living experiences.

Residents can freely interact with their peers and participate in a variety of fun activities. An activity room, outdoor seating, and a hair salon are also available for residents’ recreation and wellness. With its ideal location in a quiet residential area, residents experience a laid-back retirement. This senior living community is a good option for retirement in New York, especially with its dedicated services.

(518) 621-7309

Quality ratings

Measured by Centers for Medicare & Medicaid Services (CMS)

Overall rating Info The Overall CMS Rating combines results from health inspections, staffing levels and quality measures. Health inspections carry the most weight. Staffing and quality scores can increase or decrease the final rating based on performance compared to state and national standards.
▲ 59.2% Above NY avg. ▲ 59.2% Above NY avg.Click the badge to see the full State ranking.Click here to see the full State ranking.
Health Inspection Info Based on the results of the facility's three most recent standard inspections and any complaint investigations. CMS reviews the number, scope, and severity of deficiencies, with more recent findings weighted more heavily.
▲ 76.1% Above NY avg. ▲ 76.1% Above NY avg.Click the badge to see the full State ranking.Click here to see the full State ranking.
Staffing Info Measures average nursing staff hours per resident per day, including Registered Nurses (RNs) and total nursing staff. Ratings are adjusted based on the level of care residents require and are compared to state and national benchmarks.
▲ 48.1% Above NY avg. ▲ 48.1% Above NY avg.Click the badge to see the full State ranking.Click here to see the full State ranking.
Quality Measures Info Based on clinical and physical health indicators reported to CMS, such as hospital readmissions, falls, pressure ulcers, and improvements in mobility. These measures reflect how well residents' health needs are being managed.
▼ 49.4% Below NY avg. ▼ 49.4% Below NY avg.Click the badge to see the full State ranking.Click here to see the full State ranking.

Staffing hours breakdown

Info Daily nursing hours per resident by staff type, reported to CMS. Higher is generally better — compare this facility to state and national averages to see where staffing stands.

Hours per resident per day — compared to New York state averages

Total nursing care / resident Info This home is ranked 60th out of 388 homes in New York. Total adjusted nursing hours per resident per day, combining RN, LPN, and aide time. CMS adjusts this for case-mix so facilities can be fairly compared.
4h 9m per day
Rank #60 / 388Nurse hours — State benchmarkedThis home is ranked 60th out of 388 homes in New York. Shows adjusted nurse hours per resident per day benchmarked to the New York average, with a ranking across 388 New York SNFs. More hours mean more direct care. The national average is about 3.5 hrs; below 3.0 is a red flag.Click the rank badge to see the full State ranking.Click here to see the full State ranking.
This facility New York avg (3h 29m per day)
vs New York avg
+19%

2 of 6 metrics below state avg

Standout metric Registered Nurse (RN) is +7% above state avg
Staff typeHours / Day / Residentvs state avg
Registered Nurse (RN) Info RNs hold the highest nursing license and can assess residents, interpret test results, and direct care plans. More RN hours per day often signals stronger clinical oversight and faster response to health changes. 45m per day ▲ 7% State avg: 42m per day · National avg: 41m per day
LPN / LVN Info Licensed Practical Nurses (LPNs) or Licensed Vocational Nurses (LVNs) deliver routine hands-on care — medication administration, wound dressing, and monitoring vital signs. They work under RN supervision and make up a large share of daily bedside care. 38m per day ▼ 17% State avg: 46m per day · National avg: 52m per day
Nurse Aide Info Certified Nurse Aides (CNAs) provide the most direct day-to-day assistance: bathing, dressing, feeding, and mobility. Nurse aide hours are typically the largest staffing category and directly affect residents' quality of life. 2h 19m per day ▲ 6% State avg: 2h 11m per day · National avg: 2h 21m per day
Weekend Total Nursing Info Combined nursing hours (RN + LPN + Nurse Aide) per resident per day on weekends. Staffing often drops on weekends — this figure reveals whether the facility maintains adequate coverage outside of weekday hours. 3h 8m per day ■ Avg State avg: 3h 10m per day · National avg: 3h 26m per day
Physical Therapist Info Hours per resident per day provided by licensed Physical Therapists (PTs) or PT Assistants. PT services help residents recover mobility after injury or illness and are especially important for post-acute (short-stay) rehabilitation. 1m per day ▼ 86% State avg: 7m per day · National avg: 4m per day
Weekend RN Info Registered nurse hours specifically on weekends. Facilities sometimes reduce RN presence on Saturdays and Sundays — a low weekend RN figure compared to weekday hours can indicate reduced clinical oversight when most administrative staff are absent. 29m per day ▲ 4% State avg: 28m per day · National avg: 29m per day

Types of Care at Manor Hills

Assisted Living Memory Care

Capacity and availability

This home usually has limited availability

Occupancy between 85% and 95% suggests balanced demand.

Higher occupancy than the New York average: 88.3%
Occupancy rate 92.2% Rank #215 / 433Occupancy rate — State benchmarkedThis home is ranked 215th out of 433 homes in New York. Shows this facility's occupancy rate versus the New York average, with its Statewide rank out of 433. Higher occupancy signals strong local demand and financial stability.Click the rank badge to see the full State ranking.Click here to see the full State ranking.
Avg. Length of Stay 388 days
Occupancy rate
92.2% Rank #215 / 433Occupancy rate — State benchmarkedThis home is ranked 215th out of 433 homes in New York. Shows this facility's occupancy rate versus the New York average, with its Statewide rank out of 433. Higher occupancy signals strong local demand and financial stability.Click the rank badge to see the full State ranking.Click here to see the full State ranking.
Avg. Length of Stay
388 days
Bed community size
137-bed community Rank #379 / 752Bed count — State benchmarkedThis home is ranked 379th out of 752 homes in New York. Shows this facility's certified or reported bed count compared to other New York SNFs. Larger communities may offer more amenities, programs, and on-site services for residents and families.Click the rank badge to see the full State ranking.Click here to see the full State ranking.
A larger shared setting that may offer more common spaces and organized community services.
Years in operation
37 years in operation Rank #15 / 81Years in operation — State benchmarkedThis home is ranked 15th out of 81 homes in New York. Shows how long this facility has been in operation compared to other New York SNFs. Longer operating histories may benefit residents, families, and staff.Click the rank badge to see the full State ranking.Click here to see the full State ranking.
A longer operating history, which may indicate experience navigating regulations and delivering ongoing care.
Walk Score
Walk Score: 47 / 100 Rank #804 / 1167Walk Score — State benchmarkedThis home is ranked 804th out of 1167 homes in New York. Shows how walkable this facility's neighborhood is compared to the average Walk Score across New York SNFs. Higher scores benefit residents, families, and staff.Click the rank badge to see the full State ranking.Click here to see the full State ranking.
Somewhat walkable. A few nearby services may be reachable on foot, but most trips require transportation.

About this community

License Details

Facility TypeAdult Home
CountyAllegany

Ownership & Operating Entity

Manor Hills is legally operated by Willow Ridge Senior Living, LLC.

Therapy & Rehabilitation

1 service
Respite Care

Staffing & Medical

1 service
Licensed Nurses/CNAs

Amenities & Lifestyle

Hair Salon
Outdoor Seating
Common Areas For Socializing
Private Dining Room
Activity Room
Onsite Activities
Specific ProgramsPersonal Care Services, Housekeeping & Laundry Services, Case Management, Meal Service

Dining & Nutrition

Food DescriptionResidents enjoy restaurant-style dining with three well-balanced meals prepared by experienced chefs.

Contact Manor Hills

Inspection History

In New York, the Department of Health, Office of Aging and Long Term Care performs unannounced onsite inspections to monitor compliance with state and federal healthcare regulations.

Since 2019 · 7 years of data 0 enforcement actions 1 inspection
Inspection Score Info A composite 0–100 score combining this facility's inspections, citations, complaints, and enforcement actions relative to the New York state average. We don't score profiles with fewer than 3 inspections on record because a small inspection history reads as "below average" on every count-based metric — that would over-reward a facility just for being new.

Limited inspection history. Only 1 inspection on record — not enough to score against the New York benchmark.

New York assisted living residences benchmark: C+ 77/100

Inspection score not available. Only 1 inspection on record, which is below our minimum threshold for scoring.

Inspection Scorecard Info This scorecard compares key inspection, citation, and complaint metrics at this facility against the New York state average. Metrics rated ≥15% worse than average are highlighted in red; those ≥15% better are highlighted in green.

Since 2019 vs. New York state average
Overall vs. NY average 0 Worse No metrics in this bucket. 2 Better Metrics better than New York average:
• Total inspections (89% below)
• Complaint visits (100% below)

Inspections Info State inspections evaluate whether the facility meets health and safety standards.

This FacilityNY Averagevs. NY Avg
Total inspections Info Combined count of all routine and focused inspections. Excludes complaint investigations. 19 This facility has 89% fewer total inspections than a typical New York assisted living residence (1 vs. NY avg 9).↓ 89% better
Complaint visits Info On-site visits triggered by formal complaints filed by residents, families, or staff. 06 This facility has 100% fewer complaint visits than a typical New York assisted living residence (0 vs. NY avg 6).↓ 100% better

Inspection Reports Summary Info An editor-reviewed summary of the themes and findings across this facility's recent inspection reports.

The most recent inspection on July 31, 2025, found no deficiencies at the facility. Earlier inspections during the reporting period also showed no citations or enforcement actions. There were no complaint investigations noted in the available reports. This consistent record indicates the facility met regulatory requirements throughout the timeframe. No enforcement actions or fines were listed in the available reports.

Read the full inspection reports for this facility, including detailed findings and corrective actions.

Show Inspection Reports

Health Inspection History

Inspections since 2019
Total health inspections 3

State average 3.6


Last Health inspection on Jun 2024

Total health citations
10 Rank #74 / 394Health citations — State benchmarkedThis home is ranked 74th out of 394 homes in New York. Shows this facility's total health deficiency citations benchmarked to the New York State average, with a ranking across all 394 NY SNFs. Lower citation counts earn a better rank.Click the rank badge to see the full State ranking.Click here to see the full State ranking.

State average 18.5

Citations per inspection
3.33 Rank #84 / 394Citations per inspection — State benchmarkedThis home is ranked 84th out of 394 homes in New York. Shows average deficiency citations per CMS inspection for this facility versus the New York mean across 394 SNFs with citation data. Lower is better.Click the rank badge to see the full State ranking.Click here to see the full State ranking.

State average 5.05


Health citations are formal notices following inspections when they fail to comply with safety and care standards.

9 of 10 citations resulted from standard inspections; and 1 of 10 came from combined inspections (standard and complaint).

Breakdown of citation severity (last 7 years)
Critical health citations
0
100% better than State average

State average: 0.2


Serious health citations
0
100% better than State average

State average: 0.2

0 critical citations State average: 0.2

0 serious citations State average: 0.2

7 moderate citations State average: 17.4

3 minor citations State average: 0.7
Citations history (last 7 years)
Infection Control moderate citation Jun 14, 2024
Corrected

Nutrition moderate citation Jun 14, 2024
Corrected

Quality of Care moderate citation Jun 14, 2024
Corrected

Resident Rights minor citation Jun 14, 2024
Corrected

Lawsuit overview for Manor Hills

Summary of court-record activity tied to this facility, compiled from publicly available case dockets.

Source: State court e-filing records

Total Cases Info Every lawsuit on record involving this facility since the earliest filing. Long-term volume signals overall legal exposure. 1
Active Cases Info Lawsuits still moving through the courts. Active claims can affect day-to-day operations, settlement risk, and insurance posture. 1 1 active
Closed Info Cases that have been disposed of — dismissed, settled, or decided. Shows how the facility has historically resolved disputes. 0 0 Disposed
Since Info Year of the earliest case on record. A long history with steady filings suggests persistent issues; a recent first filing means newer exposure. 2026
Most Recent Info Most recent filing on record. Recent activity means legal disputes are still being raised against this facility. 2026
Next Court Date Info Next scheduled court appearance on record across active cases. Jun 15, 2026

Staffing Data

Reporting period: October 1 – December 31, 2025 (Q4 2025). Source: CMS Payroll-Based Journal report.

Total staff 119
Employees 116
Contractors 3
Staff to resident ratio 1.11:1
535% better than New York average
New York average ratio: 0.18:1 New York average ratio: 0.18:1See full New York ranking
Avg staff/day 61
Average shift 7.6 hours
0% compared with New York average
New York average: 7.7 hours New York average shift: 7.7 hoursSee full New York ranking
Total staff hours (quarter) 42,899

Nursing staff breakdown

Q4 2025 · Oct 1 – Dec 31 More info This data comes from the CMS Payroll-Based Journal report covering October 1 – December 31, 2025.
Registered Nurse

Manages medical care and health needs.

RN Staff 20
Average shift length Info Average shift length. Calculated as total hours divided by days worked and average staff per day. 7.7 hours

This role is partially covered by contractors.

Licensed Practical Nurse

Assists with medical care and medications.

LPN Staff 18
Average shift length Info Average shift length. Calculated as total hours divided by days worked and average staff per day. 9 hours

No contractors work on this role.

Certified Nursing Assistant

Helps with daily care and mobility.

CNA Staff 71
Average shift length Info Average shift length. Calculated as total hours divided by days worked and average staff per day. 7.4 hours

No contractors work on this role.

Contractor staffing

Q4 2025 · Oct 1 – Dec 31 More info This data comes from the CMS Payroll-Based Journal report covering October 1 – December 31, 2025.

Total hours from contractors

3.5%

1,517 contractor hours this quarter

Registered Nurse: 3

Staff by category

Q4 2025 · Oct 1 – Dec 31 More info This data comes from the CMS Payroll-Based Journal report covering October 1 – December 31, 2025.
Certified Nursing Assistant7107126,30392100%7.4
Registered Nurse173208,17892100%7.7
Licensed Practical Nurse180186,71192100%9
Other Dietary Services Staff3039137379%5.9
Physical Therapy Assistant2023044246%7.2
Occupational Therapy Aide1011442325%6.2
Dental Services Staff1011251617%7.8
Qualified Social Worker1011133134%3.6
Respiratory Therapy Technician1011031213%8.6
Mental Health Service Worker101811%7.5
71 Certified Nursing Assistant
% of Days 100%
20 Registered Nurse
% of Days 100%
18 Licensed Practical Nurse
% of Days 100%
3 Other Dietary Services Staff
% of Days 79%
2 Physical Therapy Assistant
% of Days 46%
1 Occupational Therapy Aide
% of Days 25%
1 Dental Services Staff
% of Days 17%
1 Qualified Social Worker
% of Days 34%
1 Respiratory Therapy Technician
% of Days 13%
1 Mental Health Service Worker
% of Days 1%

Penalties and fines

Federal penalties imposed by CMS for regulatory violations, including civil money penalties (fines) and denials of payment for new Medicare/Medicaid admissions.

Source: CMS Penalties Database

No penalties in the past 3 years

No civil money penalties or payment denials were reported in the last 3 years.

Quality of care over time

These measures show how residents usually do over time at this home, based on health outcomes and preventive care.

High-risk clinical events score Info A composite score based on pressure ulcers, falls with injury, weight loss, walking ability decline, and activities of daily living decline. 11.6
18% worse than New York average

New York average: 9.8

Functional decline score Info A composite score based on activities of daily living decline, walking ability decline, and incontinence. 21.8
20% worse than New York average

New York average: 18.1

Long-stay resident measures
Significantly below average Info CMS star rating based on long-stay quality measure performance. 5 stars = significantly above average, 1 star = significantly below average.
Need for Help with Daily Activities Increased Info Percent of long-stay residents whose need for help with daily activities has increased 20.3%
23% worse than New York average

New York average: 16.4%

Walking Ability Worsened Info Percent of long-stay residents whose ability to move independently worsened 24.5%
48% worse than New York average

New York average: 16.6%

Low Risk Residents with Bowel/Bladder Incontinence Info Percent of low risk long-stay residents who lose control of their bowels or bladder 20.5%
In line with New York average

New York average: 21.4%

Falls with Major Injury Info Percent of long-stay residents experiencing one or more falls with major injury 1.7%
42% better than New York average

New York average: 3.0%

High Risk Residents with Pressure Ulcers Info Percent of long-stay high risk residents with pressure ulcers 7.2%
In line with New York average

New York average: 7.2%

Urinary Tract Infection Info Percent of long-stay residents with a urinary tract infection 1.8%
29% worse than New York average

New York average: 1.4%

Lost Too Much Weight Info Percent of long-stay residents who lose too much weight 4.3%
29% better than New York average

New York average: 6.1%

Depressive Symptoms Info Percent of long-stay residents who have depressive symptoms 4.5%
75% better than New York average

New York average: 18.1%

Antipsychotic Use Info Percent of long-stay residents who received an antipsychotic medication 28.8%
129% worse than New York average

New York average: 12.6%

Pneumococcal Vaccine Info Percent of long-stay residents assessed and appropriately given the pneumococcal vaccine 100.0%
9% better than New York average

New York average: 91.4%

Influenza Vaccine Info Percent of long-stay residents assessed and appropriately given the seasonal influenza vaccine 100.0%
5% better than New York average

New York average: 95.2%

Hospitalizations per 1,000 days Info Number of hospitalizations per 1,000 long-stay resident days. 2.02
18% worse than New York average

New York average: 1.71

ED visits per 1,000 days Info Number of outpatient emergency department visits per 1,000 long-stay resident days. 1.52
13% worse than New York average

New York average: 1.35

Short-stay resident measures
Below average Info CMS star rating based on short-stay quality measure performance. 5 stars = much above average, 1 star = much below average.
Pneumococcal Vaccine Info Percent of short-stay residents assessed and appropriately given the pneumococcal vaccine 100.0%
30% better than New York average

New York average: 76.6%

Antipsychotic medication increase Info Percent of short-stay residents who newly received an antipsychotic medication 2.4%
85% worse than New York average

New York average: 1.3%

Influenza Vaccine Info Percent of short-stay residents assessed and appropriately given the seasonal influenza vaccine 100.0%
27% better than New York average

New York average: 78.8%

Re-hospitalized after SNF stay Info Percentage of short-stay residents who were re-hospitalized after their nursing home admission. 26.7%
30% worse than New York average

New York average: 20.6%

Emergency department visits Info Percentage of short-stay residents who had an outpatient emergency department visit. 8.8%
9% better than New York average

New York average: 9.7%

Falls with major injury Info Percentage of SNF residents who experience falls with major injury during their stay. 0.0%
100% better than New York average

New York average: 0.8%

Ability to care for self at discharge Info Percentage of residents at or above expected ability to care for themselves at discharge. 48.1%
10% worse than New York average

New York average: 53.7%

Successful return to home or community Info Rate of successful return to home or community from a skilled nursing facility. 43.8%
13% worse than New York average

New York average: 50.6%

Breakdown by payment type

Medicare

51% of new residents, usually for short-term rehab.

Typical stay 2 - 3 months

Private pay

13% of new residents, often for short stays.

Typical stay 5 - 6 months

Medicaid

35% of new residents, often for long-term daily care.

Typical stay 2 years

Facility Characteristics

Source: CMS Long-Term Care Facility Characteristics (Data as of Jan 2026)

Total residents 107
Medicare
7
6.5% of residents
Medicaid
67
62.6% of residents
Private pay or other
33
30.8% of residents
Programs & Services
Residents Group

Residents meet regularly to discuss policies, care quality, and activities

Nurse Aide Training

State-approved Nurse Aide Training and Competency Evaluation Program on-site

Active Resident Council

Organized group of residents that meets regularly to discuss facility policies, quality of life, and activities.

Finances and operations

Privately-owned community
Operated by a partnership between two or more business owners.
Home revenue
$12.7M
Profit
$989.4K
Privately-owned community Operated by a partnership between two or more business owners.
Home revenue
$12.7M Rank #344 / 383Revenue — State benchmarkedThis home is ranked 344th out of 383 homes in New York. Shows this facility's annual revenue compared to the New York SNF average. Higher revenue generally means more resources for staffing and capital — read alongside Payroll %.Click the rank badge to see the full State ranking.Click here to see the full State ranking.
Profit
$989.4K
Payroll costs Info The portion of the home's budget spent on staff, including nurses, caregivers, and other employees who support care and operations. Rank #324 / 383Payroll — State benchmarkedThis home is ranked 324th out of 383 homes in New York. Shows total annual staff payroll benchmarked to the New York average. Higher payroll investment relative to peers often signals better staffing and less reliance on cheaper contract labor.Click the rank badge to see the full State ranking.Click here to see the full State ranking.
$7.3M
57.6% of revenue Rank #85 / 383Payroll % — State benchmarkedThis home is ranked 85th out of 383 homes in New York. Shows payroll as a percentage of revenue versus the New York average. Well-run New York SNFs typically land around 53–65% — the top third Statewide. Below 25% may signal understaffing or heavy agency use — read with Staffing ratings.Click the rank badge to see the full State ranking.Click here to see the full State ranking.
Other operating costs Info All remaining costs needed to run the home, such as food, utilities, building maintenance, supplies and administrative expenses.
$4.4M
Total costs $11.7M

What does this home offer?

Housing options icon

Housing Options: Studio / 1 Bed / Semi-Private Rooms

Building type icon
Building type icon

Building Type: Single-story

Dining services icon

Dining Services

Beauty services icon

Beauty Services

Housekeeping icon
Housekeeping icon

Housekeeping Services

Social and recreational activities icon

Social and Recreational Activities

Who this home usually serves

TYPE OF STAY

Mostly short-term rehab stays

Most residents typically stay for a few weeks or months before returning home or moving on.

Places of interest near Manor Hills

Address 1.3 miles from city center Info Estimated distance in miles from Wellsville's city center to Manor Hills's address, calculated via Google Maps.

Calculate Travel Distance to Manor Hills

Add your location

Address

Financial Assistance for
Memory Care in New York

Manor Hills is located in Wellsville, New York.
Here are the financial assistance programs available to residents in New York.

Get Financial aid guidance

Community First Choice Option

NY Medicaid CFCO

Age 65+ or disabled
General New York resident, Medicaid- eligible, care need (not necessarily nursing home level).
Income Limits (2025) ~$2,829/month 300% FBR, individual
Asset Limits $30,182 individual, higher due to NY Medicaid expansion
NY

Higher asset limit; urban density increases demand.

Benefits
Personal care (5-7 hours/day) Respite care (240 hours/year) Home modifications ($1,500 avg.) Assistive technology ($500 avg.)

Expanded In-Home Services for the Elderly Program (EISEP)

NY EISEP

Age 60+
General New York resident, at risk of decline but not nursing home level.
Income Limits ~$2,500/month individual, varies
Asset Limits $15,000 individual
NY

Cost-sharing required above certain income; urban/rural balance.

Benefits
In-home care (3-5 hours/week) Respite (up to 10 days/year) Case management Transportation (~5 trips/month)

Senior Citizen Rent Increase Exemption (SCRIE)

NY SCRIE

Age 62+
General NYC resident, live in rent-controlled/stabilized apartment, spend >1/3 of income on rent.
Income Limits (2025) $50,000/year household
Asset Limits No strict asset cap, but income-focused eligibility.
NY

Limited to NYC’s rent-regulated units; high demand in urban areas.

Benefits
Rent freeze (e.g., covers increases of $50-$200+/month); tax credit for landlord

Senior Citizen Homeowners’ Exemption (SCHE)

NY SCHE

Age 65+
General NYC resident, own and live in a 1-3 family home, co-op, or condo.
Income Limits (2025) $58,399/year household
Asset Limits No strict asset cap, income-driven eligibility.
NY

Applies only in NYC; excludes large apartment buildings.

Benefits
Property tax reduction (5-50%, e.g., $500-$5,000/year based on income and property value)

New York Foundation for Senior Citizens (NYFSC) Home Sharing Program

NYFSC Home Sharing

Age One participant must be 60+ (host or guest)
General NYC resident, able to share living space.
Income Limits No strict limit, but targets those needing cost relief.
Asset Limits Not applicable; focus on housing need.
NY

Primarily NYC-focused; limited slots due to demand.

Benefits
Shared housing (reduces rent/living costs by 30-50%, e.g., $500-$1,000/month savings); optional light assistance between housemates

Frequently Asked Questions about Manor Hills

What neighborhood is Manor Hills in?

Manor Hills is in the Wellsville neighborhood of Wellsville.

Who is the owner of Manor Hills?

The legal owner and operator of Manor Hills is Willow Ridge Senior Living, LLC.

Is Manor Hills in a walkable area?

Manor Hills has a walk score of 47. Somewhat walkable. A few nearby services may be reachable on foot, but most trips require transportation.

How many beds does Manor Hills have?

Manor Hills has 137 beds.

Are there photos of Manor Hills?

Yes — there are 6 photos of Manor Hills in the photo gallery on this page.

What is the address of Manor Hills?

Manor Hills is located at 4192-B Bolivar Road, Wellsville, NY 14895.

What is the phone number of Manor Hills?

(518) 621-7309 will put you in contact with the team at Manor Hills.

Guides for Better Senior Living

Care Cost Calculator: See Prices in Your Area

Nursing Home Data Explorer

Don’t Wait Too Long: 7 Red Flag Signs Your Parent Needs Assisted Living Now

The True Cost of Assisted Living in 2025 – And How Families Are Paying For It

Understanding Senior Living Costs: Pricing Models, Discounts & Financial Assistance

Explore Open Rooms
1 Contact details
2 What type of senior care service are you looking for?
3 What budget do you have in mind for senior care?
4 How soon do you need to find care?
5 Additional details

Thank you for your interest!

Our team will be in touch shortly to help with next steps.