


Miracle Manor Assisted Living

Miracle Manor Assisted Living
Overview of Miracle Manor Assisted Living
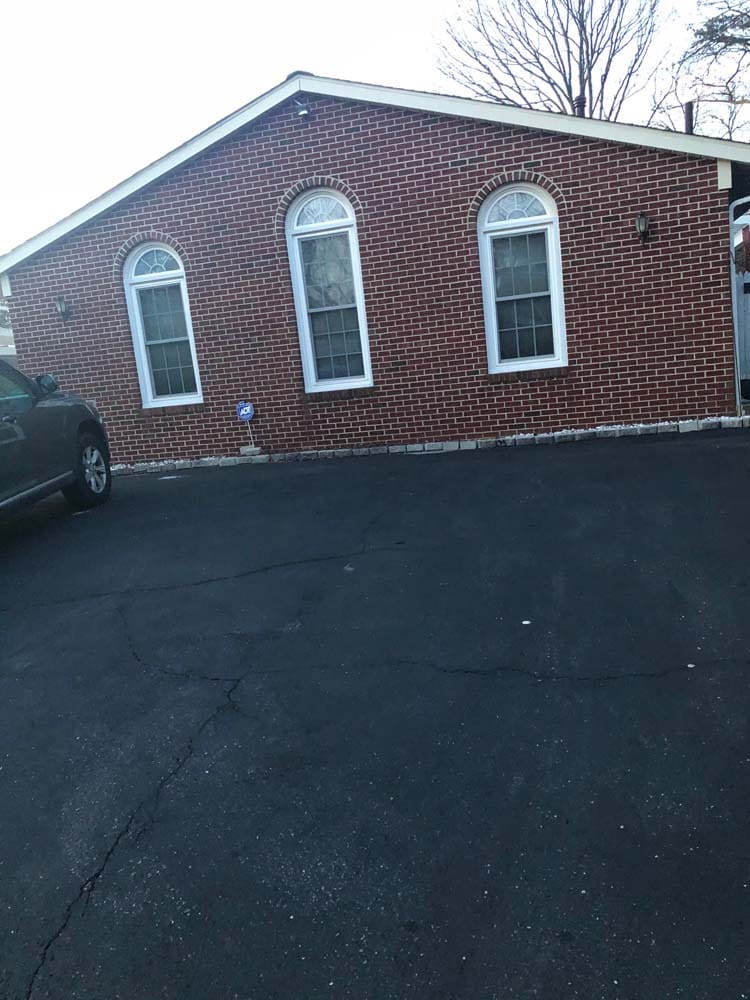
Miracle Manor Assisted Living is an assisted living community that offers exceptional care nestled within a welcoming and cozy residence. Positioned in a tranquil residential neighborhood in Rockville, Maryland, Miracle Manor offers both comfort and convenience, being conveniently close to the Shady Grove Metro, shopping options, and dining establishments. With ownership overseen by a dedicated Registered Nurse boasting over 17 years of nursing expertise, cherished seniors will experience top-notch care within a nurturing home-like ambiance.
At Miracle Manor, the transition into new life stages is met with ease. Their all-inclusive assisted living monthly fees encompass comprehensive daily care, ensuring that every resident’s needs are met. Owned and operated by a Registered Nurse with extensive experience, Miracle Manor’s residents enjoy around-the-clock, comprehensive care in a delightful residential setting situated within a charming residential area.
6-bed community Rank #410 / 697Bed count — State benchmarkedThis home is ranked 410th out of 697 homes in Maryland for bed count. Shows this facility's certified or reported bed count compared to other Maryland SNFs. Larger communities may offer more amenities, programs, and on-site services for residents and families.Click the rank badge to see the full State ranking.Click here to see the full State ranking.
A smaller, more intimate setting that may offer a quieter environment and closer staff-resident interactions.
Walk Score: 23 / 100 Rank #704 / 985Walk Score — State benchmarkedThis home is ranked 704th out of 985 homes in Maryland for walk score. Shows how walkable this facility's neighborhood is compared to the average Walk Score across Maryland SNFs. Higher scores benefit residents, families, and staff.Click the rank badge to see the full State ranking.Click here to see the full State ranking.
Car-dependent. Most errands require a car, with limited nearby walkable options.
About this community
Facility TypeAl
CountyAnne Arundel
License Number4599
State License TypesLicensed by MD Dept of Health, OHCQ
Staffing
Key information about the people who lead and staff this community.
No CNA training program
24-Hour Staffing
No mild Alzheimer's level
No moderate Alzheimer's level
No severe Alzheimer's level
Home Care
Transportation
Housekeeping
Laundry
Personal Care
Specific ProgramsWhy Us, All Services, Care Services, Senior Care, Companion Care, Residential Service Agency In Home Care, Other Services, Healthcare Consulting
Touring HoursMon - Friday 9:00 am - 4:00 pm; Mon - Friday 9:00 am - 4:00 pm; Mon - Friday 9:00 am - 4:00 pm; Mon - Friday 9:00 am - 4:00 pm; Mon - Friday 9:00 am - 4:00 pm
Food DescriptionResidents receive homemade meals and snacks as part of the comprehensive care services.
What does this home offer?
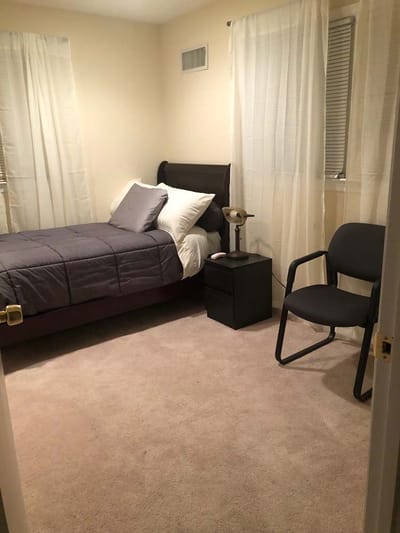
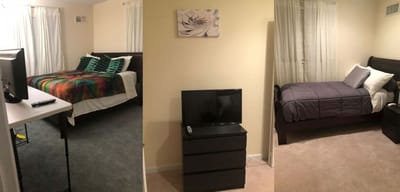
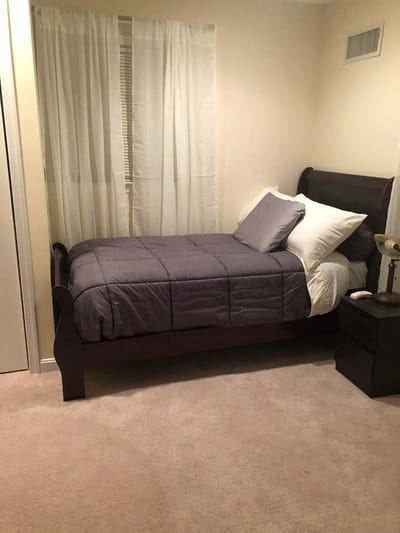
Housing Options: Private Rooms / Semi-Private Rooms
Building Type: Single-story
Transportation Services
Fitness and Recreation
Places of interest near Miracle Manor Assisted Living
![]() 5.1 miles from city center
5.1 miles from city center
![]() Estimated distance in miles from Rockville's city center to Miracle Manor Assisted Living's address, calculated via Google Maps.
— 3.87 miles to nearest hospital (Adventist HealthCare Shady Grove Medical Center)
Estimated distance in miles from Rockville's city center to Miracle Manor Assisted Living's address, calculated via Google Maps.
— 3.87 miles to nearest hospital (Adventist HealthCare Shady Grove Medical Center)
Calculate Travel Distance to Miracle Manor Assisted Living
Add your location
Financial Assistance for
Assisted Living in Maryland
Miracle Manor Assisted Living is located in Rockville, Maryland.
Here are the financial assistance programs available to residents in Maryland.
Compare Assisted Living around Rockville
The information below is reported by the Maryland Department of Health, Office of Health Care Quality.
Filter by care type
| The Seneca Rockville |
AL Assisted Living A licensed, long-term care setting for seniors or individuals with disabilities who need help with daily activities — like bathing, dressing, and medication management — but not 24-hour skilled nursing. Offers housing, meals, and around-the-clock support while aiming to maximize resident independence. | Rockville (King Farm) | 156
Facility
156
MD AVG
44
Rank
#39 / 697 | Yes |
45
Facility
45
MD AVG
43
Rank
#475 / 985 | Private Rooms / Semi-Private Rooms | 4
Facility
4
MD AVG
21
Rank
#191 / 208 | - |
32% Male Residents — State Benchmarked 32% of residents are male, compared to the Maryland average of 31%. This facility caters to a majority female resident pool (68% female), consistent with the broader assisted living trend where women significantly outnumber men. |
68% Female Residents — State Benchmarked 68% of residents are female, compared to the Maryland average of 69%. Women comprise the large majority, consistent with national assisted living demographics where women live longer and enter care facilities at higher rates. |
87% White Residents — State Benchmarked 87% of residents are reported as White, compared to the Maryland average of 81%. Close to the average for this category among assisted living facilities in Maryland with reported race/ethnicity data. |
2% African American Residents — State Benchmarked 2% of residents are reported as African American or Black, compared to the Maryland average of 13%. A lower African American share than is typical in Maryland; local markets still vary widely. |
11% Other Ethnicity Residents — State Benchmarked 11% of residents fall into categories other than White or African American (combined), compared to the Maryland average of 6%. This column aggregates Hispanic, Asian, multiracial, and any other labeled groups that are not classified as White or African American. Reported subgroups in this total: Asian (10%), Hispanic (2%). |
8% Residents Age 65–74 — State Benchmarked 8% of residents are 65–74, compared to the Maryland average of 13%. Fewer younger seniors suggests the resident population skews older, likely requiring higher acuity care and more hands-on support. |
34% Residents Age 75–84 — State Benchmarked 34% of residents are 75–84, compared to the Maryland average of 31%. This is the second most common age bracket in assisted living, representing residents with moderate care needs. |
45% Residents Age 85–94 — State Benchmarked 45% of residents are 85–94, compared to the Maryland average of 44%. This is typically the most common age bracket in assisted living — this facility is in line with the statewide norm. |
13% Residents Age 95+ — State Benchmarked 13% of residents are 95 or older, compared to the Maryland average of 16%. In line with the statewide profile for the oldest resident bracket. |
| Brightview West End |
AL Assisted Living A licensed, long-term care setting for seniors or individuals with disabilities who need help with daily activities — like bathing, dressing, and medication management — but not 24-hour skilled nursing. Offers housing, meals, and around-the-clock support while aiming to maximize resident independence.
IL Independent Living Lifestyle-focused communities for older adults offering dining, activities, and transportation with minimal personal care. Best for active, independent seniors who want community without medical support.
MC Memory Care Secured, specialized care for people living with Alzheimer's or dementia. Staff trained in cognitive impairment, with higher staff-to-resident ratios and an environment designed to reduce confusion and wandering risk. | Rockville | 98
Facility
98
MD AVG
44
Rank
#138 / 697 | Yes |
89
Facility
89
MD AVG
43
Rank
#32 / 985 | Private Rooms / Semi-Private Rooms | 8
Facility
8
MD AVG
21
Rank
#162 / 208 | - |
32% Male Residents — State Benchmarked 32% of residents are male, compared to the Maryland average of 31%. This facility caters to a majority female resident pool (68% female), consistent with the broader assisted living trend where women significantly outnumber men. |
68% Female Residents — State Benchmarked 68% of residents are female, compared to the Maryland average of 69%. Women comprise the large majority, consistent with national assisted living demographics where women live longer and enter care facilities at higher rates. |
84% White Residents — State Benchmarked 84% of residents are reported as White, compared to the Maryland average of 81%. Close to the average for this category among assisted living facilities in Maryland with reported race/ethnicity data. |
4% African American Residents — State Benchmarked 4% of residents are reported as African American or Black, compared to the Maryland average of 13%. A lower African American share than is typical in Maryland; local markets still vary widely. |
12% Other Ethnicity Residents — State Benchmarked 12% of residents fall into categories other than White or African American (combined), compared to the Maryland average of 6%. This column aggregates Hispanic, Asian, multiracial, and any other labeled groups that are not classified as White or African American. Reported subgroups in this total: Other (5%), Asian (4%), Mixed Race (4%). |
14% Residents Age 65–74 — State Benchmarked 14% of residents are 65–74, compared to the Maryland average of 13%. In line with the statewide profile for this youngest senior bracket in assisted living. |
37% Residents Age 75–84 — State Benchmarked 37% of residents are 75–84, compared to the Maryland average of 31%. A high concentration in this mid-range bracket, where residents typically need moderate support with daily activities. |
33% Residents Age 85–94 — State Benchmarked 33% of residents are 85–94, compared to the Maryland average of 44%. The population here skews younger than the statewide norm, which may indicate a more active, lower-acuity community. |
16% Residents Age 95+ — State Benchmarked 16% of residents are 95 or older, compared to the Maryland average of 16%. In line with the statewide profile for the oldest resident bracket. |
| Landow House |
AL Assisted Living A licensed, long-term care setting for seniors or individuals with disabilities who need help with daily activities — like bathing, dressing, and medication management — but not 24-hour skilled nursing. Offers housing, meals, and around-the-clock support while aiming to maximize resident independence.
IL Independent Living Lifestyle-focused communities for older adults offering dining, activities, and transportation with minimal personal care. Best for active, independent seniors who want community without medical support. | Rockville (Rollins Park) | 98
Facility
98
MD AVG
44
Rank
#138 / 697 | Yes |
59
Facility
59
MD AVG
43
Rank
#327 / 985 | Private Rooms / Semi-Private Rooms | 31
Facility
31
MD AVG
21
Rank
#38 / 208 | - |
31% Male Residents — State Benchmarked 31% of residents are male, compared to the Maryland average of 31%. This facility caters to a majority female resident pool (69% female), consistent with the broader assisted living trend where women significantly outnumber men. |
69% Female Residents — State Benchmarked 69% of residents are female, compared to the Maryland average of 69%. Women comprise the large majority, consistent with national assisted living demographics where women live longer and enter care facilities at higher rates. |
99% White Residents — State Benchmarked 99% of residents are reported as White, compared to the Maryland average of 81%. A higher White share than is typical for assisted living in Maryland in this dataset — compare with peer facilities for local context. |
0% African American Residents — State Benchmarked 0% of residents are reported as African American or Black, compared to the Maryland average of 13%. A lower African American share than is typical in Maryland; local markets still vary widely. |
1% Other Ethnicity Residents — State Benchmarked 1% of residents fall into categories other than White or African American (combined), compared to the Maryland average of 6%. This column aggregates Hispanic, Asian, multiracial, and any other labeled groups that are not classified as White or African American. Reported subgroups in this total: Asian (1%). |
7% Residents Age 65–74 — State Benchmarked 7% of residents are 65–74, compared to the Maryland average of 13%. Fewer younger seniors suggests the resident population skews older, likely requiring higher acuity care and more hands-on support. |
20% Residents Age 75–84 — State Benchmarked 20% of residents are 75–84, compared to the Maryland average of 31%. Below the state norm — the resident mix may skew either younger or older than this typical middle bracket. |
49% Residents Age 85–94 — State Benchmarked 49% of residents are 85–94, compared to the Maryland average of 44%. A high concentration of very elderly residents signals a higher-acuity facility with experience caring for advanced age-related needs. |
24% Residents Age 95+ — State Benchmarked 24% of residents are 95 or older, compared to the Maryland average of 16%. A high proportion of the oldest-old suggests strong end-of-life care experience and very-high-acuity capabilities. |
| Sunrise of Rockville |
AL Assisted Living A licensed, long-term care setting for seniors or individuals with disabilities who need help with daily activities — like bathing, dressing, and medication management — but not 24-hour skilled nursing. Offers housing, meals, and around-the-clock support while aiming to maximize resident independence. | Rockville (Baltimore Road) | 89
Facility
89
MD AVG
44
Rank
#165 / 697 | Yes |
89
Facility
89
MD AVG
43
Rank
#32 / 985 | Private Rooms / Semi-Private Rooms | 45
Facility
45
MD AVG
21
Rank
#4 / 208 | A- |
23% Male Residents — State Benchmarked 23% of residents are male, compared to the Maryland average of 31%. This facility caters to a majority female resident pool (77% female), consistent with the broader assisted living trend where women significantly outnumber men. |
77% Female Residents — State Benchmarked 77% of residents are female, compared to the Maryland average of 69%. Women comprise the large majority, consistent with national assisted living demographics where women live longer and enter care facilities at higher rates. |
87% White Residents — State Benchmarked 87% of residents are reported as White, compared to the Maryland average of 81%. Close to the average for this category among assisted living facilities in Maryland with reported race/ethnicity data. |
2% African American Residents — State Benchmarked 2% of residents are reported as African American or Black, compared to the Maryland average of 13%. A lower African American share than is typical in Maryland; local markets still vary widely. |
11% Other Ethnicity Residents — State Benchmarked 11% of residents fall into categories other than White or African American (combined), compared to the Maryland average of 6%. This column aggregates Hispanic, Asian, multiracial, and any other labeled groups that are not classified as White or African American. Reported subgroups in this total: Mixed Race (6%), Hispanic (3%), Asian (2%). |
3% Residents Age 65–74 — State Benchmarked 3% of residents are 65–74, compared to the Maryland average of 13%. Fewer younger seniors suggests the resident population skews older, likely requiring higher acuity care and more hands-on support. |
31% Residents Age 75–84 — State Benchmarked 31% of residents are 75–84, compared to the Maryland average of 31%. This is the second most common age bracket in assisted living, representing residents with moderate care needs. |
56% Residents Age 85–94 — State Benchmarked 56% of residents are 85–94, compared to the Maryland average of 44%. A high concentration of very elderly residents signals a higher-acuity facility with experience caring for advanced age-related needs. |
10% Residents Age 95+ — State Benchmarked 10% of residents are 95 or older, compared to the Maryland average of 16%. Most residents here have not yet reached the oldest-old bracket, suggesting a younger overall community. |
| Miracle Manor Assisted Living |
AL Assisted Living A licensed, long-term care setting for seniors or individuals with disabilities who need help with daily activities — like bathing, dressing, and medication management — but not 24-hour skilled nursing. Offers housing, meals, and around-the-clock support while aiming to maximize resident independence. | Rockville | 6
Facility
6
MD AVG
44
Rank
#410 / 697 | No |
23
Facility
23
MD AVG
43
Rank
#704 / 985 | Private Rooms / Semi-Private Rooms | - | - | - | - | - | - | - | - | - | - | - |
Frequently Asked Questions about Miracle Manor Assisted Living
Is Miracle Manor Assisted Living in a walkable area?
Miracle Manor Assisted Living has a walk score of 23. Car-dependent. Most errands require a car, with limited nearby walkable options.
How many beds does Miracle Manor Assisted Living have?
Miracle Manor Assisted Living has 6 beds.
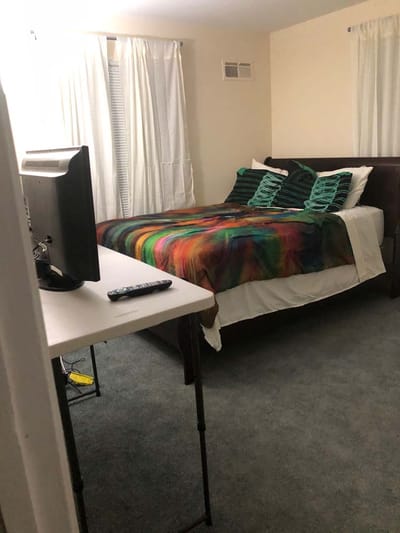
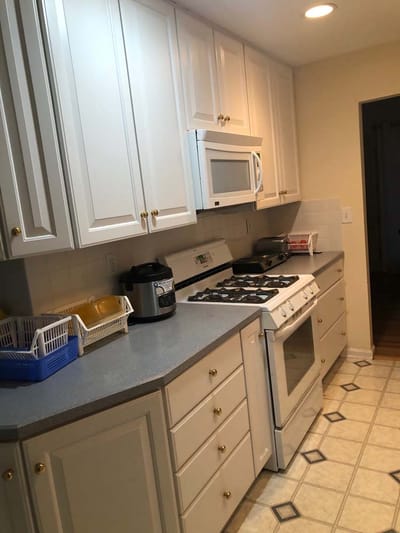
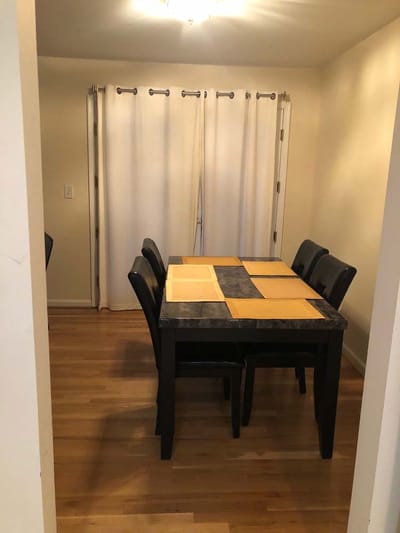
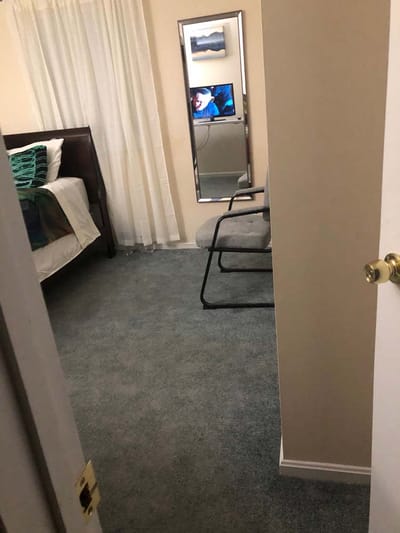
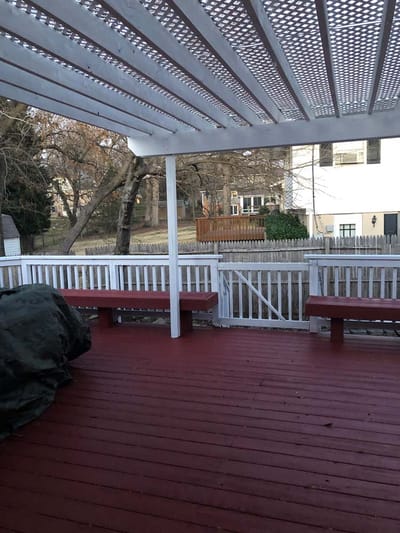
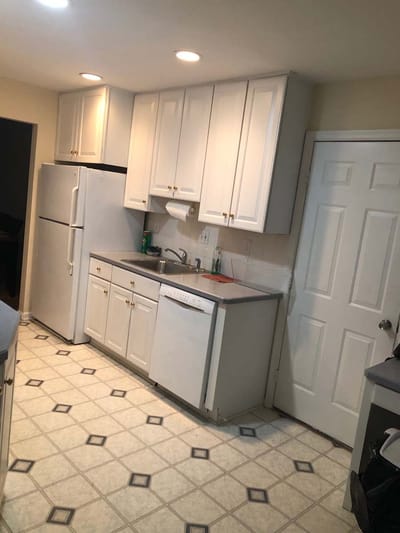
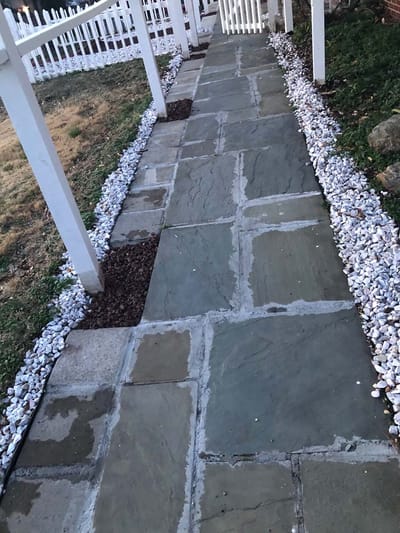
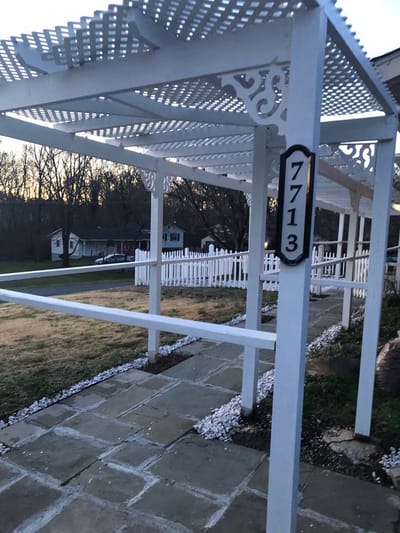
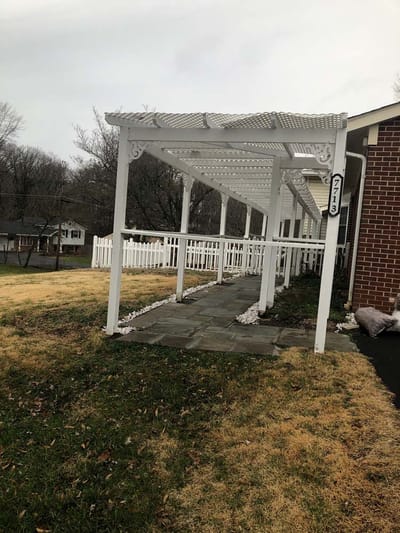
Are there photos of Miracle Manor Assisted Living?
Yes — there are 14 photos of Miracle Manor Assisted Living in the photo gallery on this page.
What is the phone number of Miracle Manor Assisted Living?
(301) 535-9488 will put you in contact with the team at Miracle Manor Assisted Living.
What county is Miracle Manor Assisted Living located in?
Miracle Manor Assisted Living is in Anne Arundel County.
Is Miracle Manor Assisted Living Medicare or Medicaid certified?
Miracle Manor Assisted Living is not currently listed as a CMS-certified provider of Medicare or Medicaid.
Guides for Better Senior Living
Care Cost Calculator: See Prices in Your Area
Nursing Home Data Explorer
Don’t Wait Too Long: 7 Red Flag Signs Your Parent Needs Assisted Living Now
The True Cost of Assisted Living in 2025 – And How Families Are Paying For It
Understanding Senior Living Costs: Pricing Models, Discounts & Financial Assistance
Contact Us

Published on
Updated on
Feedback
Write a review for Miracle Manor Assisted Living
Rate your overall experience with this community
Explore Open Rooms
1
Contact details
2
What type of senior care service are you looking for?
3
What budget do you have in mind for senior care?
4
How soon do you need to find care?
5
Additional details
Thank you for your interest!
Our team will be in touch shortly to help with next steps.
Need Help?
Let us help you or a loved one find the perfect senior home.
