


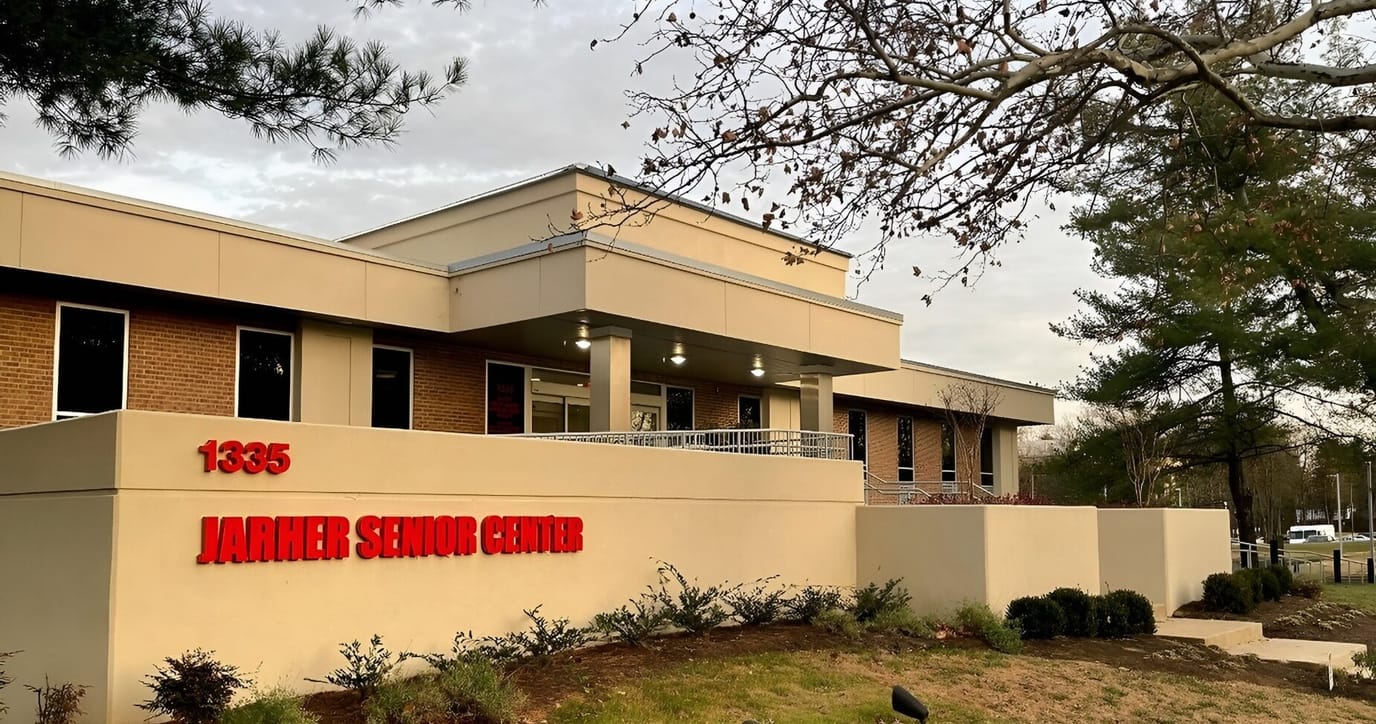
Jarher Senior Center
Assisted Living, Adult Day Care, Memory Care & Respite Care · Rockville, MD

Jarher Senior Center
Assisted Living, Adult Day Care, Memory Care & Respite Care · Rockville, MD
Jarher Senior Center is a senior care community in Rockville, MD, offering adult day care, assisted living, respite care and memory care. Promoting a nurturing and welcoming environment, the community ensures older adults are well-cared for. Recreational activities, assistance with daily living activities, and wellness programs are also available for residents’ social and physical wellness. The community also provides medical assistance, medical insurance, dental insurance, as well as food coupons, to ease financial burdens.
Dance, Tai Chi, planting, and handicrafts are just some of the recreational opportunities that older adults can participate in. The community also offers acupuncture, as well as physical therapy and massage for older adults’ welfare. Located in the lively neighborhood of Rockville, the community guarantees accessibility and convenience. This senior care community in Maryland a great option for older adults seeking to maintain independence in their later years.
38-bed community Rank #229 / 685Bed count — State benchmarkedThis home is ranked 229th out of 685 homes in Maryland for bed count. Shows this facility's certified or reported bed count compared to other Maryland facilities. Larger communities may offer more amenities, programs, and on-site services for residents and families.Facilities with the same value for a metric share the same rank. Rankings are based only on facilities in Maryland that report data for that category. Facilities without available data are excluded from the ranking.Click the rank badge to see the full State ranking.Click here to see the full State ranking.
A moderately sized community that may balance personal attention with shared amenities and social activities.
5 years in operation Rank #183 / 210Years in operation — State benchmarkedThis home is ranked 183rd out of 210 homes in Maryland for years in operation. Shows how long this facility has been in operation compared to other Maryland facilities. Longer operating histories may benefit residents, families, and staff.Facilities with the same value for a metric share the same rank. Rankings are based only on facilities in Maryland that report data for that category. Facilities without available data are excluded from the ranking.Click the rank badge to see the full State ranking.Click here to see the full State ranking.
An established community with some operational experience and growing routines.
Walk Score: 36 / 100 Rank #563 / 985Walk Score — State benchmarkedThis home is ranked 563rd out of 985 homes in Maryland for walk score. Shows how walkable this facility's neighborhood is compared to the average walk score across Maryland facilities. Higher scores benefit residents, families, and staff.Facilities with the same value for a metric share the same rank. Rankings are based only on facilities in Maryland that report data for that category. Facilities without available data are excluded from the ranking.Click the rank badge to see the full State ranking.Click here to see the full State ranking.
Somewhat walkable. A few nearby services may be reachable on foot, but most trips require transportation.
What does this home offer?
No pets allowed
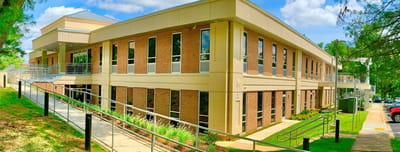
Building Type: 2-story
Social and Recreational Activities
Exercise Programs
Rehabilitative Support
Personal Care Assistance
Places of interest near Jarher Senior Center
![]() 2.0 miles from city center
2.0 miles from city center
![]() Estimated distance in miles from Rockville's city center to Jarher Senior Center's address, calculated via Google Maps.
Estimated distance in miles from Rockville's city center to Jarher Senior Center's address, calculated via Google Maps.
Calculate Travel Distance to Jarher Senior Center
Add your location
Compare Assisted Living around Rockville
The information below is reported by the Maryland Department of Health, Office of Health Care Quality.
| Revitz House | AL HC IL MC NH SNF | Rockville | 558
Facility
558
MD AVG
42
Rank
#1 / 685 | Yes |
81
Facility
81
MD AVG
43
Rank
#86 / 985 | 1 Bed | - | - | - | - | - | - | - | - | - | - | - |
| Landow House | AL HC IL MC NH SNF | Rockville (Rollins Park) | 98
Facility
98
MD AVG
42
Rank
#126 / 685 | Yes |
59
Facility
59
MD AVG
43
Rank
#327 / 985 | 1 Bed / 2 Bed | 31
Facility
31
MD AVG
20
Rank
#37 / 210 | - |
31% Male Residents — State Benchmarked 31% of residents are male, compared to the Maryland average of 31%. This facility caters to a majority female resident pool (69% female), consistent with the broader assisted living trend where women significantly outnumber men. |
69% Female Residents — State Benchmarked 69% of residents are female, compared to the Maryland average of 69%. Women comprise the large majority, consistent with national assisted living demographics where women live longer and enter care facilities at higher rates. |
99% White Residents — State Benchmarked 99% of residents are reported as White, compared to the Maryland average of 81%. A higher White share than is typical for assisted living in Maryland in this dataset — compare with peer facilities for local context. |
0% African American Residents — State Benchmarked 0% of residents are reported as African American or Black, compared to the Maryland average of 13%. A lower African American share than is typical in Maryland; local markets still vary widely. |
1% Other Ethnicity Residents — State Benchmarked 1% of residents fall into categories other than White or African American (combined), compared to the Maryland average of 6%. This column aggregates Hispanic, Asian, multiracial, and any other labeled groups that are not classified as White or African American. Reported subgroups in this total: Asian (1%). |
7% Residents Age 65–74 — State Benchmarked 7% of residents are 65–74, compared to the Maryland average of 13%. Fewer younger seniors suggests the resident population skews older, likely requiring higher acuity care and more hands-on support. |
20% Residents Age 75–84 — State Benchmarked 20% of residents are 75–84, compared to the Maryland average of 31%. Below the state norm — the resident mix may skew either younger or older than this typical middle bracket. |
49% Residents Age 85–94 — State Benchmarked 49% of residents are 85–94, compared to the Maryland average of 44%. A high concentration of very elderly residents signals a higher-acuity facility with experience caring for advanced age-related needs. |
24% Residents Age 95+ — State Benchmarked 24% of residents are 95 or older, compared to the Maryland average of 16%. A high proportion of the oldest-old suggests strong end-of-life care experience and very-high-acuity capabilities. |
| Sunrise of Rockville | AL HOS MC | Rockville (Baltimore Road) | 89
Facility
89
MD AVG
42
Rank
#150 / 685 | Yes |
89
Facility
89
MD AVG
43
Rank
#32 / 985 | Studio / 1 Bed / 2 Bed | 45
Facility
45
MD AVG
20
Rank
#3 / 210 | A- |
23% Male Residents — State Benchmarked 23% of residents are male, compared to the Maryland average of 31%. This facility caters to a majority female resident pool (77% female), consistent with the broader assisted living trend where women significantly outnumber men. |
77% Female Residents — State Benchmarked 77% of residents are female, compared to the Maryland average of 69%. Women comprise the large majority, consistent with national assisted living demographics where women live longer and enter care facilities at higher rates. |
87% White Residents — State Benchmarked 87% of residents are reported as White, compared to the Maryland average of 81%. Close to the average for this category among assisted living facilities in Maryland with reported race/ethnicity data. |
2% African American Residents — State Benchmarked 2% of residents are reported as African American or Black, compared to the Maryland average of 13%. A lower African American share than is typical in Maryland; local markets still vary widely. |
11% Other Ethnicity Residents — State Benchmarked 11% of residents fall into categories other than White or African American (combined), compared to the Maryland average of 6%. This column aggregates Hispanic, Asian, multiracial, and any other labeled groups that are not classified as White or African American. Reported subgroups in this total: Mixed Race (6%), Hispanic (3%), Asian (2%). |
3% Residents Age 65–74 — State Benchmarked 3% of residents are 65–74, compared to the Maryland average of 13%. Fewer younger seniors suggests the resident population skews older, likely requiring higher acuity care and more hands-on support. |
31% Residents Age 75–84 — State Benchmarked 31% of residents are 75–84, compared to the Maryland average of 31%. This is the second most common age bracket in assisted living, representing residents with moderate care needs. |
56% Residents Age 85–94 — State Benchmarked 56% of residents are 85–94, compared to the Maryland average of 44%. A high concentration of very elderly residents signals a higher-acuity facility with experience caring for advanced age-related needs. |
10% Residents Age 95+ — State Benchmarked 10% of residents are 95 or older, compared to the Maryland average of 16%. Most residents here have not yet reached the oldest-old bracket, suggesting a younger overall community. |
| Ingleside at King Farm | AL IL MC NH SNF | Rockville (King Farm) | 45
Facility
45
MD AVG
42
Rank
#219 / 685 | Yes |
73
Facility
73
MD AVG
43
Rank
#152 / 985 | 1 Bed / 2 Bed | - | - | - | - | - | - | - | - | - | - | - |
| Jarher Senior Center | AL ADC MC RC | Rockville | 38
Facility
38
MD AVG
42
Rank
#229 / 685 | No |
36
Facility
36
MD AVG
43
Rank
#563 / 985 | - | 5
Facility
5
MD AVG
20
Rank
#183 / 210 | - | - | - | - | - | - | - | - | - | - |
Financial Assistance for
Assisted Living in Maryland
Jarher Senior Center is located in Rockville, Maryland.
Here are the financial assistance programs available to residents in Maryland.
Frequently Asked Questions about Jarher Senior Center
Is Jarher Senior Center in a walkable area?
Jarher Senior Center has a walk score of 36. Somewhat walkable. A few nearby services may be reachable on foot, but most trips require transportation.
How long has Jarher Senior Center been in business?
Jarher Senior Center has been operating for approximately 5 years, based on available licensing and registration records.
Are pets allowed at Jarher Senior Center?
No, Jarher Senior Center has a no-pet policy.
What is the best email address for Jarher Senior Center?
The team at Jarher Senior Center can be reached at info@jarherseniorcenter.com.
Are there photos of Jarher Senior Center?
Yes — there are 6 photos of Jarher Senior Center in the photo gallery on this page.
What is the address of Jarher Senior Center?
Jarher Senior Center is located at 1335 Piccard Dr, Rockville, MD 20850.
What is the phone number of Jarher Senior Center?
(301) 825-9920 will put you in contact with the team at Jarher Senior Center.
Guides for Better Senior Living
Care Cost Calculator: See Prices in Your Area
Assisted Living Explorer
Don’t Wait Too Long: 7 Red Flag Signs Your Parent Needs Assisted Living Now
The True Cost of Assisted Living in 2025 – And How Families Are Paying For It
Understanding Senior Living Costs: Pricing Models, Discounts & Financial Assistance
Updated on
