Mirador Retirement Community
Nursing Home, Assisted Living, Independent Living, Memory Care & Nursing Care · Texas, TX
CMS overall rating Info CMS (the Centers for Medicare & Medicaid Services) is the federal agency that rates nursing home quality. Its Overall Rating runs from 1 to 5 stars, combining health inspections, staffing, and quality measures, with inspections weighted most heavily.

Mirador Retirement Community

Nursing Home, Assisted Living, Independent Living, Memory Care & Nursing Care · Texas, TX
CMS overall rating Info CMS (the Centers for Medicare & Medicaid Services) is the federal agency that rates nursing home quality. Its Overall Rating runs from 1 to 5 stars, combining health inspections, staffing, and quality measures, with inspections weighted most heavily.
Calculator: See prices in your area
Mirador Retirement Community accepts Medicare and private pay.

Overview of Mirador Retirement Community

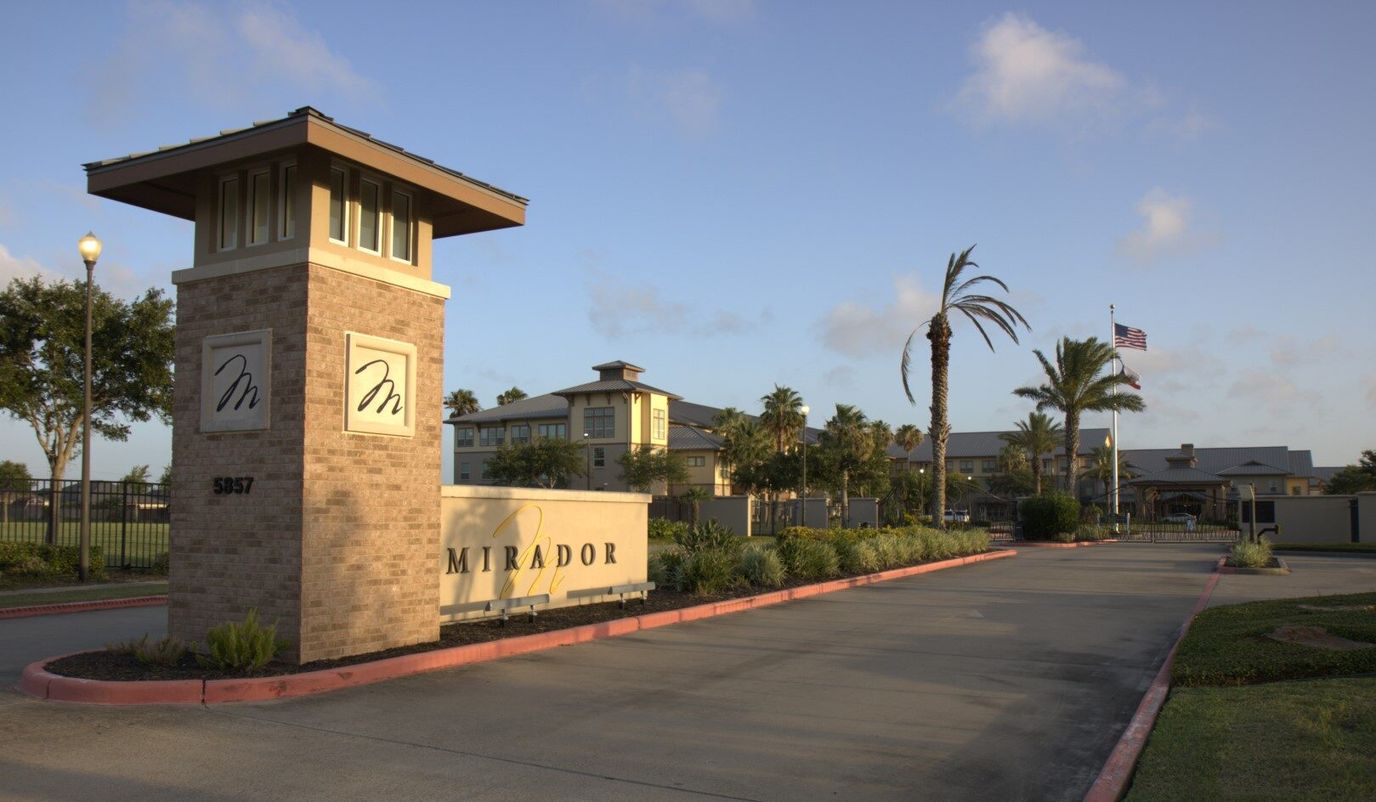
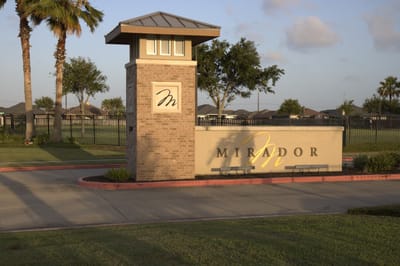
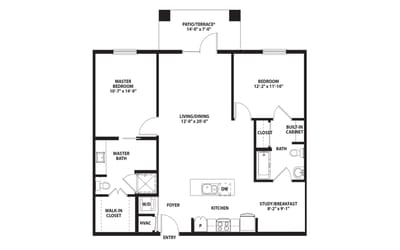
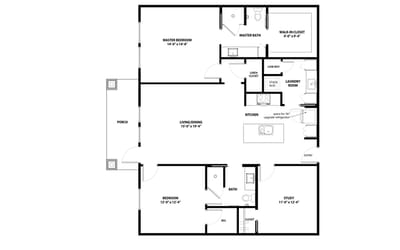
Mirador Retirement Community is a non-profit senior living community in Nueces County, Corpus Christi, TX, offering vibrant independent living experience. Enjoy a precious time alone in comfortably designed accommodations in variations of one-bedroom and two-bedroom floor plans. Residents can look forward to 24/7 assistance response and the convenience of housekeeping, dry cleaning, maintenance, and transportation services.

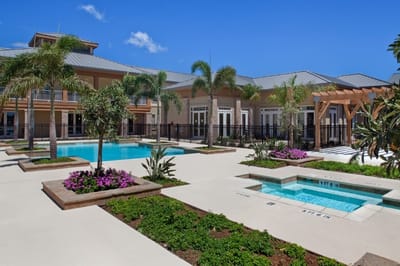
Dedicated to providing residents with plenty of meaningful experiences and opportunities to socialize and learn new things, the community provides a full-time lifestyle director that carefully curates community activities, events, and programs. Residents can freely participate in the activity of their choosing, including fitness classes, lectures, bible studies, musical performances, or outdoor gardening. With most of the chores handled, residents have a lot of free time to spend on their enjoyment and well-being, enabling them to live a more full and meaningful life.

(361) 994-0905

Quality ratings

Measured by Centers for Medicare & Medicaid Services (CMS)

Overall rating Info The Overall CMS Rating combines results from health inspections, staffing levels and quality measures. Health inspections carry the most weight. Staffing and quality scores can increase or decrease the final rating based on performance compared to state and national standards.
▲ 43.1% Above TX avg. ▲ 43.1% Above TX avg.TX average: 2.8Click the badge to see the full State ranking.Click here to see the full State ranking.
Health Inspection Info Based on the results of the facility's three most recent standard inspections and any complaint investigations. CMS reviews the number, scope, and severity of deficiencies, with more recent findings weighted more heavily.
▲ 44.7% Above TX avg. ▲ 44.7% Above TX avg.TX average: 2.8Click the badge to see the full State ranking.Click here to see the full State ranking.
Staffing Info Measures average nursing staff hours per resident per day, including Registered Nurses (RNs) and total nursing staff. Ratings are adjusted based on the level of care residents require and are compared to state and national benchmarks.
▲ 88.5% Above TX avg. ▲ 88.5% Above TX avg.TX average: 2.1Click the badge to see the full State ranking.Click here to see the full State ranking.
Quality Measures Info Based on clinical and physical health indicators reported to CMS, such as hospital readmissions, falls, pressure ulcers, and improvements in mobility. These measures reflect how well residents' health needs are being managed.
▲ 6.5% Above TX avg. ▲ 6.5% Above TX avg.TX average: 3.8Click the badge to see the full State ranking.Click here to see the full State ranking.

Staffing hours breakdown

Info Daily nursing hours per resident by staff type, reported to CMS. Higher is generally better — compare this facility to state and national averages to see where staffing stands.

Hours per resident per day — compared to Texas state averages

Total nursing care / resident Info This home is ranked 26th out of 296 homes in Texas for nurse hours. Total adjusted nursing hours per resident per day, combining RN, LPN, and aide time. CMS adjusts this for case-mix so facilities can be fairly compared.
4h 48m per day
Rank #26 / 296Nurse hours — State benchmarkedThis home is ranked 26th out of 296 homes in Texas. Shows adjusted nurse hours per resident per day benchmarked to the Texas average, with a ranking across 296 Texas facilities. More hours mean more direct care. The national average is about 3.5 hrs; below 3.0 is a red flag.Ranking totals vary by category as each rank only includes facilities that report data for that metric. Homes missing that data point aren't included in the ranking.Click the rank badge to see the full State ranking.Click here to see the full State ranking.
This facility Texas avg (3h 38m per day)
vs Texas avg
+32%

2 of 6 metrics below state avg

Standout metric LPN / LVN is +52% above state avg
Staff typeHours / Day / Residentvs state avg
Registered Nurse (RN) Info RNs hold the highest nursing license and can assess residents, interpret test results, and direct care plans. More RN hours per day often signals stronger clinical oversight and faster response to health changes. 36m per day ▲ 41% State avg: 25m per day · National avg: 41m per day
LPN / LVN Info Licensed Practical Nurses (LPNs) or Licensed Vocational Nurses (LVNs) deliver routine hands-on care — medication administration, wound dressing, and monitoring vital signs. They work under RN supervision and make up a large share of daily bedside care. 1h 27m per day ▲ 52% State avg: 57m per day · National avg: 52m per day
Nurse Aide Info Certified Nurse Aides (CNAs) provide the most direct day-to-day assistance: bathing, dressing, feeding, and mobility. Nurse aide hours are typically the largest staffing category and directly affect residents' quality of life. 2h 47m per day ▲ 38% State avg: 2h 1m per day · National avg: 2h 20m per day
Weekend Total Nursing Info Combined nursing hours (RN + LPN + Nurse Aide) per resident per day on weekends. Staffing often drops on weekends — this figure reveals whether the facility maintains adequate coverage outside of weekday hours. 4h 6m per day ▲ 36% State avg: 3h 0m per day · National avg: 3h 27m per day
Physical Therapist Info Hours per resident per day provided by licensed Physical Therapists (PTs) or PT Assistants. PT services help residents recover mobility after injury or illness and are especially important for post-acute (short-stay) rehabilitation. 2m per day ▼ 58% State avg: 4m per day · National avg: 4m per day
Weekend RN Info Registered nurse hours specifically on weekends. Facilities sometimes reduce RN presence on Saturdays and Sundays — a low weekend RN figure compared to weekday hours can indicate reduced clinical oversight when most administrative staff are absent. 19m per day ▼ 4% State avg: 20m per day · National avg: 29m per day

Capacity and availability

Avg. Length of Stay
57 days
Bed community size
66-bed community Rank #547 / 988Bed count — State benchmarkedThis home is ranked 547th out of 988 homes in Texas. Shows this facility's certified or reported bed count compared to other Texas facilities. Larger communities may offer more amenities, programs, and on-site services for residents and families.Ranking totals vary by category as each rank only includes facilities that report data for that metric. Homes missing that data point aren't included in the ranking.Click the rank badge to see the full State ranking.Click here to see the full State ranking.
A moderately sized community that may balance personal attention with shared amenities and social activities.
Years in operation
14 years in operation Rank #323 / 583Years in operation — State benchmarkedThis home is ranked 323rd out of 583 homes in Texas. Shows how long this facility has been in operation compared to other Texas facilities. Longer operating histories may benefit residents, families, and staff.Ranking totals vary by category as each rank only includes facilities that report data for that metric. Homes missing that data point aren't included in the ranking.Click the rank badge to see the full State ranking.Click here to see the full State ranking.
A community with a solid operating history and experience delivering ongoing care.
Walk Score
Walk Score: 39 / 100 Rank #754 / 1391Walk Score — State benchmarkedThis home is ranked 754th out of 1391 homes in Texas. Shows how walkable this facility's neighborhood is compared to the average Walk Score across Texas facilities. Higher scores benefit residents, families, and staff.Ranking totals vary by category as each rank only includes facilities that report data for that metric. Homes missing that data point aren't included in the ranking.Click the rank badge to see the full State ranking.Click here to see the full State ranking.
Somewhat walkable. A few nearby services may be reachable on foot, but most trips require transportation.
BBB Rating
BBB Rating: A+ (Not Accredited)
An independent rating from the Better Business Bureau based on factors such as complaint history, transparency, and business practices.
How BBB ratings work

About this community

Occupancy

Occupancy rate
88%
Rank #25 / 304Occupancy rate — State benchmarkedThis home is ranked 25th out of 304 homes in Texas. Shows this facility's occupancy rate versus the Texas average, with its Statewide rank out of 304. Higher occupancy signals strong local demand and financial stability.Ranking totals vary by category as each rank only includes facilities that report data for that metric. Homes missing that data point aren't included in the ranking.Click the rank badge to see the full State ranking.Click here to see the full State ranking.
Higher than the Texas average: 63.5%
Occupied beds
58 / 66
Average occupied beds in Texas homes 75 beds

License Details

Facility TypeType B
StatusLicensed
ExpirationJanuary 5, 2028
CountyNueces
License Number307620
Year Opened12/29/2011
CMS Certification Number676303
QualificationNursing

Ownership & Operating Entity

Mirador Retirement Community is legally operated by Methodist Retirement Communities, and administrated by Deborah K Nugent.

OwnerMRC Senior Living Corpus Christi
Ownership TypeNonprofit Organization

Type Of Units

Alzheimer's Units
18 units
Total beds
66 units

Safety & Compliance

Emergency Systems24/7 emergency call-and-response system

Staffing

Key information about the people who lead and staff this community.

Leadership

ContactMr. Aaron Denovellis, Executive Director

Payment & Insurance

1 service
Accept Medicare

Therapy & Rehabilitation

2 services
Rehabilitation Services
Respite Care

Staffing & Medical

2 services
Doctor on Staff
24-Hour Staffing

Memory & Specialized Care

1 service
Alzheimer's Certification

Amenities & Lifestyle

Sparkling Pool
State-Of-The-Art Fitness Center
Chef-Prepared Meals
Specific ProgramsMemory Support

Dining & Nutrition

Food DescriptionChef-prepared menus offer a wide variety of choices in different dining areas, with meals prepared from scratch.
Meal Schedule3 meals a day, 7 days a week

Contact Mirador Retirement Community

Inspection History

In Texas, the Health and Human Services Commission (HHSC) is the primary regulatory body that conducts unannounced inspections and publishes quality reports for all long-term care homes.

Since 2024 · 2 years of data 4 citations 1 inspection

Inspection Scorecard Info This scorecard compares key inspection, citation, and complaint metrics at this facility against the Texas state average. Metrics rated ≥15% worse than average are highlighted in red; those ≥15% better are highlighted in green.

Since 2024 vs. Texas state average
Overall vs. TX average 0 Worse No metrics in this bucket. 2 At Avg Metrics at Texas average:
• Health citations (at TX avg)
• Inspections with citations (at TX avg)
3 Better Metrics better than Texas average:
• Total citations (33% below)
• Life safety citations (33% below)
• Citations per year (33% below)
Latest Inspection July 7, 2024 Other An inspection that falls outside standard annual surveys and formal complaint investigations. May include administrative compliance checks, documentation reviews, focused surveys on specific concerns, or revisit surveys to verify prior corrections.

Citations Info Citations are formal regulatory issues recorded during state inspections.

This FacilityTX Averagevs. TX Avg
Total citations Info Formal regulatory issues recorded by inspectors across all inspection types. 46 This facility has 33% fewer total citations than a typical Texas nursing home (4 vs. TX avg 6).↓ 33% better
Health citations Info Violations related to resident care, clinical practices, and day-to-day operations. 22 This facility has health citations in line with the Texas average (2 vs. TX avg 2).— At avg
Life safety citations Info Violations related to building safety — fire prevention, emergency egress, and similar. 46 This facility has 33% fewer life safety citations than a typical Texas nursing home (4 vs. TX avg 6).↓ 33% better
Citations per year Info Average citations per year since 2024. 23 This facility has 33% fewer citations per year than a typical Texas nursing home (2 vs. TX avg 3).↓ 33% better

Inspections Info State inspections evaluate whether the facility meets health and safety standards.

This FacilityTX Averagevs. TX Avg
Inspections with citations Info Inspections that resulted in at least one regulatory citation. 11 This facility has inspections with citations in line with the Texas average (1 vs. TX avg 1).— At avg

Inspection Reports Summary Info An editor-reviewed summary of the themes and findings across this facility's recent inspection reports.

  • July 7, 2024 inspection cited two deficiencies involving failure to notify caregivers of health changes and failure to protect resident privacy and confidentiality.
  • No life safety code violations or enforcement actions were found during the 2024 inspections.
  • Deficiency themes in 2024 focused on communication with caregivers and resident privacy protections.

Health Inspection History

Inspections since 2023
Total health inspections 6

Texas average 7.4


Last Health inspection on May 2025

Total health citations
18 Rank #103 / 299Health citations — State benchmarkedThis home is ranked 103rd out of 299 homes in Texas. Shows this facility's total health deficiency citations benchmarked to the Texas State average, with a ranking across all 299 TX facilities. Lower citation counts earn a better rank.Ranking totals vary by category as each rank only includes facilities that report data for that metric. Homes missing that data point aren't included in the ranking.Click the rank badge to see the full State ranking.Click here to see the full State ranking.

Texas average 25.9

Citations per inspection
3 Rank #120 / 299Citations per inspection — State benchmarkedThis home is ranked 120th out of 299 homes in Texas. Shows average deficiency citations per CMS inspection for this facility versus the Texas mean across 299 facilities with citation data. Lower is better.Ranking totals vary by category as each rank only includes facilities that report data for that metric. Homes missing that data point aren't included in the ranking.Click the rank badge to see the full State ranking.Click here to see the full State ranking.

Texas average 3.67


Health citations are formal notices following inspections when they fail to comply with safety and care standards.

11 of 18 citations resulted from standard inspections; 6 of 18 resulted from complaint investigations; and 1 of 18 came from combined inspections (standard and complaint).

Breakdown of citation severity (last 3 years)
Critical health citations
3
50% worse than Texas average

Texas average: 2


Serious health citations
0
100% better than Texas average

Texas average: 0.4

3 critical citations Texas average: 2

0 serious citations Texas average: 0.4

15 moderate citations Texas average: 23

0 minor citations Texas average: 0.4
Citations history (last 3 years)
Abuse/Neglect moderate citation May 29, 2025
Corrected

Nutrition moderate citation May 29, 2025
Corrected

Care Planning moderate citation May 29, 2025
Corrected

Care Planning moderate citation Apr 29, 2025
Corrected

Staffing Data

Reporting period: October 1 – December 31, 2025 (Q4 2025). Source: CMS Payroll-Based Journal report.

Total staff 76
Employees 60
Contractors 16
Staff to resident ratio 2.11 : 1
43% more staff per resident than Texas average
Texas average ratio: 1.48 : 1 Texas average ratio: 1.48 : 1See full Texas ranking
Avg staff/day 29
Average shift 7.1 hours
12% worse than Texas average
Texas average: 8.1 hours Texas average shift: 8.1 hoursSee full Texas ranking
Total staff hours (quarter) 18,860

Nursing staff breakdown

Q4 2025 · Oct 1 – Dec 31 More info This data comes from the CMS Payroll-Based Journal report covering October 1 – December 31, 2025.
Registered Nurse

Manages medical care and health needs.

RN Staff Info All 4 RN Staff are full-time employees. No contractors work on this role. 4
Average shift length Info Average shift length. Calculated as total hours divided by days worked and average staff per day. 9 hours
Licensed Practical Nurse

Assists with medical care and medications.

LPN Staff Info All 13 LPN Staff are full-time employees. No contractors work on this role. 13
Average shift length Info Average shift length. Calculated as total hours divided by days worked and average staff per day. 8.9 hours
Certified Nursing Assistant

Helps with daily care and mobility.

CNA Staff Info All 29 CNA Staff are full-time employees. No contractors work on this role. 29
Average shift length Info Average shift length. Calculated as total hours divided by days worked and average staff per day. 7.3 hours

Contractor staffing

Q4 2025 · Oct 1 – Dec 31 More info This data comes from the CMS Payroll-Based Journal report covering October 1 – December 31, 2025.

Total hours from contractors

12%

2,263 contractor hours this quarter

Speech Language Pathologist: 3 Physical Therapy Aide: 3 Physical Therapy Assistant: 3 Respiratory Therapy Technician: 2 Occupational Therapy Assistant: 2 Occupational Therapy Aide: 1 Qualified Social Worker: 1 Medical Director: 1

Staff by category

Q4 2025 · Oct 1 – Dec 31 More info This data comes from the CMS Payroll-Based Journal report covering October 1 – December 31, 2025.
Certified Nursing Assistant290297,14792100%7.3
Licensed Practical Nurse130133,60292100%8.9
Medication Aide/Technician6061,34092100%8.5
Registered Nurse4048457278%9
RN Director of Nursing2027976975%7.6
Physical Therapy Aide0337138491%4.5
Speech Language Pathologist0336137885%4.8
Nurse Practitioner1015046571%7.8
Administrator1014886166%8
Dietitian1014806065%8
Clinical Nurse Specialist1014786672%7.2
Other Dietary Services Staff1014776166%7.8
Occupational Therapy Aide0114605964%7.8
Mental Health Service Worker1014405560%8
Qualified Social Worker0112245257%4.3
Physical Therapy Assistant0331035964%1.4
Respiratory Therapy Technician022865054%1.6
Medical Director011391314%3
Occupational Therapy Assistant0222789%2.4
29 Certified Nursing Assistant
% of Days 100%
13 Licensed Practical Nurse
% of Days 100%
6 Medication Aide/Technician
% of Days 100%
4 Registered Nurse
% of Days 78%
2 RN Director of Nursing
% of Days 75%
3 Physical Therapy Aide
% of Days 91%
3 Speech Language Pathologist
% of Days 85%
1 Nurse Practitioner
% of Days 71%
1 Administrator
% of Days 66%
1 Dietitian
% of Days 65%
1 Clinical Nurse Specialist
% of Days 72%
1 Other Dietary Services Staff
% of Days 66%
1 Occupational Therapy Aide
% of Days 64%
1 Mental Health Service Worker
% of Days 60%
1 Qualified Social Worker
% of Days 57%
3 Physical Therapy Assistant
% of Days 64%
2 Respiratory Therapy Technician
% of Days 54%
1 Medical Director
% of Days 14%
2 Occupational Therapy Assistant
% of Days 9%

Penalties and fines

Includes penalties issued in 2024-2025

Federal penalties imposed by CMS for regulatory violations, including civil money penalties (fines) and denials of payment for new Medicare/Medicaid admissions.

Source: CMS Penalties Database (Data as of Jan 2026)

Total fines amount $26K Rank #148 / 301Federal fines — State benchmarkedThis home is ranked 148th out of 301 homes in Texas. Shows this facility's cumulative CMS federal fine dollars versus the Texas average among facilities with fines, and where it ranks among 301 facilities in the pool. Lower total dollars mean a better rank.Ranking totals vary by category as each rank only includes facilities that report data for that metric. Homes missing that data point aren't included in the ranking.Click the rank badge to see the full State ranking.Click here to see the full State ranking.
67% lower than Texas average

Texas average: $80K

Number of fines 3
21% more fines than Texas average

Texas average: 2.5

Payment Denials Info Serious action where Medicare and/or Medicaid temporarily stops payments for new residents until issues are fixed. 0
100% fewer payment denials than Texas average

Texas average: 0.2

Fines amount comparison
This facility $26K
Texas average $80K
Penalty History

Penalties are imposed by CMS for violations of federal nursing home regulations.

2 penalties in the past 3 years

Multiple penalties were reported in the last 3 years.

Civil Money Penalty Info Fines imposed for noncompliance, which can be assessed per day or per instance of violation. Apr 25, 2025
$15K
Civil Money Penalty Info Fines imposed for noncompliance, which can be assessed per day or per instance of violation. May 25, 2024
$8K

Last updated: Jan 2026

Quality of care over time

These measures show how residents usually do over time at this home, based on health outcomes and preventive care.

High-risk clinical events score Info A composite score based on pressure ulcers, falls with injury, weight loss, walking ability decline, and activities of daily living decline. 8.1
6% better than Texas average

Texas average: 8.6

Functional decline score Info A composite score based on activities of daily living decline, walking ability decline, and incontinence. 15.4
In line with Texas average

Texas average: 16.0

Long-stay resident measures
Need for Help with Daily Activities Increased Info Percent of long-stay residents whose need for help with daily activities has increased 22.9%
41% worse than Texas average

Texas average: 16.2%

Low Risk Residents with Bowel/Bladder Incontinence Info Percent of low risk long-stay residents who lose control of their bowels or bladder 7.9%
50% better than Texas average

Texas average: 15.7%

Falls with Major Injury Info Percent of long-stay residents experiencing one or more falls with major injury 0.0%
100% better than Texas average

Texas average: 3.2%

High Risk Residents with Pressure Ulcers Info Percent of long-stay high risk residents with pressure ulcers 7.2%
62% worse than Texas average

Texas average: 4.4%

Urinary Tract Infection Info Percent of long-stay residents with a urinary tract infection 3.8%
374% worse than Texas average

Texas average: 0.8%

Lost Too Much Weight Info Percent of long-stay residents who lose too much weight 2.5%
28% better than Texas average

Texas average: 3.5%

Depressive Symptoms Info Percent of long-stay residents who have depressive symptoms 0.0%
100% better than Texas average

Texas average: 2.9%

Antipsychotic Use Info Percent of long-stay residents who received an antipsychotic medication 6.3%
21% better than Texas average

Texas average: 7.9%

Pneumococcal Vaccine Info Percent of long-stay residents assessed and appropriately given the pneumococcal vaccine 98.8%
In line with Texas average

Texas average: 97.3%

Influenza Vaccine Info Percent of long-stay residents assessed and appropriately given the seasonal influenza vaccine 100.0%
In line with Texas average

Texas average: 97.9%

Short-stay resident measures
Pneumococcal Vaccine Info Percent of short-stay residents assessed and appropriately given the pneumococcal vaccine 88.0%
In line with Texas average

Texas average: 90.4%

Antipsychotic medication increase Info Percent of short-stay residents who newly received an antipsychotic medication 0.4%
75% better than Texas average

Texas average: 1.4%

Influenza Vaccine Info Percent of short-stay residents assessed and appropriately given the seasonal influenza vaccine 88.0%
In line with Texas average

Texas average: 88.0%

Breakdown by payment type

Medicare

64% of new residents, usually for short-term rehab.

Typical stay 1 months

Private pay

36% of new residents, often for short stays.

Typical stay 3 - 4 months

Facility Characteristics

Source: CMS Long-Term Care Facility Characteristics (Data as of Jan 2026)

Total residents 36
Medicare
21
58.3% of residents
Private pay or other
15
41.7% of residents
Programs & Services
Residents Group

Residents meet regularly to discuss policies, care quality, and activities

CCRC

Part of a Continuing Care Retirement Community offering multiple care levels

Active Resident Council

Organized group of residents that meets regularly to discuss facility policies, quality of life, and activities.

Finances and operations

Based on CMS SNF Cost Report for fiscal year ending in 12/2023.

Governmental community
Operated by a subsidized facility district.
Net patient revenue Info Net patient revenue — what the home actually collects for resident care, after contractual allowances, bad debt and discounts are subtracted from its gross charges (CMS cost report, Worksheet G-3). It covers resident care only; money the home earns from other sources is shown separately as "Other income."
$5.5M
Net patient income Info Net patient income: net patient revenue minus the home's total operating expenses. A positive figure means it earns more from resident care than it spends to deliver it; a negative figure means the opposite. It excludes non-operating "other income."
-$10.1M
Governmental community Operated by a subsidized facility district.
Net patient revenue Info Net patient revenue — what the home actually collects for resident care, after contractual allowances, bad debt and discounts are subtracted from its gross charges (CMS cost report, Worksheet G-3). It covers resident care only; money the home earns from other sources is shown separately as "Other income."
$5.5M Rank #58 / 304Revenue — State benchmarkedThis home is ranked 58th out of 304 homes in Texas. Shows this facility's annual revenue compared to the Texas average. Higher revenue generally means more resources for staffing and capital — read alongside Payroll %.Ranking totals vary by category as each rank only includes facilities that report data for that metric. Homes missing that data point aren't included in the ranking.Click the rank badge to see the full State ranking.Click here to see the full State ranking.
Net patient income Info Net patient income: net patient revenue minus the home's total operating expenses. A positive figure means it earns more from resident care than it spends to deliver it; a negative figure means the opposite. It excludes non-operating "other income."
-$10.1M
Other income Info Money the home earns outside of resident care — such as investments, grants, rentals and other non-operating sources (CMS cost report, Worksheet G-3). It is tracked separately from net patient revenue: it is not part of that figure, and it is not included in net patient income.
$8.3M
Payroll costs Info Staff salaries plus wage-related costs — benefits such as payroll taxes, health insurance and retirement — from the home's own accounting records (CMS cost report, Worksheet A). Contract or agency labor is counted separately, under other operating costs. Rank #71 / 304Payroll — State benchmarkedThis home is ranked 71st out of 304 homes in Texas. Shows total annual staff payroll benchmarked to the Texas average. Higher payroll investment relative to peers often signals better staffing and less reliance on cheaper contract labor.Ranking totals vary by category as each rank only includes facilities that report data for that metric. Homes missing that data point aren't included in the ranking.Click the rank badge to see the full State ranking.Click here to see the full State ranking.
$5.9M 107.4% of net patient revenue Info Payroll as a share of revenue: staff salaries and wage-related benefits divided by net patient revenue. A higher figure means more of each revenue dollar goes to staff pay. Rank #199 / 304Payroll % — State benchmarkedThis home is ranked 199th out of 304 homes in Texas. Shows payroll as a percentage of revenue versus the Texas average. Well-run Texas facilities typically land around 51–63% — the top third Statewide. Below 25% may signal understaffing or heavy agency use — read with Staffing ratings.Ranking totals vary by category as each rank only includes facilities that report data for that metric. Homes missing that data point aren't included in the ranking.Click the rank badge to see the full State ranking.Click here to see the full State ranking.
Other operating costs Info Everything it costs to run the home apart from payroll — food, utilities, supplies, maintenance, contract labor and administration. Calculated as total operating expense minus payroll (staff salaries and wage-related benefits).
$9.7M
Total costs Info The home's total operating expense for the year — all the costs of running it, salaries included (CMS cost report, Worksheet G-3).
$15.6M

What does this home offer?

Housing options icon

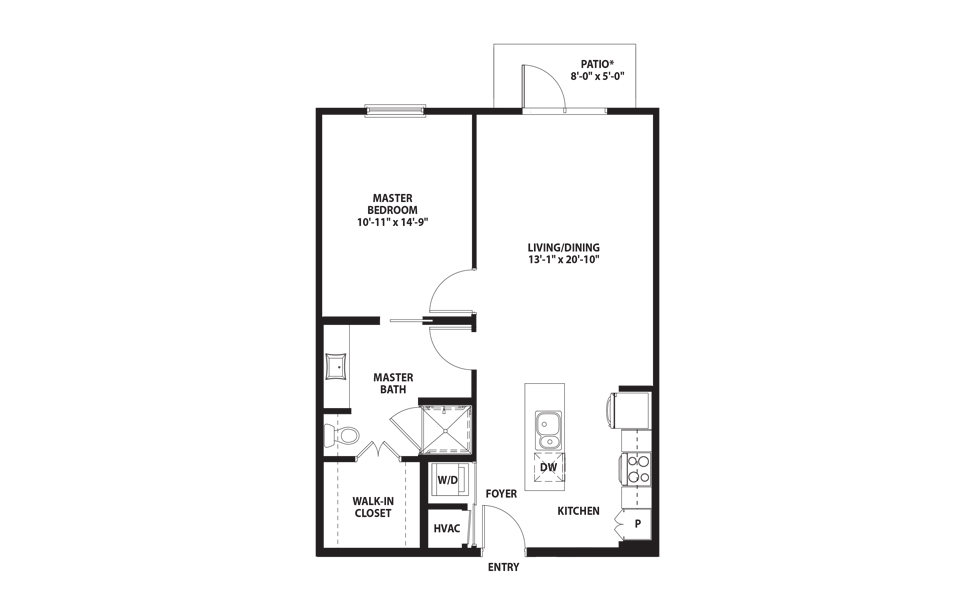
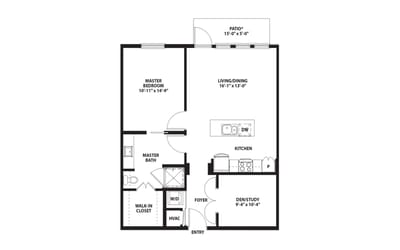
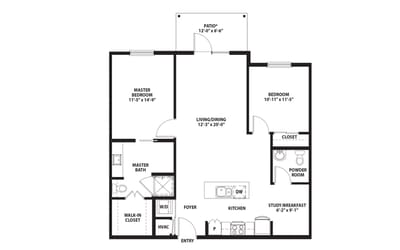
Housing Options: 1 Bed / 2 Bed

Building type icon
Building type icon

Building Type: 3-story

Fitness and recreation icon

Fitness and Recreation

Who this home usually serves

TYPE OF STAY

Mostly short-term rehab stays

Most residents typically stay for a few weeks or months before returning home or moving on.

Most new residents arrive under Medicare (64% of admissions), and a typical Medicare stay runs around 1 months.

Admissions
220 total

Coverage residents most often arrive under.

Medicare 64%
Private pay 36%
Discharges
231 total

Coverage residents most often leave under.

Medicare 51%
Private pay 49%

Managed by Lisa Gonzales

Healthcare Administrator

Over 30 years of experience

Lisa Gonzales serves as the Healthcare Administrator at Mirador Retirement Community, overseeing skilled nursing, assisted living, and memory support neighborhoods. With over thirty years as a Gerontologist, she is licensed as a facility administrator and certified as an assisted living manager. Lisa's extensive experience includes administrative and executive director roles, consulting for start-ups, and serving on various nonprofit boards focused on senior care.

Living Spaces & Floor Plans for Mirador Retirement Community

Mirador Retirement Community3
Mirador Retirement Community2
Mirador Retirement Community1
Mirador Retirement Community
Oso Bay Floor Plan
Download PDF
Copano Bay Floor Plan
Download PDF
Meridian Floor Plan
Download PDF
Catalina Floor Plan
Download PDF
Laguna Madre Floor Plan
Download PDF

Places of interest near Mirador Retirement Community

Address 10.0 miles from city center Info Estimated distance in miles from Corpus Christi's city center to Mirador Retirement Community's address, calculated via Google Maps.

Calculate Travel Distance to Mirador Retirement Community

Add your location

Address

Compare Nursing Home around Texas

The information below is reported by the Texas Health and Human Services Commission.

5 facilities compared · CMS & TX Dept. of Health data

The Legacy Midtown Park
NH
AL
HC
IL
MC
Dallas (Vickery Meadow)
98
Facility 98
TX AVG 80
Rank #376 / 988
87.5%
Facility 87.5%
TX AVG 63.5%
Rank #31 / 304
+38%
5.42
Facility 5.42
TX AVG 3.63
Rank #14 / 296
+1%+49%
$27.5k
Facility $27.5k
TX AVG $81.8k
Rank #168 / 301
4
Facility 4
TX AVG 25.9
Rank #2 / 299
1.3
Facility 1.3
TX AVG 3.7
Rank #2 / 299
-48-
45
Facility 45
TX AVG 41
Rank #628 / 1391
The Legacy Midtown Park Inc
$16.1M
Facility $16.1M
TX AVG $8.4M
Rank #9 / 304
$15.0M
Facility $15.0M
TX AVG $3.5M
Rank #9 / 304
93%
Facility 93%
TX AVG 47%
Rank #214 / 304
676489
Caraday of Houston
NH
MC
RC
Houston (Northside / Northline)
150
Facility 150
TX AVG 80
Rank #63 / 988
--
3.76
Facility 3.76
TX AVG 3.63
Rank #93 / 296
-32%+4%
$0
Facility $0
TX AVG $81.8k
Rank #1 / 301
15
Facility 15
TX AVG 25.9
Rank #66 / 299
3.8
Facility 3.8
TX AVG 3.7
Rank #202 / 299
-12-
41
Facility 41
TX AVG 41
Rank #709 / 1391
E&R Cunningham Investments, LP
$2.7M
Facility $2.7M
TX AVG $8.4M
Rank #299 / 304
$1.8M
Facility $1.8M
TX AVG $3.5M
Rank #297 / 304
66.5%
Facility 66.5%
TX AVG 47%
Rank #103 / 304
676470
Sun Valley Rehabilitation and Healthcare Center
NH
HC
MC
NC
RC
Harlingen (Estrellita Subdivision)
124
Facility 124
TX AVG 80
Rank #178 / 988
76.4%
Facility 76.4%
TX AVG 63.5%
Rank #102 / 304
+20%
3.79
Facility 3.79
TX AVG 3.63
Rank #93 / 296
-15%+4%
$0
Facility $0
TX AVG $81.8k
Rank #1 / 301
5
Facility 5
TX AVG 25.9
Rank #6 / 299
2.5
Facility 2.5
TX AVG 3.7
Rank #64 / 299
-94-
37
Facility 37
TX AVG 41
Rank #808 / 1391
Av Rehab LLC
$9.2M
Facility $9.2M
TX AVG $8.4M
Rank #176 / 304
$4.9M
Facility $4.9M
TX AVG $3.5M
Rank #163 / 304
53.1%
Facility 53.1%
TX AVG 47%
Rank #129 / 304
676493
Houston Transitional Care
NH
HC
MC
NC
PC
RC
Houston (Braeburn)
70
Facility 70
TX AVG 80
Rank #517 / 988
90.3%
Facility 90.3%
TX AVG 63.5%
Rank #18 / 304
+42%
3.17
Facility 3.17
TX AVG 3.63
Rank #222 / 296
+22%-13%
$0
Facility $0
TX AVG $81.8k
Rank #1 / 301
16
Facility 16
TX AVG 25.9
Rank #76 / 299
5.3
Facility 5.3
TX AVG 3.7
Rank #274 / 299
-67-
75
Facility 75
TX AVG 41
Rank #67 / 1391
Ahmad El-Saadi
$12.3M
Facility $12.3M
TX AVG $8.4M
Rank #31 / 304
$5.1M
Facility $5.1M
TX AVG $3.5M
Rank #134 / 304
41.4%
Facility 41.4%
TX AVG 47%
Rank #301 / 304
676435
Mirador Retirement Community
NH
AL
IL
MC
NC
Corpus Christi (South Side)
66
Facility 66
TX AVG 80
Rank #547 / 988
88.4%
Facility 88.4%
TX AVG 63.5%
Rank #25 / 304
+39%
4.79
Facility 4.79
TX AVG 3.63
Rank #26 / 296
-31%+32%
$22.9k
Facility $22.9k
TX AVG $81.8k
Rank #148 / 301
18
Facility 18
TX AVG 25.9
Rank #103 / 299
3.0
Facility 3.0
TX AVG 3.7
Rank #120 / 299
333A+
39
Facility 39
TX AVG 41
Rank #754 / 1391
Deborah Nugent
$5.5M
Facility $5.5M
TX AVG $8.4M
Rank #58 / 304
$5.9M
Facility $5.9M
TX AVG $3.5M
Rank #71 / 304
107.4%
Facility 107.4%
TX AVG 47%
Rank #199 / 304
676303

Financial Assistance for
Nursing Home in Texas

Mirador Retirement Community is located in Corpus Christi, Texas.
Here are the financial assistance programs available to residents in Texas.

Get Financial aid guidance

Community Care for the Aged and Disabled (CCAD)

TX Medicaid CCAD

Age 65+ or disabled
General Texas resident, Medicaid-eligible, care need (not always nursing home level).
Income Limits (2025) ~$2,829/month 300% FBR, individual
Asset Limits $2,000 (individual), $3,000 (couple).
TX

Large state; rural access challenges.

Benefits
Personal care (5-7 hours/day) Respite (240 hours/year) Adult day care (~$60/day) Home aides

Texas Community Care Services

TX CCS

Age 60+
General Texas resident, at risk of decline.
Income Limits ~$2,000/month individual, varies
Asset Limits $5,000 individual
TX

Limited funding; high demand in urban areas.

Benefits
In-home care (3-5 hours/week) Respite (up to 10 days/year) Transportation (~5 trips/month)

Area Agency on Aging (AAA) Services

Texas AAA Services

Age 60+
General TX resident; no income/asset limits.
Income Limits (2025) None; donations encouraged.
Asset Limits Not assessed.
TX

28 AAAs; includes Meals on Wheels in some areas.

Benefits
Meals (~$5-$7/meal) Transportation Homemaker services (~4 hours/week) Respite (~5 days/year) Legal aid

Medicare Savings Program (MSP)

Texas Medicare Savings Program

Age 65+ or disabled
General TX resident, Medicare Part A/B.
Income Limits (2025) ~$2,510/month (QMB), ~$3,380/month (SLMB), ~$3,598/month (QI)—individual.
Asset Limits $9,430 (individual), $14,130 (couple).
TX

Includes Extra Help for Part D; no waitlist.

Benefits
Covers Part B premiums ($174.70/month) Deductibles ($240/year) Copays (~20%)

Family Caregiver Support Program (FCSP)

Texas Family Caregiver Support Program

Age
General Caregivers of 60+ needing care or 55+ caregivers of others; TX resident; 2+ ADLs.
Income Limits (2025) No strict cap; prioritizes low-income ~$24,980/year
Asset Limits Not assessed.
TX

High rural demand; includes grandparent caregivers.

Benefits
Respite (4-6 hours/week or 5 days/year) Adult day care ($60/day) Training Supplies (~$500/year)

VA Aid and Attendance (A&A) and Housebound Benefits

Texas VA Aid and Attendance/Housebound

Age 65+ or disabled veteran/spouse
General TX resident, wartime service, ADL help (A&A) or homebound.
Income Limits (2025) Net income < ~$1,984/month (veteran with dependent, A&A); pension offsets income.
Asset Limits ~$155,356 net worth
TX

High veteran population; supports rural/urban needs.

Benefits
Cash (~$1,433-$2,642/month veteran, ~$951-$1,318 spouse) for care costs

Property Tax Exemption for Seniors

Texas Senior Property Tax Exemption

Age 65+
General TX resident, homeowner (homestead).
Income Limits (2025) None; tax-based eligibility.
Asset Limits Not assessed.
TX

$25,000+ exemption; optional freeze in some counties; saves ~$500-$1,000/year.

Benefits
Tax exemption or freeze (~$500-$1,000/year savings)

Senior Farmers’ Market Nutrition Program (SFMNP)

Texas SFMNP

Age 60+
General TX resident, low-income.
Income Limits (2025) ~$2,322/month 185% FPL
Asset Limits Not assessed.
TX

Vouchers (~$50/season); serves ~20,000 via 28 AAAs.

Benefits
Vouchers (~$50/season) for produce at farmers’ markets

Frequently Asked Questions about Mirador Retirement Community

What neighborhood is Mirador Retirement Community in?

Mirador Retirement Community is in the South Side neighborhood of Corpus Christi.

Who is the owner of Mirador Retirement Community?

The legal owner and operator of Mirador Retirement Community is Methodist Retirement Communities.

Is Mirador Retirement Community in a walkable area?

Mirador Retirement Community has a walk score of 39. Somewhat walkable. A few nearby services may be reachable on foot, but most trips require transportation.

What is the license number of Mirador Retirement Community?

According to TX state health department records, Mirador Retirement Community's license number is 307620.

When does Mirador Retirement Community's license expire?

According to TX state health department records, Mirador Retirement Community's license expires on January 5, 2028.

What is the occupancy rate at Mirador Retirement Community?

Mirador Retirement Community's occupancy is 88%.

Does Mirador Retirement Community have different floorplan options?

Yes — see the floorplan options available at Mirador Retirement Community on this page.

Guides for Better Senior Living

Care Cost Calculator: See Prices in Your Area

Nursing Home Data Explorer

Don’t Wait Too Long: 7 Red Flag Signs Your Parent Needs Assisted Living Now

The True Cost of Assisted Living in 2025 – And How Families Are Paying For It

Understanding Senior Living Costs: Pricing Models, Discounts & Financial Assistance