


Momentum at South Bay for Rehabilitation and Nursing
Nursing Home & Skilled Nursing · East Islip, NY

Momentum at South Bay for Rehabilitation and Nursing

Nursing Home & Skilled Nursing · East Islip, NY

Overview of Momentum at South Bay for Rehabilitation and Nursing

Momentum at South Bay for Rehabilitation and Nursing sits at 340 East Montauk Highway in East Islip, a 160-bed skilled nursing facility run by Suffolk Restorative Therapy and Nursing, LLC. Occupancy runs high here, 97 percent, with 155 of 160 beds filled. That’s about as close to full as a facility gets.

Staffing is where this place actually distinguishes itself. Total nursing care averages 3 hours and 49 minutes per resident, per day, and registered nurses alone account for 53 minutes of that. Those aren’t vague promises about “attentive care,” they’re concrete numbers that reflect real clinical depth. The area itself is car-dependent, Walk Score of 17, so getting around means getting behind the wheel.

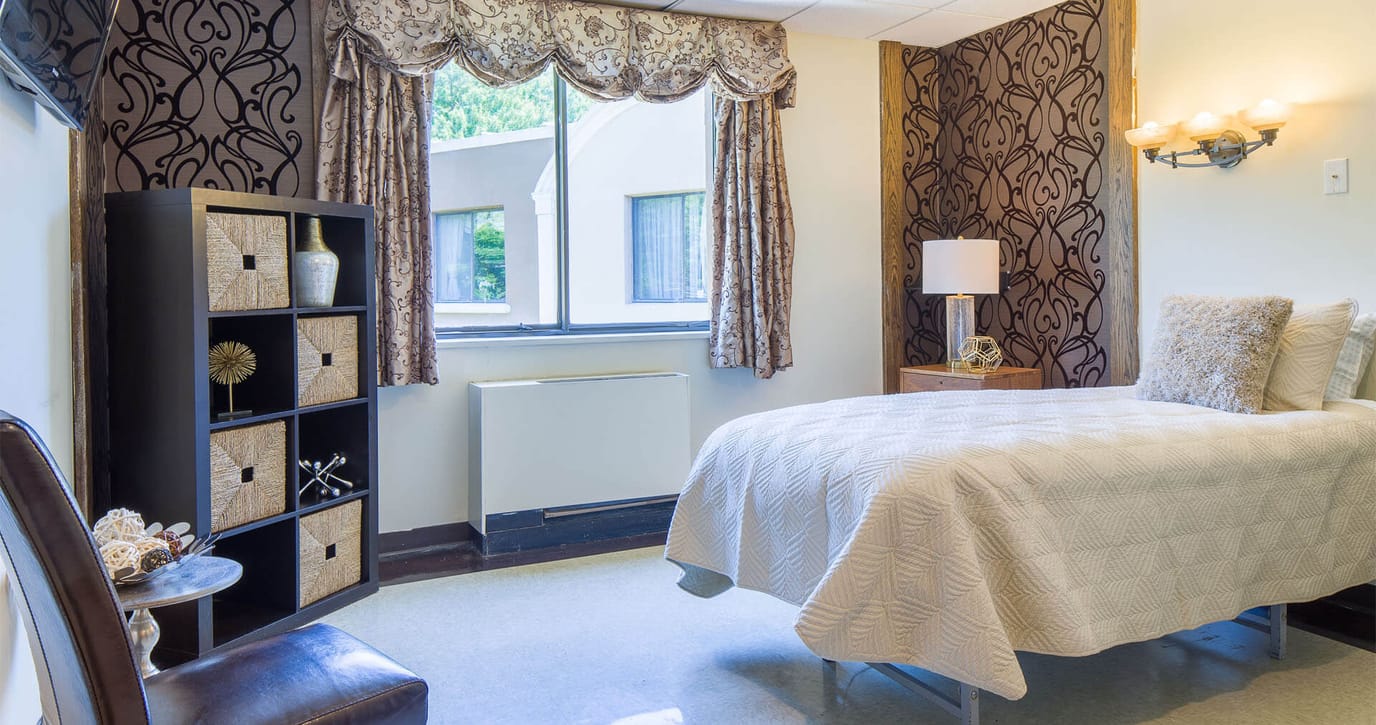
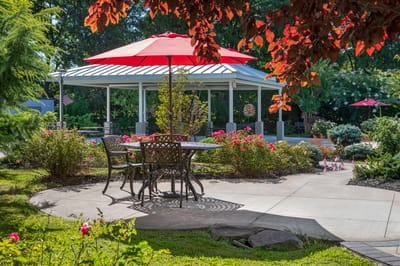
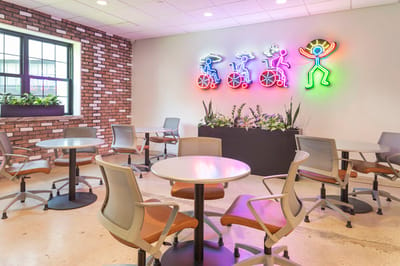
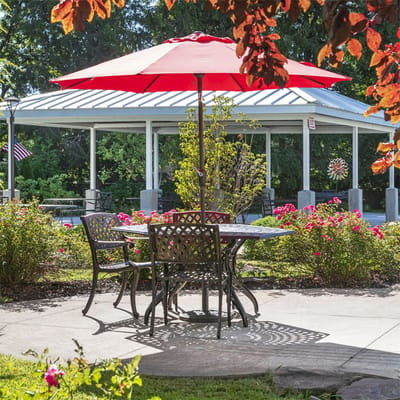
The clinical programming backs up that staffing investment. Diabetes Management and Education, Amputee Rehabilitation, and a 30-Day Medicare track are all named, structured programs, not generic service categories. Cardiology and vascular monitoring, wound care, and post-COVID-19 rehabilitation round out the specialized care lineup. Outside the clinical side, there are gardens, a bakery, and a gym, small things, but they matter for daily quality of life.

Inspections here have tended to focus on infection prevention and control and care planning and documentation, the kind of operational areas regulators routinely review at facilities handling complex medical cases.

What this shows is a skilled nursing facility built for residents who need real clinical intensity: strong staffing numbers, named specialty programs, and a structure clearly calibrated for more complicated medical needs than a typical long-term care setting.

Staffing hours breakdown

Info Daily nursing hours per resident by staff type, reported to CMS. Higher is generally better — compare this facility to state and national averages to see where staffing stands.

Hours per resident per day — compared to New York state averages

Staff typeHours / Day / Residentvs state avg
Registered Nurse (RN) Info RNs hold the highest nursing license and can assess residents, interpret test results, and direct care plans. More RN hours per day often signals stronger clinical oversight and faster response to health changes. 53m per day ▲ 26% State avg: 42m per day · National avg: 41m per day
LPN / LVN Info Licensed Practical Nurses (LPNs) or Licensed Vocational Nurses (LVNs) deliver routine hands-on care — medication administration, wound dressing, and monitoring vital signs. They work under RN supervision and make up a large share of daily bedside care. 1h 8m per day ▲ 48% State avg: 46m per day · National avg: 52m per day
Nurse Aide Info Certified Nurse Aides (CNAs) provide the most direct day-to-day assistance: bathing, dressing, feeding, and mobility. Nurse aide hours are typically the largest staffing category and directly affect residents' quality of life. 2h 16m per day ▲ 4% State avg: 2h 11m per day · National avg: 2h 20m per day
Weekend Total Nursing Info Combined nursing hours (RN + LPN + Nurse Aide) per resident per day on weekends. Staffing often drops on weekends — this figure reveals whether the facility maintains adequate coverage outside of weekday hours. 3h 43m per day ▲ 17% State avg: 3h 10m per day · National avg: 3h 26m per day
Physical Therapist Info Hours per resident per day provided by licensed Physical Therapists (PTs) or PT Assistants. PT services help residents recover mobility after injury or illness and are especially important for post-acute (short-stay) rehabilitation. 9m per day ▲ 29% State avg: 7m per day · National avg: 4m per day
Weekend RN Info Registered nurse hours specifically on weekends. Facilities sometimes reduce RN presence on Saturdays and Sundays — a low weekend RN figure compared to weekday hours can indicate reduced clinical oversight when most administrative staff are absent. 28m per day ■ Avg State avg: 28m per day · National avg: 28m per day
Bed community size
160-bed community Rank #296 / 742Bed count — State benchmarkedThis home is ranked 296th out of 742 homes in New York for Bed Count. Shows this facility's certified or reported bed count compared to other New York facilities. Larger communities may offer more amenities, programs, and on-site services for residents and families.Facilities with the same value for a metric share the same rank. Rankings are based only on facilities in New York that report data for that category. Facilities without available data are excluded from the ranking.Click the rank badge to see the full State ranking.Click here to see the full State ranking.
A large-scale community that may provide a wide range of amenities, services, and structured programs.
Walk Score
Walk Score: 17 / 100 Rank #1042 / 1169Walk Score — State benchmarkedThis home is ranked 1042nd out of 1169 homes in New York for Walk Score. Shows how walkable this facility's neighborhood is compared to the average Walk Score across New York facilities. Higher scores benefit residents, families, and staff.Facilities with the same value for a metric share the same rank. Rankings are based only on facilities in New York that report data for that category. Facilities without available data are excluded from the ranking.Click the rank badge to see the full State ranking.Click here to see the full State ranking.
Car-dependent. Most errands require a car, with limited nearby walkable options.

About this community

Occupancy

Occupancy rate
97%
Rank #109 / 413Occupancy rate — State benchmarkedThis home is ranked 109th out of 413 homes in New York for Occupancy. Shows this facility's occupancy rate versus the New York average, with its Statewide rank out of 413. Higher occupancy signals strong local demand and financial stability.Facilities with the same value for a metric share the same rank. Rankings are based only on facilities in New York that report data for that category. Facilities without available data are excluded from the ranking.Click the rank badge to see the full State ranking.Click here to see the full State ranking.
Higher than the New York average: 88.3%
Occupied beds
155 / 160
Average occupied beds in New York homes 166 beds

License Details

Facility TypeNursing Home
StatusActive
CountySuffolk
License Number5154324N

Ownership & Operating Entity

Momentum at South Bay for Rehabilitation and Nursing is legally operated by Suffolk Restorative Therapy and Nursing, LLC (For Profit).

Owner NameSuffolk Restorative Therapy And Nursing, LLC (For Profit)

Therapy & Rehabilitation

1 service
Rehabilitation Services

Additional Policies & Features

Pets not allowed

Amenities & Lifestyle

Beautiful Rooms
Spa-Like Care
Bakery/Cafe
Outdoor Gardens
State-Of-The-Art Gym
Innovative Dining Options
Specific ProgramsDiabetes Management & Education Program, Amputee Rehabilitation Program, Telemetry Monitoring, Clinical Services, 30 Day Medicare Program

Contact Momentum at South Bay for Rehabilitation and Nursing

Inspection History

In New York, the Department of Health, Office of Aging and Long Term Care performs unannounced onsite inspections to monitor compliance with state and federal healthcare regulations.

Inspection Score Info A composite 0–100 score combining this facility's inspections, citations, complaints, and enforcement actions relative to the New York state average. The score below shows how many points this facility sits above or below the typical New York nursing home score (the benchmark); higher is better.This is a proprietary Assisted Living Magazine score.

10 points below the New York average for nursing homes (83/100)

Rank #461 / 591 in New York Inspection Score — State benchmarked This home is ranked 461st out of 591 homes in New York for Inspection Score. Shows this facility's inspection score compared to the New York average among 591 comparable communities in the ranking pool. Facilities with the same value for a metric share the same rank. Rankings are based only on facilities in New York that report data for that category. Facilities without available data are excluded from the ranking. This is a proprietary Assisted Living Magazine score. Inspection score: 73 out of 100. Letter grade C. 10 points below the New York average for nursing homes (83/100)

Enforcement Actions Info Enforcement actions are formal penalties or interventions imposed by New York regulators when a nursing home fails to meet state or federal care, safety, or regulatory standards. They may include directed plans of correction, civil monetary penalties, denial of payment, or appointment of temporary management.

Since 2015
2 enforcement actions

This facility has 2 enforcement actions. 33% of New York nursing homes have zero, and the statewide average is 1.6.

  • September 9, 2022 Infection Control #NH-23-029
  • September 15, 2015 Multiple Deficiencies #NH-16-168

Inspection Scorecard Info This scorecard compares key inspection, citation, and complaint metrics at this facility against the New York state average. Metrics rated ≥15% worse than average are highlighted in red; those ≥15% better are highlighted in green.

Since 2022 vs. New York state average
Overall vs. NY average 7 Worse Metrics worse than New York average:
• Total citations (200% above)
• Health citations (70% above)
• Life safety citations (25% above)
• Citations per year (197% above)
• Citations per inspection (57% above)
• Inspections with citations (100% above)
• Complaint investigations (73% above)
1 At Avg Metrics at New York average:
• Inspection citation rate (at NY avg)
3 Better Metrics better than New York average:
• Total complaints (25% below)
• Complaints per year (25% below)
• Complaints per bed (24% below)

Citations Info Citations are formal regulatory issues recorded during state inspections.

This FacilityNY Averagevs. NY Avg
Total citations Info Formal regulatory issues recorded by inspectors across all inspection types. 3913 This facility has 200% more total citations than a typical New York nursing home (39 vs. NY avg 13).↑ 200% worse
Health citations Info Citations related to resident care, clinical practices, and day-to-day operations. 3420 This facility has 70% more health citations than a typical New York nursing home (34 vs. NY avg 20).↑ 70% worse
Life safety citations Info Citations related to building safety — fire prevention, emergency egress, and similar. 54 This facility has 25% more life safety citations than a typical New York nursing home (5 vs. NY avg 4).↑ 25% worse
Citations per year Info Average citations per year since 2022. 9.83.3 This facility has 197% more citations per year than a typical New York nursing home (9.8 vs. NY avg 3.3).↑ 197% worse
Citations per inspection Info Average citations per inspection. 2.21.4 This facility has 57% more citations per inspection than a typical New York nursing home (2.2 vs. NY avg 1.4).↑ 57% worse

Inspections Info State inspections evaluate whether the facility meets health and safety standards.

This FacilityNY Averagevs. NY Avg
Total inspections Info Combined count of all routine and focused inspections. Excludes complaint investigations. 189 This facility has had 100% more total inspections than the New York average (18 vs. NY avg 9). More inspections can mean more regulatory scrutiny rather than worse care.↑ 100% more
Inspections with citations Info Inspections that resulted in at least one regulatory citation. 84 This facility has 100% more inspections with citations than a typical New York nursing home (8 vs. NY avg 4).↑ 100% worse
Inspection citation rate Info Percentage of inspections that resulted in at least one citation. 44%44% This facility has inspection citation rate in line with the New York average (44 vs. NY avg 44).— At avg

Complaints & Investigations Info Complaints are formal concerns filed by residents, families, or staff. Investigations are on-site follow-ups.

This FacilityNY Averagevs. NY Avg
Total complaints Info Formal expressions of concern made by residents, families, or staff. 5979 This facility has 25% fewer total complaints than a typical New York nursing home (59 vs. NY avg 79).↓ 25% better
Complaints per year Info Average complaints per year since 2022. 14.819.8 This facility has 25% fewer complaints per year than a typical New York nursing home (14.8 vs. NY avg 19.8).↓ 25% better
Complaints per bed Info Size-adjusted complaint rate based on occupied beds. 0.380.50 This facility has 24% fewer complaints per bed than a typical New York nursing home (0.38 vs. NY avg 0.5).↓ 24% better
Complaint investigations Info On-site investigations triggered by complaints filed with New York regulators. 2615 This facility has 73% more complaint investigations than a typical New York nursing home (26 vs. NY avg 15).↑ 73% worse

Inspection Reports Summary Info An editor-reviewed summary of the themes and findings across this facility's recent inspection reports.

  • September 9, 2025 inspection found five Level 2 deficiencies in care planning, infection control, pain management, and physician supervision with no severe systemic problems.
  • June 11, 2024 inspection identified two Level 2 deficiencies in infection control and IV fluids that were fully corrected by July 31, 2024.
  • Multiple inspections from March 2022 to August 2022 repeatedly cited widespread Level 2 deficiencies in reporting to the national health safety network without harm.

Infection Prevention & Vaccination

How this facility protects residents through staff vaccination policies and immunization practices.

Employee Flu Vaccination Rate: 97%

Percentage of facility employees vaccinated against influenza.

Quality of care over time

These measures show how residents usually do over time at this home, based on health outcomes and preventive care.

Long-stay resident measures
Significantly above average Info CMS star rating based on long-stay quality measure performance. 5 stars = significantly above average, 1 star = significantly below average.
Hospitalizations per 1,000 days Info Number of hospitalizations per 1,000 long-stay resident days. 0.98
43% better than New York average

New York average: 1.71

ED visits per 1,000 days Info Number of outpatient emergency department visits per 1,000 long-stay resident days. 0.47
65% better than New York average

New York average: 1.35

Short-stay resident measures
Significantly above average Info CMS star rating based on short-stay quality measure performance. 5 stars = much above average, 1 star = much below average.
Re-hospitalized after SNF stay Info Percentage of short-stay residents who were re-hospitalized after their nursing home admission. 16.0%
22% better than New York average

New York average: 20.6%

Emergency department visits Info Percentage of short-stay residents who had an outpatient emergency department visit. 7.5%
23% better than New York average

New York average: 9.7%

Falls with major injury Info Percentage of SNF residents who experience falls with major injury during their stay. 1.2%
58% worse than New York average

New York average: 0.8%

Ability to care for self at discharge Info Percentage of residents at or above expected ability to care for themselves at discharge. 58.8%
10% better than New York average

New York average: 53.7%

Successful return to home or community Info Rate of successful return to home or community from a skilled nursing facility. 61.1%
21% better than New York average

New York average: 50.6%

Places of interest near Momentum at South Bay for Rehabilitation and Nursing

Address 1.3 miles from city center Info Estimated distance in miles from East Islip's city center to Momentum at South Bay for Rehabilitation and Nursing's address, calculated via Google Maps.

Calculate Travel Distance to Momentum at South Bay for Rehabilitation and Nursing

Add your location

Address

Compare Nursing Homes around Suffolk County

The information below is reported by the New York State Department of Health.

CMS & NY Dept. of Health data

Massapequa Center Rehabilitation & Nursing
NH
ADC
PC
SNF
Amityville (Louden Avenue)
320
Facility 320
NY AVG 160
Rank #45 / 742
89.1%
Facility 89.1%
NY AVG 87.2
Rank #305 / 413
+2%
3.01
Facility 3.01
NY AVG 3.58
Rank #267 / 401
-14%-16%
$0
Facility $0
NY AVG $67.6k
Rank #1 / 409
75
Facility 75
NY AVG 83
Rank #435 / 591
11
Facility 11
NY AVG 18.5
Rank #91 / 408
5.5
Facility 5.5
NY AVG 5.1
Rank #262 / 408
-285-
62
Facility 62
NY AVG 63
Rank #677 / 1169
Aharon Bleier
$58.5MFiscal year ending 12/2023
Facility $58.5MFiscal year ending 12/2023
NY AVG $32.0M
Rank #32 / 396
$28.0MFiscal year ending 12/2023
Facility $28.0MFiscal year ending 12/2023
NY AVG $10.7M
Rank #41 / 396
47.8%Fiscal year ending 12/2023
Facility 47.8%Fiscal year ending 12/2023
NY AVG 37%
Rank #245 / 396
335213
Milford Health & Rehabilitation Center
NH
HOS
PC
RC
SNF
Milford (Morningside)120 93.3% +11%3.35 -14%-16%$0-153.8-112- 39 Marvin Ostreicher 2012 Family Trust$19.4MFiscal year ending 09/2023$10.7MFiscal year ending 09/202355.1%Fiscal year ending 09/202375064
Luxor at Mills Pond Rehabilitation & Nursing Center
NH
HOS
PC
RC
SNF
St James (Saint James)
250
Facility 250
NY AVG 160
Rank #105 / 742
91.2%
Facility 91.2%
NY AVG 87.2
Rank #268 / 413
+5%
2.83
Facility 2.83
NY AVG 3.58
Rank #317 / 401
-47%-21%
$0
Facility $0
NY AVG $67.6k
Rank #1 / 409
77
Facility 77
NY AVG 83
Rank #395 / 591
11
Facility 11
NY AVG 18.5
Rank #91 / 408
3.7
Facility 3.7
NY AVG 5.1
Rank #108 / 408
-228-
20
Facility 20
NY AVG 63
Rank #1024 / 1169
Shaya Bernath
$42.0MFiscal year ending 12/2023
Facility $42.0MFiscal year ending 12/2023
NY AVG $32.0M
Rank #88 / 396
$15.2MFiscal year ending 12/2023
Facility $15.2MFiscal year ending 12/2023
NY AVG $10.7M
Rank #95 / 396
36%Fiscal year ending 12/2023
Facility 36%Fiscal year ending 12/2023
NY AVG 37%
Rank #216 / 396
335739
Oasis Rehabilitation and Nursing, LLC
NH
SNF
Center Moriches
100
Facility 100
NY AVG 160
Rank #501 / 742
94.0%
Facility 94.0%
NY AVG 87.2
Rank #207 / 413
+8%
2.62
Facility 2.62
NY AVG 3.58
Rank #373 / 401
+9%-27%
$0
Facility $0
NY AVG $67.6k
Rank #1 / 409
91
Facility 91
NY AVG 83
Rank #144 / 591
8
Facility 8
NY AVG 18.5
Rank #42 / 408
2.7
Facility 2.7
NY AVG 5.1
Rank #42 / 408
-94-
57
Facility 57
NY AVG 63
Rank #723 / 1169
Brenainn Flanagan
$23.7MFiscal year ending 12/2023
Facility $23.7MFiscal year ending 12/2023
NY AVG $32.0M
Rank #224 / 396
$13.1MFiscal year ending 12/2023
Facility $13.1MFiscal year ending 12/2023
NY AVG $10.7M
Rank #220 / 396
55.3%Fiscal year ending 12/2023
Facility 55.3%Fiscal year ending 12/2023
NY AVG 37%
Rank #204 / 396
335402

Financial Assistance for
Nursing Home in New York

Momentum at South Bay for Rehabilitation and Nursing is located in East Islip, New York State.
Here are the financial assistance programs available to residents in New York State.

Get Financial aid guidance

Community First Choice Option

NY Medicaid CFCO

Age 65+ or disabled
General New York resident, Medicaid- eligible, care need (not necessarily nursing home level).
Income Limits (2025) ~$2,829/month 300% FBR, individual
Asset Limits $30,182 individual, higher due to NY Medicaid expansion
NY

Higher asset limit; urban density increases demand.

Benefits
Personal care (5-7 hours/day) Respite care (240 hours/year) Home modifications ($1,500 avg.) Assistive technology ($500 avg.)

Expanded In-Home Services for the Elderly Program (EISEP)

NY EISEP

Age 60+
General New York resident, at risk of decline but not nursing home level.
Income Limits ~$2,500/month individual, varies
Asset Limits $15,000 individual
NY

Cost-sharing required above certain income; urban/rural balance.

Benefits
In-home care (3-5 hours/week) Respite (up to 10 days/year) Case management Transportation (~5 trips/month)

Frequently Asked Questions about Momentum at South Bay for Rehabilitation and Nursing

Who is the owner of Momentum at South Bay for Rehabilitation and Nursing?

Momentum at South Bay for Rehabilitation and Nursing is legally operated by Suffolk Restorative Therapy and Nursing, LLC (For Profit).

Is Momentum at South Bay for Rehabilitation and Nursing in a walkable area?

Momentum at South Bay for Rehabilitation and Nursing has a walk score of 17. Car-dependent. Most errands require a car, with limited nearby walkable options.

What is the license number of Momentum at South Bay for Rehabilitation and Nursing?

According to NY state health department records, Momentum at South Bay for Rehabilitation and Nursing's license number is 5154324N.

What is the occupancy rate at Momentum at South Bay for Rehabilitation and Nursing?

Momentum at South Bay for Rehabilitation and Nursing's occupancy is 97%.

Are pets allowed at Momentum at South Bay for Rehabilitation and Nursing?

No, Momentum at South Bay for Rehabilitation and Nursing has a no-pet policy.

How many beds does Momentum at South Bay for Rehabilitation and Nursing have?

Momentum at South Bay for Rehabilitation and Nursing has 160 beds.

Has Momentum at South Bay for Rehabilitation and Nursing had any citations?

Momentum at South Bay for Rehabilitation and Nursing has had 39 reported citations since 2022 according to records from New York State Department of Health (NYSDOH).

Guides for Better Senior Living

Care Cost Calculator: See Prices in Your Area

Nursing Home Data Explorer

Don’t Wait Too Long: 7 Red Flag Signs Your Parent Needs Assisted Living Now

The True Cost of Assisted Living in 2025 – And How Families Are Paying For It

Understanding Senior Living Costs: Pricing Models, Discounts & Financial Assistance


