


Occupancy rate
100%
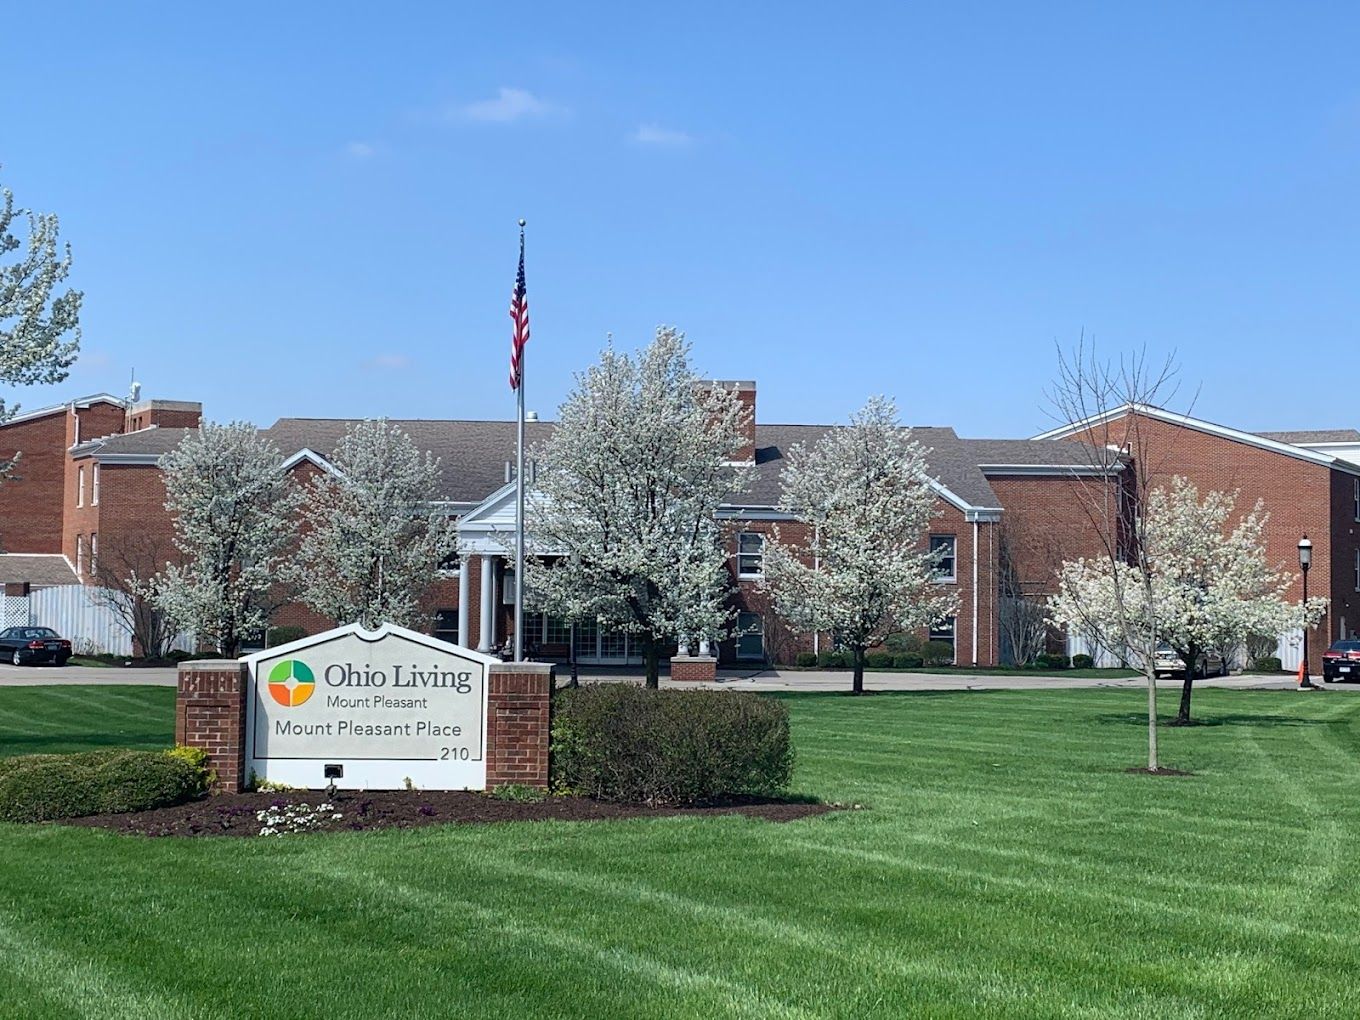
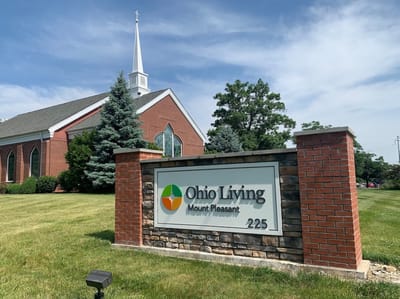
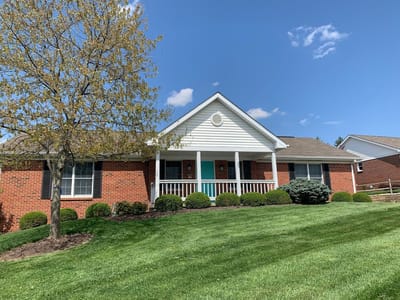

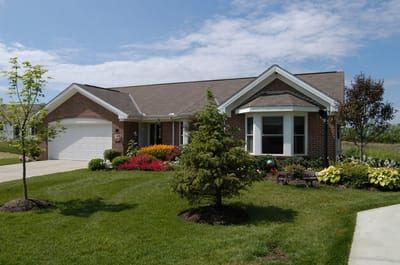
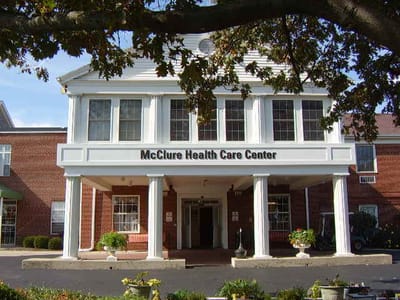
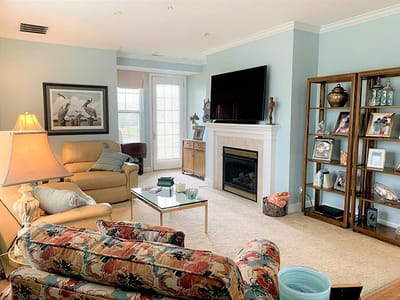
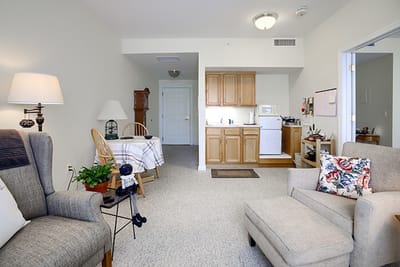
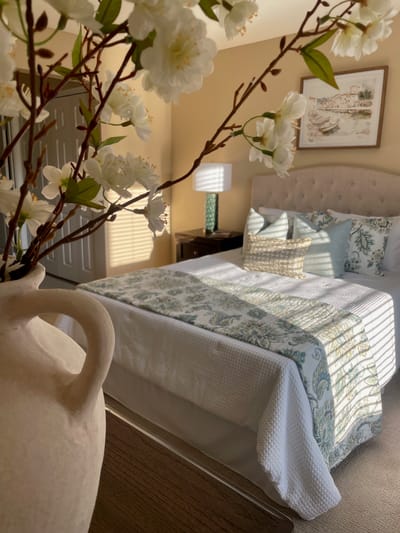
Explore an ultimately pleasant stay with Ohio Living Mount Pleasant located in the vibrant neighborhood of Britton Lane Monroe, OH, offering independent living and assisted living services. A wide array of spacious and cozy accommodations is available for its residents, ranging from ranch homes, to brownstones, and apartment homes. Having a highly trained and compassionate team, the community provides rehabilitation, skilled care, and long-term care. Their rehabilitation team is filled with registered nurses who oversee care 24 hours a day and includes other nursing teams, therapists, a case manager, and a social worker, to create a personalized plan for your recovery. When long-term care is needed, they provide compassionate nursing services with the highest quality of care
With its top-tier amenities and services, residents can enjoy restaurant-style dining services, a fitness center that is open 24/7, social activities such as movie nights, and more, they also partnered with partnered with Concierge at Home to provide services like deep-cleaning, laundry, and tech support, great outdoor spaces, and on-site security team that monitors the grounds 24/7 to ensure your safety. Meet new companions and create meaningful memories together within the beautiful spaces of this community. At Ohio Living Mount Pleasant, seniors can make the most out of their retirement.
| Staff type | Hours / Day / Resident | vs state avg |
|---|---|---|
|
Registered Nurse (RN)
| 50m per day | ▲ 31% State avg: 38m per day · National avg: 41m per day |
|
LPN / LVN
| 1h 25m per day | ▲ 47% State avg: 58m per day · National avg: 52m per day |
|
Nurse Aide
| 1h 42m per day | ▼ 20% State avg: 2h 8m per day · National avg: 2h 20m per day |
|
Weekend Total Nursing
| 4h 5m per day | ▲ 25% State avg: 3h 17m per day · National avg: 3h 26m per day |
|
Physical Therapist
| 10m per day | ▲ 235% State avg: 3m per day · National avg: 4m per day |
|
Weekend RN
| 29m per day | ▲ 16% State avg: 25m per day · National avg: 28m per day |
Ohio Living Mount Pleasant is administered by James Allred.
Key information about the people who lead and staff this community.
In Ohio, the Department of Health, Bureau of Survey and Certification conducts unannounced onsite inspections to evaluate the quality of care and environment in all licensed facilities.
Citations
| This Facility | OH Average | vs. OH Avg |
|---|---|---|---|
|
Total citations
| 1 | 2 | This facility has 50% fewer total citations than a typical Ohio nursing home (1 vs. OH avg 2).↓ 50% better |
Every two years, the Ohio Department of Aging and the Office of the State Long-Term Care Ombudsman organizations conduct a satisfaction survey among residents in long-term care facilities to assess their quality of care and life.
Ohio average: 86 / 100
Ohio average: 89 / 100
Ohio average: 95 / 100
Ohio average: 82 / 100
Ohio average: 86 / 100
Ohio average: 89 / 100
Ohio average: 80 / 100
Ohio average: 81 / 100
Based on the RCF Resident Satisfaction Survey 2022-23, Final Results
Have you gotten or are you getting physical therapy, occupational therapy or speech therapy, while living at this care facility?
This facility61/100
Ohio average46/100
Did (Does) the therapy help you meet your goals?
This facility85/100
Ohio average88/100
Can you decide how to spend your day?
This facility91/100
Ohio average94/100
Did (Do) you know who to speak to about your therapy progress?
This facility93/100
Ohio average85/100
Did (Do) the therapists help you set goals?
This facility100/100
Ohio average89/100
Scores represent percent of positive resident responses for each item, excluding "don't know" and "not applicable" responses and instances where the question was skipped.
Based on the RCF Resident Satisfaction Survey 2022-23, Final Results
Is it very clean here?
This facility87/100
Ohio average96/100
Are your personal items safe here?
This facility91/100
Ohio average92/100
Can you enjoy the outdoors if you want to?
This facility96/100
Ohio average91/100
Do you feel safe here?
This facility96/100
Ohio average98/100
Are you able to get around the building if you want to?
This facility96/100
Ohio average95/100
Do you feel you have enough privacy?
This facility100/100
Ohio average95/100
Is it easy for you to get around in your room (or apartment)?
This facility100/100
Ohio average96/100
Can you find a place to be alone if you want to be alone?
This facility100/100
Ohio average96/100
Scores represent percent of positive resident responses for each item, excluding "don't know" and "not applicable" responses and instances where the question was skipped.
Based on the RCF Resident Satisfaction Survey 2022-23, Final Results
Did you receive a thorough orientation to OHIO LIVING MOUNT PLEASANT?
This facility47/100
Ohio average70/100
Were you given enough information to learn how things work here?
This facility80/100
Ohio average82/100
Did you feel warmly welcomed as a new resident?
This facility100/100
Ohio average93/100
Scores represent percent of positive resident responses for each item, excluding "don't know" and "not applicable" responses and instances where the question was skipped.
Based on the RCF Resident Satisfaction Survey 2022-23, Final Results
Do the people who work here tell you when rules, policies, and procedures change?
This facility50/100
Ohio average78/100
Are you encouraged to speak up about things you don’t like here?
This facility73/100
Ohio average81/100
Are your concerns taken care of in a timely way?
This facility75/100
Ohio average86/100
Do the people who work here go above and beyond to give you a good life?
This facility77/100
Ohio average87/100
Are you as involved in decisions about your care as you want to be?
This facility83/100
Ohio average85/100
Do the people who work here seem happy to work here?
This facility86/100
Ohio average92/100
Are you friends with anyone who lives here?
This facility87/100
Ohio average81/100
Do the people who work here help you with technology, if needed?
This facility90/100
Ohio average89/100
Would you highly recommend OHIO LIVING MOUNT PLEASANT to someone who needs this type of care?
This facility91/100
Ohio average89/100
Overall, are you satisfied with the care you receive here?
This facility96/100
Ohio average94/100
Scores represent percent of positive resident responses for each item, excluding "don't know" and "not applicable" responses and instances where the question was skipped.
Based on the RCF Resident Satisfaction Survey 2022-23, Final Results
Do the people who work here check on you often enough to see if you need anything?
This facility64/100
Ohio average81/100
Do the people who care for you explain your care and services to you?
This facility71/100
Ohio average85/100
Do you feel confident the people who work here would come quickly anytime you needed help?
This facility74/100
Ohio average85/100
Do the same people take care of you most of the time?
This facility77/100
Ohio average84/100
Do the people who work here do things the way you want them done?
This facility78/100
Ohio average88/100
Do the people who work here ever get angry at you?
This facility91/100
Ohio average88/100
Are the people who work here knowledgeable about your medical conditions and treatments?
This facility91/100
Ohio average90/100
Do the people who work here make sure you are comfortable when they provide care or services?
This facility91/100
Ohio average95/100
Do you have opportunities to maintain your health and wellness, if you want?
This facility91/100
Ohio average92/100
Do the people who work here support you to do as much for yourself as you are able to do?
This facility100/100
Ohio average96/100
Do the people who work here do everything they can to protect you from getting sick?
This facility100/100
Ohio average94/100
Scores represent percent of positive resident responses for each item, excluding "don't know" and "not applicable" responses and instances where the question was skipped.
Based on the RCF Resident Satisfaction Survey 2022-23, Final Results
Are there enjoyable things to do on the weekends, if you want?
This facility40/100
Ohio average63/100
Do you have enough opportunities to go on outings and special events?
This facility61/100
Ohio average73/100
Are you as connected to the community as you want to be?
This facility67/100
Ohio average71/100
Do you have something to look forward to most days?
This facility74/100
Ohio average77/100
Do you have plenty of opportunities to do things that are meaningful to you?
This facility86/100
Ohio average83/100
Do you feel included in life here?
This facility86/100
Ohio average89/100
Do you like the activities here?
This facility91/100
Ohio average83/100
Do you usually enjoy how you spend your time?
This facility95/100
Ohio average87/100
Are you able to do the activities offered here, if you want?
This facility96/100
Ohio average93/100
Scores represent percent of positive resident responses for each item, excluding "don't know" and "not applicable" responses and instances where the question was skipped.
Based on the RCF Resident Satisfaction Survey 2022-23, Final Results
Does the menu change often enough?
This facility52/100
Ohio average77/100
Do you have input on the food that is served?
This facility57/100
Ohio average68/100
Do you like the food here?
This facility59/100
Ohio average81/100
Do you get enough fresh food options here?
This facility65/100
Ohio average81/100
Do you look forward to mealtimes?
This facility74/100
Ohio average80/100
Do you get enough to eat here?
This facility95/100
Ohio average95/100
Scores represent percent of positive resident responses for each item, excluding "don't know" and "not applicable" responses and instances where the question was skipped.
State average 6.7
Last Health inspection on Dec 2022
State average 30.9
State average 4.59
Health citations are formal notices following inspections when they fail to comply with safety and care standards.
8 of 10 citations resulted from standard inspections; and 2 of 10 resulted from complaint investigations.
State average: 0.3
State average: 0.9
Reporting period: October 1 – December 31, 2025 (Q4 2025). Source: CMS Payroll-Based Journal report.
Manages medical care and health needs.
Assists with medical care and medications.
Helps with daily care and mobility.
Total hours from contractors
1,377 contractor hours this quarter
| Certified Nursing Assistant | 14 | 0 | 14 | 4,444 | 92 | 100% | 8.8 |
| Licensed Practical Nurse | 11 | 0 | 11 | 3,698 | 92 | 100% | 9.8 |
| Registered Nurse | 4 | 0 | 4 | 1,191 | 78 | 85% | 10.8 |
| Clinical Nurse Specialist | 1 | 0 | 1 | 492 | 63 | 68% | 7.8 |
| Nurse Practitioner | 1 | 0 | 1 | 480 | 60 | 65% | 8 |
| Administrator | 1 | 0 | 1 | 472 | 59 | 64% | 8 |
| Respiratory Therapy Technician | 0 | 3 | 3 | 436 | 69 | 75% | 2.6 |
| Speech Language Pathologist | 0 | 3 | 3 | 356 | 63 | 68% | 3.6 |
| Physical Therapy Aide | 0 | 2 | 2 | 245 | 64 | 70% | 3.8 |
| Qualified Social Worker | 0 | 2 | 2 | 165 | 41 | 45% | 4 |
| Physical Therapy Assistant | 0 | 2 | 2 | 115 | 40 | 43% | 2.9 |
| Dietitian | 1 | 0 | 1 | 107 | 54 | 59% | 2 |
| Occupational Therapy Aide | 0 | 2 | 2 | 24 | 13 | 14% | 1.7 |
| Occupational Therapy Assistant | 0 | 1 | 1 | 20 | 15 | 16% | 1.3 |
| Medical Director | 0 | 1 | 1 | 17 | 15 | 16% | 1.1 |
Federal penalties imposed by CMS for regulatory violations, including civil money penalties (fines) and denials of payment for new Medicare/Medicaid admissions.
Source: CMS Penalties Database
No penalties in the past 3 years
No civil money penalties or payment denials were reported in the last 3 years.
These measures show how residents usually do over time at this home, based on health outcomes and preventive care.
Ohio average: 5.8
Ohio average: 12.7
Ohio average: 6.8%
Ohio average: 8.9%
Ohio average: 22.0%
Ohio average: 3.4%
Ohio average: 3.9%
Ohio average: 0.5%
Ohio average: 6.2%
Ohio average: 24.0%
Ohio average: 8.4%
Ohio average: 92.4%
Ohio average: 94.5%
Ohio average: 78.0%
Ohio average: 1.3%
Ohio average: 75.6%
Ohio average: 25.1%
Ohio average: 12.5%
Ohio average: 0.8%
Ohio average: 53.7%
Ohio average: 50.6%
Quality measures are calculated from Minimum Data Set (MDS) assessments. For most measures, lower percentages indicate better care quality.
38% of new residents, usually for short-term rehab.
60% of new residents, often for short stays.
2% of new residents, often for long-term daily care.
Source: CMS Long-Term Care Facility Characteristics (Data as of Jan 2026)
Residents meet regularly to discuss policies, care quality, and activities
State-approved Nurse Aide Training and Competency Evaluation Program on-site
Part of a Continuing Care Retirement Community offering multiple care levels
Organized group of residents that meets regularly to discuss facility policies, quality of life, and activities.
Data sourced from CMS Long-Term Care Facility Characteristics quarterly report. Payer mix reflects the current resident census by primary payment source.
Historical financial and operational data for Ohio Living Mount Pleasant from 2012–2024, based on CMS SNF Cost Reports.
Key figures below are for fiscal year ending in 06/2024.
Based on CMS SNF Cost Report for fiscal year ending in 06/2024.
Pets Allowed
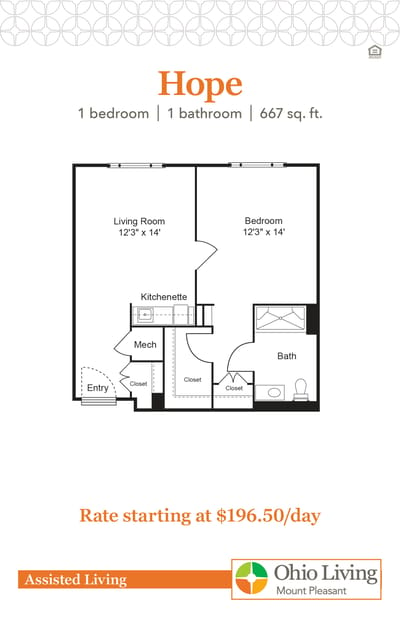
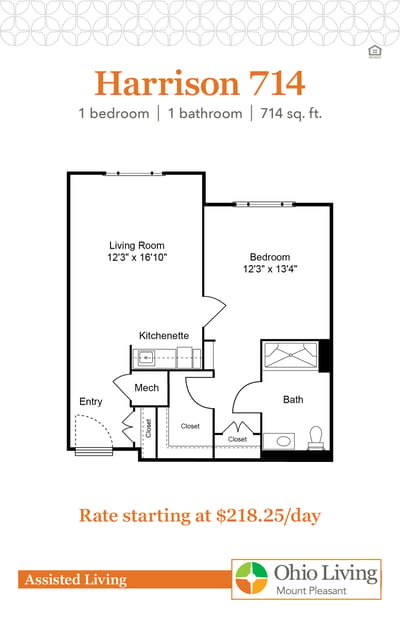
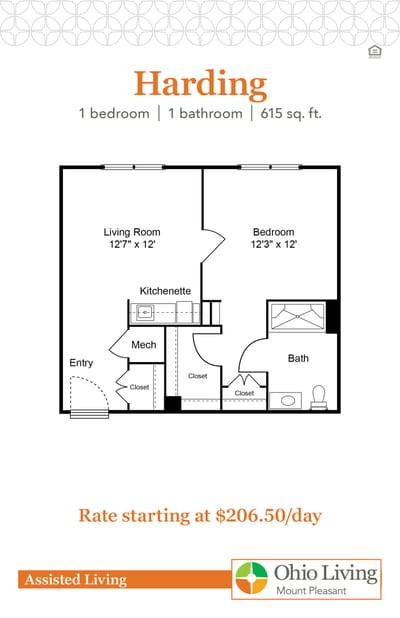
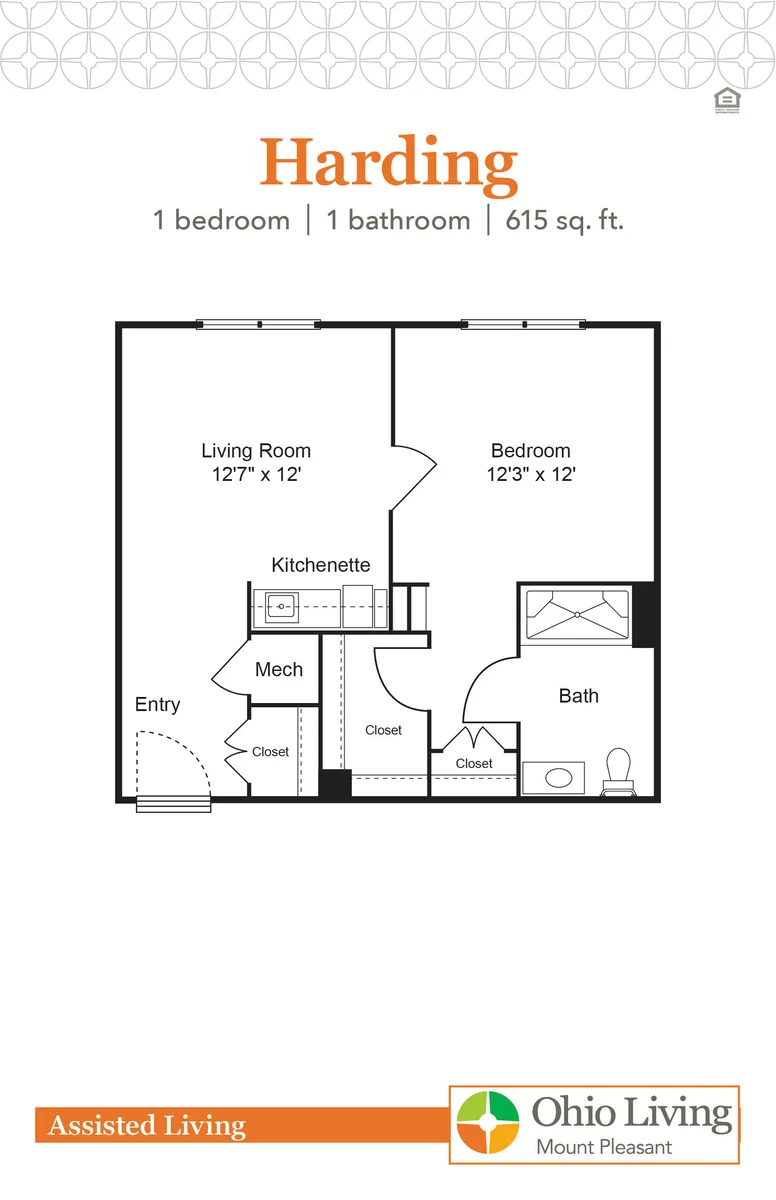
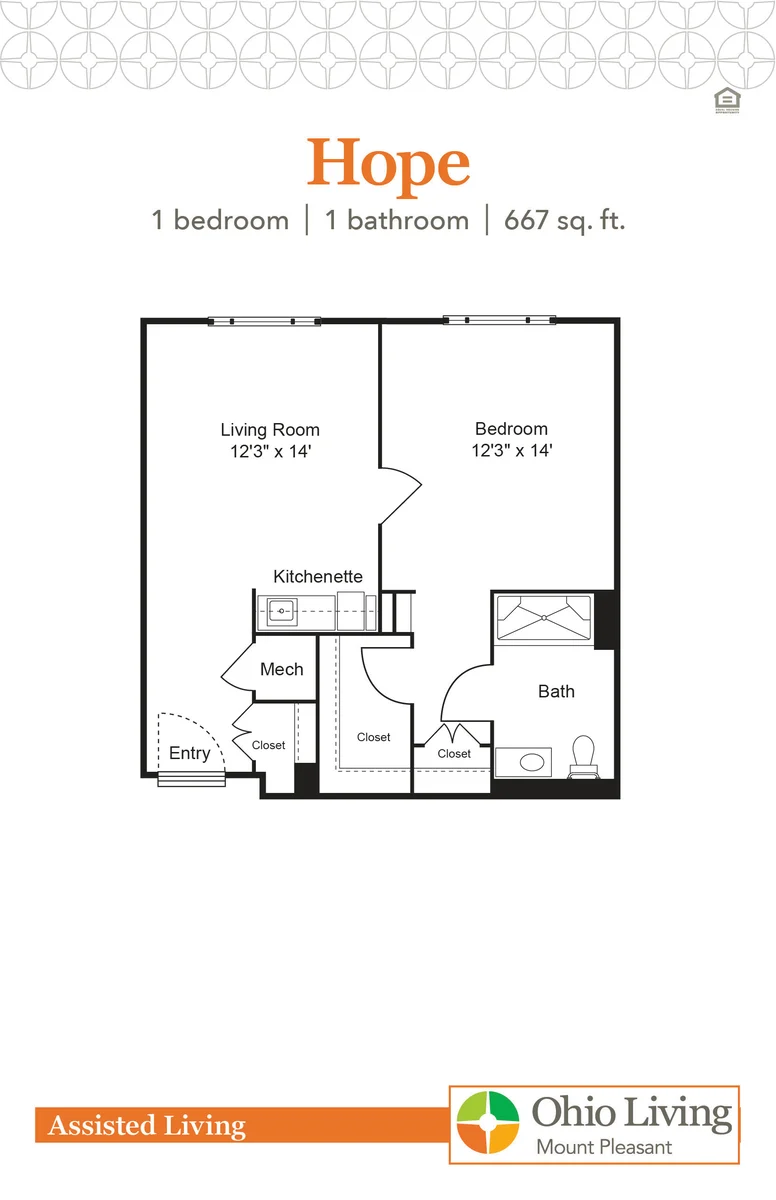
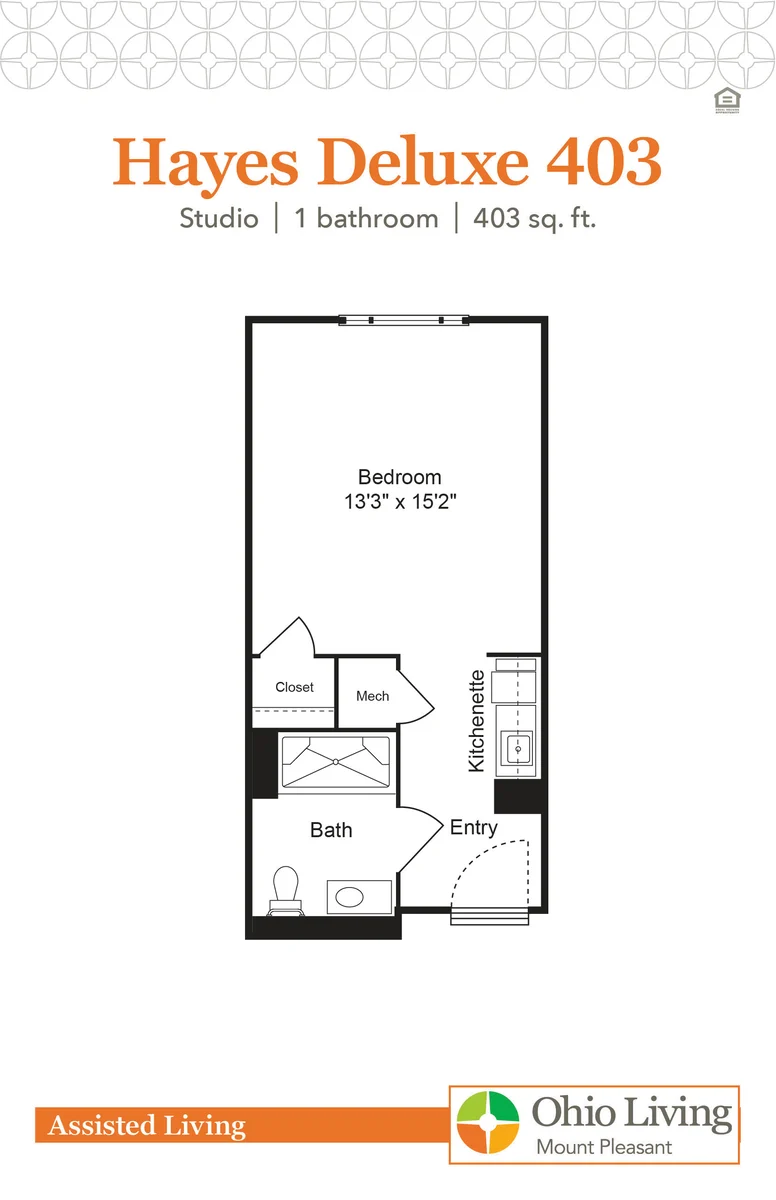
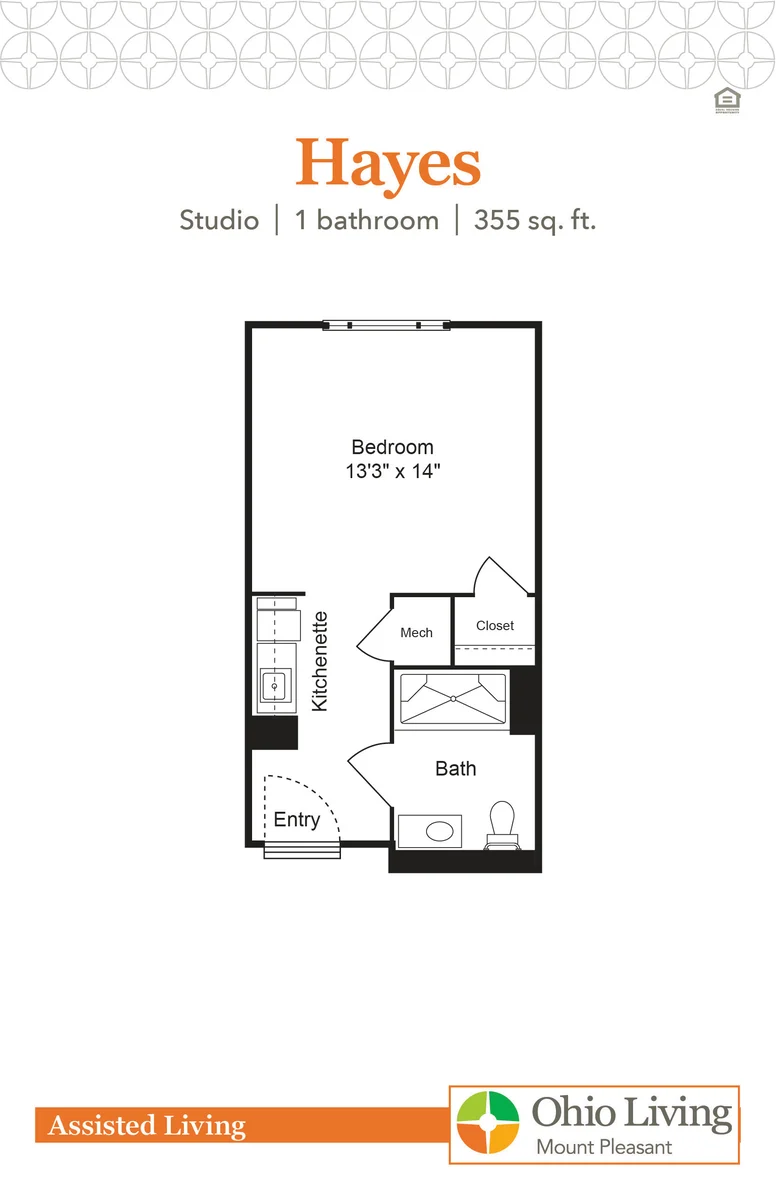
Room Sizes: 331 / 355 / 403 / 667-714
Housing Options: Studio / 1 Bed
Building Type: Two-story
Transportation Services
Residents typically stay for brief periods, with frequent admissions and discharges throughout the year.
Most new residents arrive under private pay (60% of admissions), and a typical private pay stay runs around 1 - 2 months.
Coverage residents most often arrive under.
Coverage residents most often leave under.
![]() 0.6 miles from city center
0.6 miles from city center
![]() Estimated distance in miles from Monroe's city center to Ohio Living Mount Pleasant's address, calculated via Google Maps.
Estimated distance in miles from Monroe's city center to Ohio Living Mount Pleasant's address, calculated via Google Maps.
Add your location
The information below is reported by the Ohio Department of Health, Bureau of Survey and Certification.
| Brookdale Westlake Village | NH AL IL MC SNF | Westlake | 60
Facility
60
OH AVG
75
Rank
#177 / 309 |
96.7%
Facility
96.7%
OH AVG
81.7
Rank
#4 / 138 | +18% | 4.38
Facility
4.38
OH AVG
3.54
Rank
#25 / 199 | +18% | +24% | $0
Facility
$0
OH AVG
$74.0k
Rank
#1 / 200 | 5
Facility
5
OH AVG
30.9
Rank
#10 / 199 | 1.3
Facility
1.3
OH AVG
4.6
Rank
#2 / 199 | - | 58 | A+ |
25
Facility
25
OH AVG
40
Rank
#500 / 704 | Labeed Diab | $20.1MFiscal year ending 12/2023
Facility
$20.1MFiscal year ending 12/2023
OH AVG
$10.1M
Rank
#74 / 199 | $10.2MFiscal year ending 12/2023
Facility
$10.2MFiscal year ending 12/2023
OH AVG
$3.9M
Rank
#14 / 199 | 50.8%Fiscal year ending 12/2023
Facility
50.8%Fiscal year ending 12/2023
OH AVG
40.2%
Rank
#6 / 199 | 366373 | ||||
| The Knolls of Oxford | NH AL IL MC SNF | Oxford | 50
Facility
50
OH AVG
75
Rank
#214 / 309 |
92.8%
Facility
92.8%
OH AVG
81.7
Rank
#25 / 138 | +14% | 4.09
Facility
4.09
OH AVG
3.54
Rank
#42 / 199 | -31% | +15% | $0
Facility
$0
OH AVG
$74.0k
Rank
#1 / 200 | 4
Facility
4
OH AVG
30.9
Rank
#4 / 199 | 2.0
Facility
2.0
OH AVG
4.6
Rank
#11 / 199 | - | 46 | - |
0
Facility
0
OH AVG
40
Rank
#686 / 704 | Ronald Beymer | $6.2MFiscal year ending 12/2023
Facility
$6.2MFiscal year ending 12/2023
OH AVG
$10.1M
Rank
#157 / 199 | $4.3MFiscal year ending 12/2023
Facility
$4.3MFiscal year ending 12/2023
OH AVG
$3.9M
Rank
#130 / 199 | 69.5%Fiscal year ending 12/2023
Facility
69.5%Fiscal year ending 12/2023
OH AVG
40.2%
Rank
#22 / 199 | 366282 | ||||
| Elizabeth Scott Community | NH AL MC SNF | Maumee | 60
Facility
60
OH AVG
75
Rank
#177 / 309 |
86.7%
Facility
86.7%
OH AVG
81.7
Rank
#68 / 138 | +6% | 3.52
Facility
3.52
OH AVG
3.54
Rank
#95 / 199 | -64% | -1% | $0
Facility
$0
OH AVG
$74.0k
Rank
#1 / 200 | 9
Facility
9
OH AVG
30.9
Rank
#22 / 199 | 2.3
Facility
2.3
OH AVG
4.6
Rank
#17 / 199 | - | 52 | A+ |
0
Facility
0
OH AVG
40
Rank
#686 / 704 | Elizabeth Scott, Inc | $6.7MFiscal year ending 12/2023
Facility
$6.7MFiscal year ending 12/2023
OH AVG
$10.1M
Rank
#140 / 199 | $3.2MFiscal year ending 12/2023
Facility
$3.2MFiscal year ending 12/2023
OH AVG
$3.9M
Rank
#129 / 199 | 48%Fiscal year ending 12/2023
Facility
48%Fiscal year ending 12/2023
OH AVG
40.2%
Rank
#58 / 199 | 366184 | ||||
| Locust Ridge | NH MC RC SNF | Williamsburg | 61
Facility
61
OH AVG
75
Rank
#174 / 309 |
90.2%
Facility
90.2%
OH AVG
81.7
Rank
#42 / 138 | +10% | 4.46
Facility
4.46
OH AVG
3.54
Rank
#21 / 199 | +35% | +26% | $0
Facility
$0
OH AVG
$74.0k
Rank
#1 / 200 | 18
Facility
18
OH AVG
30.9
Rank
#51 / 199 | 4.5
Facility
4.5
OH AVG
4.6
Rank
#117 / 199 | - | 55 | A+ |
0
Facility
0
OH AVG
40
Rank
#686 / 704 | Gary Vannostrand | $5.9MFiscal year ending 12/2023
Facility
$5.9MFiscal year ending 12/2023
OH AVG
$10.1M
Rank
#168 / 199 | $2.7MFiscal year ending 12/2023
Facility
$2.7MFiscal year ending 12/2023
OH AVG
$3.9M
Rank
#161 / 199 | 45.2%Fiscal year ending 12/2023
Facility
45.2%Fiscal year ending 12/2023
OH AVG
40.2%
Rank
#40 / 199 | 365336 | ||||
| Ohio Living Mount Pleasant | NH AL IL MC SNF | Monroe (Britton Lane) | 53
Facility
53
OH AVG
75
Rank
#208 / 309 | - | - | 3.47
Facility
3.47
OH AVG
3.54
Rank
#95 / 199 | -11% | -2% | $0
Facility
$0
OH AVG
$74.0k
Rank
#1 / 200 | 10
Facility
10
OH AVG
30.9
Rank
#24 / 199 | 5.0
Facility
5.0
OH AVG
4.6
Rank
#140 / 199 | 1 | 73 | - |
44
Facility
44
OH AVG
40
Rank
#322 / 704 | Donald Edwards | $4.4MFiscal year ending 06/2024
Facility
$4.4MFiscal year ending 06/2024
OH AVG
$10.1M
Rank
#167 / 199 | $2.4MFiscal year ending 06/2024
Facility
$2.4MFiscal year ending 06/2024
OH AVG
$3.9M
Rank
#193 / 199 | 54.7%Fiscal year ending 06/2024
Facility
54.7%Fiscal year ending 06/2024
OH AVG
40.2%
Rank
#187 / 199 | 365358 |
Ohio Living Mount Pleasant is in the Britton Lane neighborhood of Monroe.
Tamara Kilmer is the Director of Nursing at Ohio Living Mount Pleasant.
Ohio Living Mount Pleasant has a walk score of 44. Somewhat walkable. A few nearby services may be reachable on foot, but most trips require transportation.
Ohio Living Mount Pleasant's occupancy is 100%.
Yes, Ohio Living Mount Pleasant allows residents to bring their pets.
The team at Ohio Living Mount Pleasant can be reached at SKAPPERS@OHIOLIVING.ORG.
Ohio Living Mount Pleasant is registered as a for-profit in OH.
Care Cost Calculator: See Prices in Your Area
Nursing Home Data Explorer
Don’t Wait Too Long: 7 Red Flag Signs Your Parent Needs Assisted Living Now
The True Cost of Assisted Living in 2025 – And How Families Are Paying For It
Understanding Senior Living Costs: Pricing Models, Discounts & Financial Assistance


