Parker Place Gracious Retirement Living
Nursing Home & Independent Living · Mentor, OH
CMS overall rating Info CMS (the Centers for Medicare & Medicaid Services) is the federal agency that rates nursing home quality. Its Overall Rating runs from 1 to 5 stars, combining health inspections, staffing, and quality measures, with inspections weighted most heavily.

Parker Place Gracious Retirement Living

Nursing Home & Independent Living · Mentor, OH
CMS overall rating Info CMS (the Centers for Medicare & Medicaid Services) is the federal agency that rates nursing home quality. Its Overall Rating runs from 1 to 5 stars, combining health inspections, staffing, and quality measures, with inspections weighted most heavily.
Calculator: See prices in your area
Parker Place Gracious Retirement Living accepts Medicare, Medicaid, and private pay.

Overview of Parker Place Gracious Retirement Living

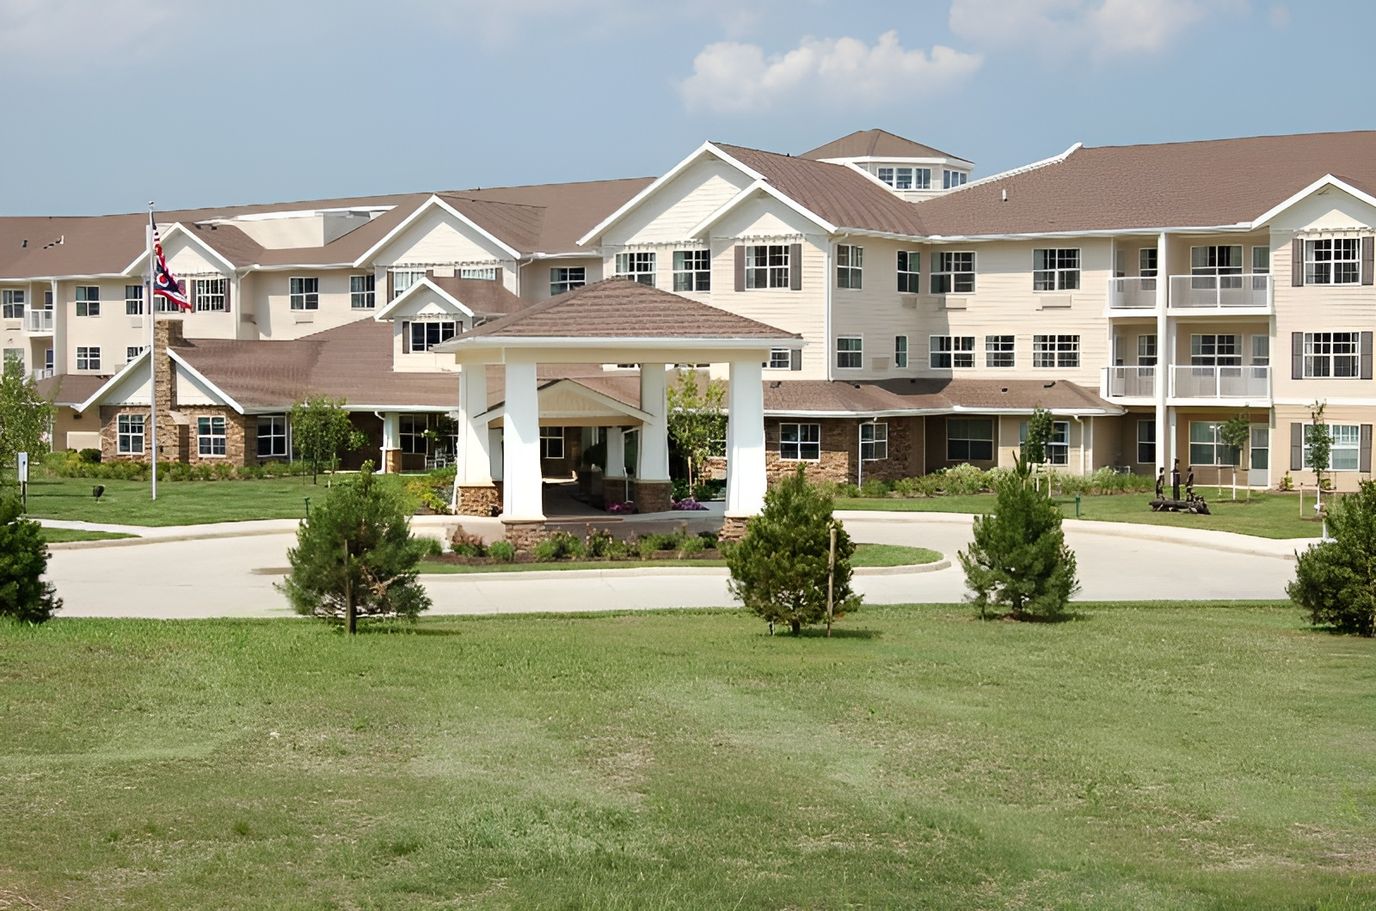
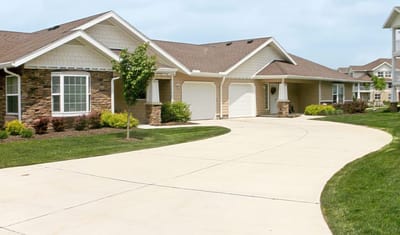
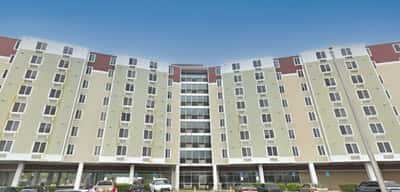
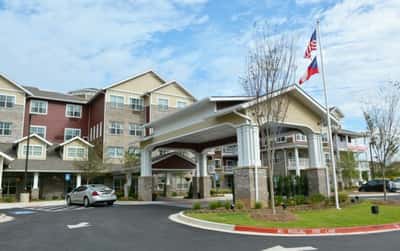
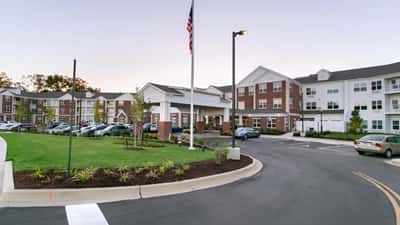
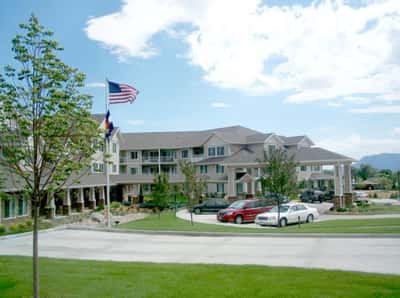
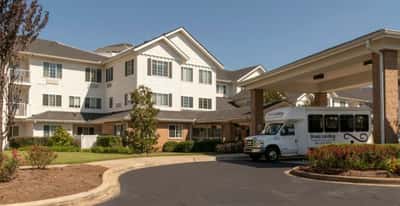
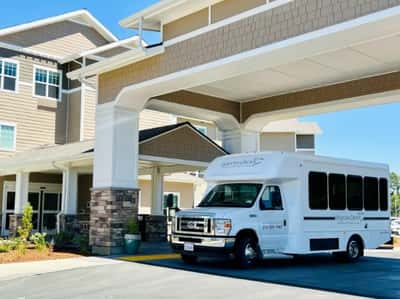
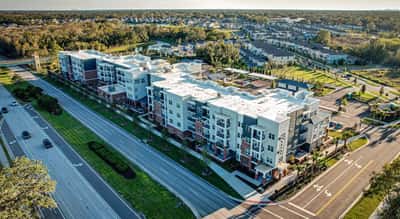
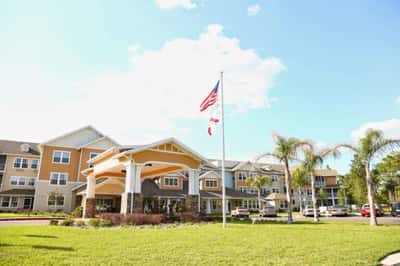
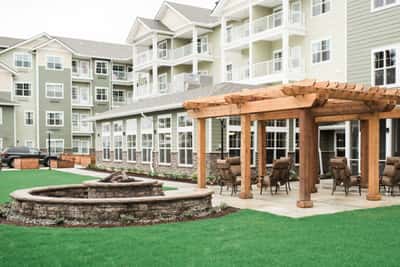
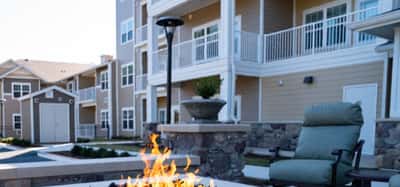
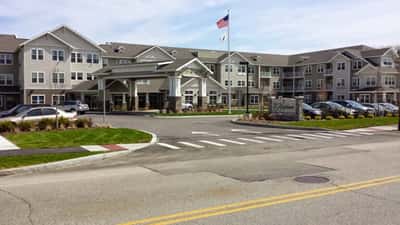
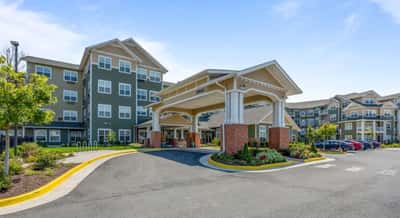
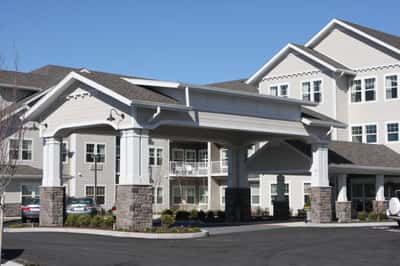
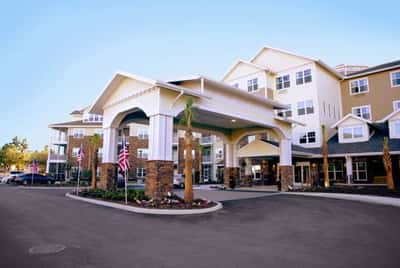
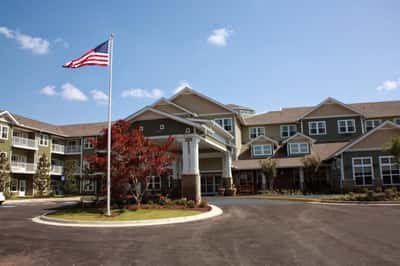
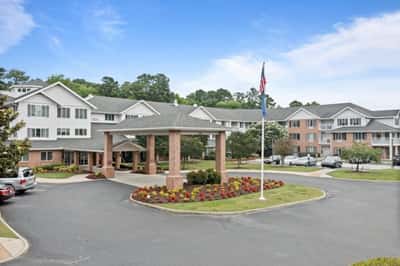
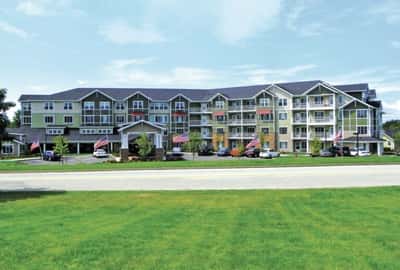
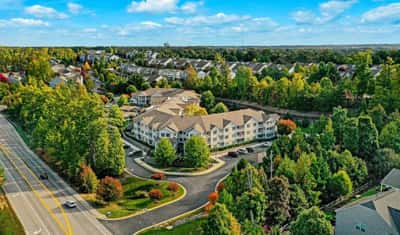
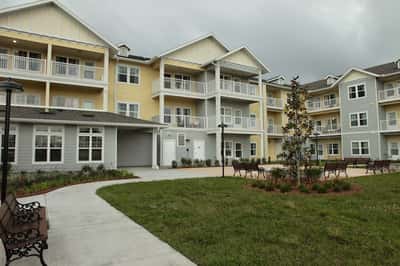
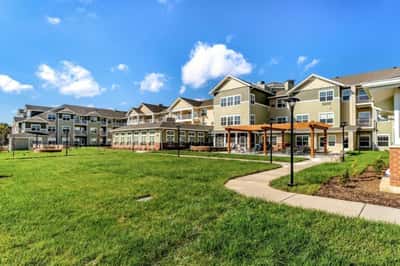
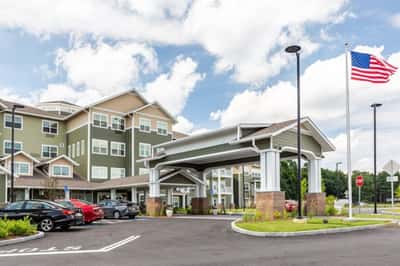
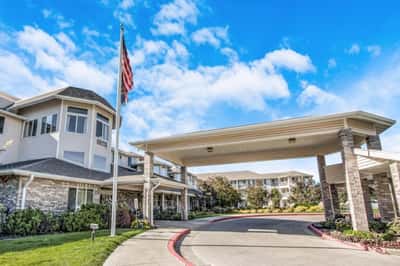
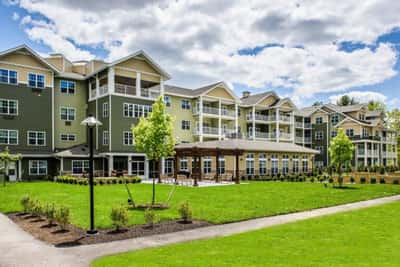
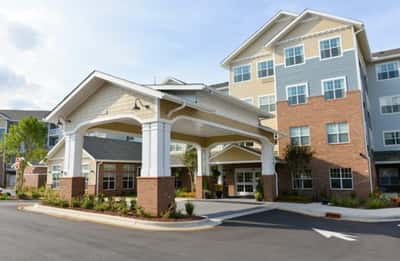
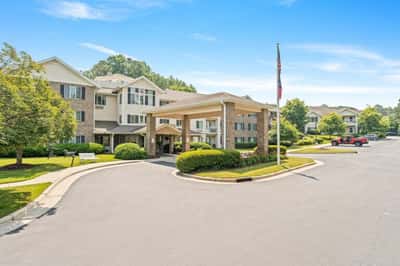
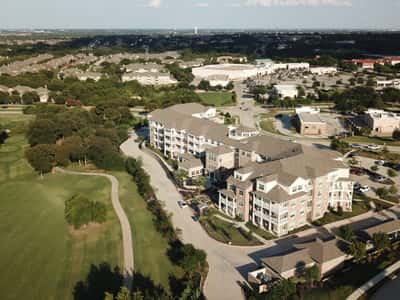
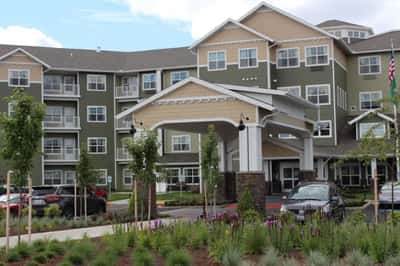
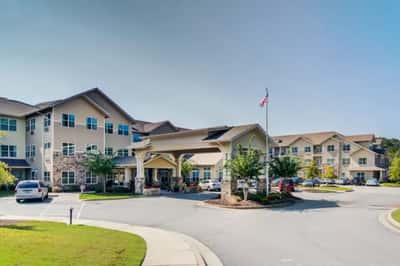
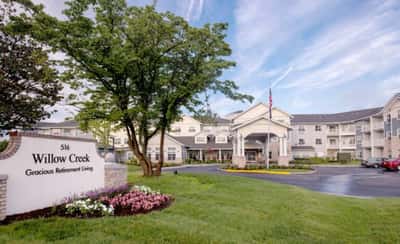
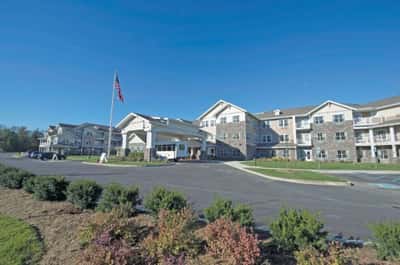
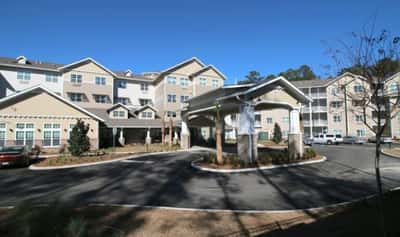
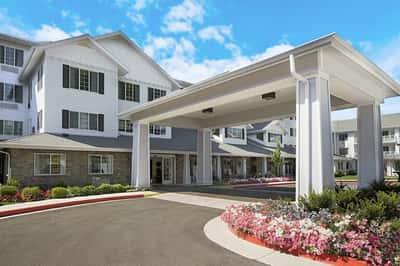
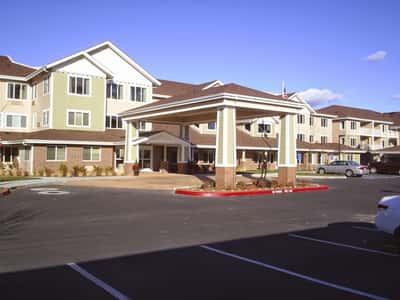
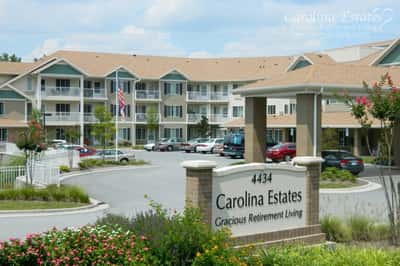
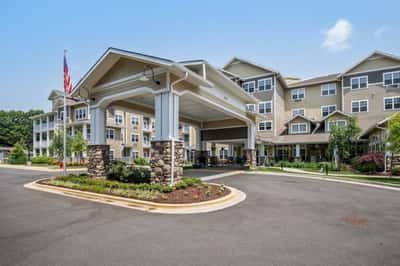
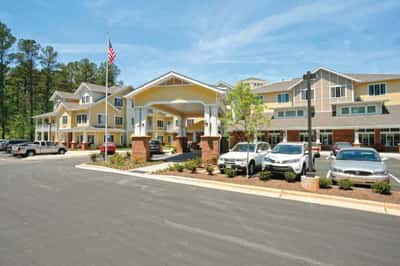
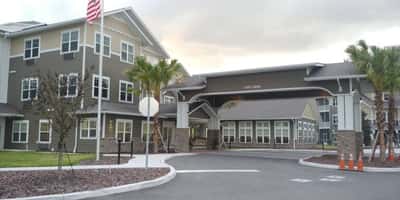
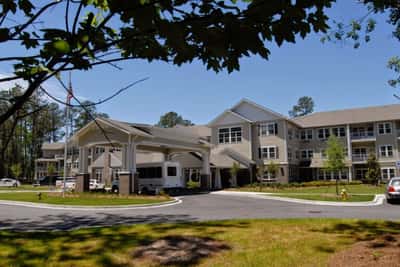
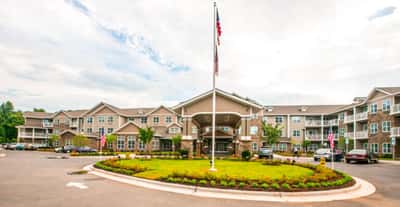
Hawthorn Senior Living operates Parker Place Gracious Retirement Living out of a three-story building at 7960 Center Street in Mentor’s Newell Creek neighborhood, 0.9 miles from the city center. The community carries both nursing home and independent living designations and is CMS-certified, accepting Medicare, Medicaid, and private pay. At 167 licensed beds and 97 current residents, it operates with meaningful open capacity, with an average stay of 115 days pointing toward a largely short-term population.

Total nursing coverage runs 3 hours and 11 minutes per resident per day. An active resident council gives residents a structured channel for input on facility policies and daily life.

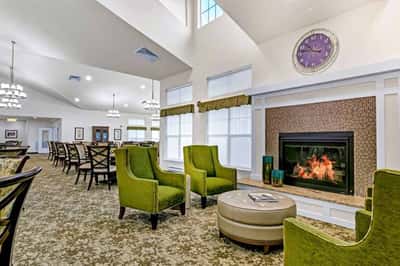
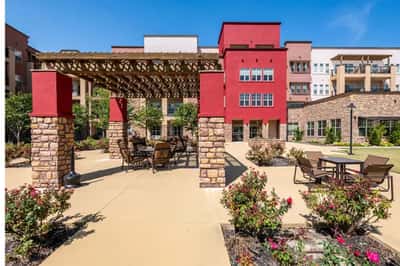
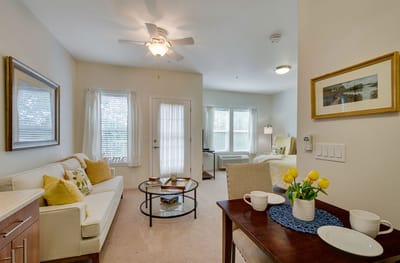
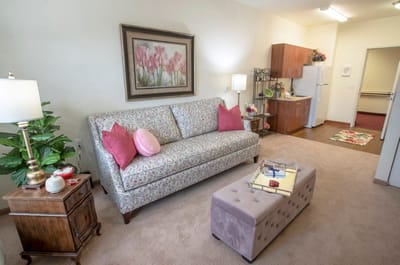
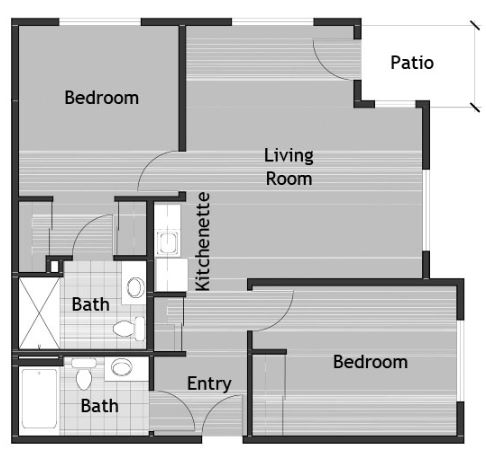
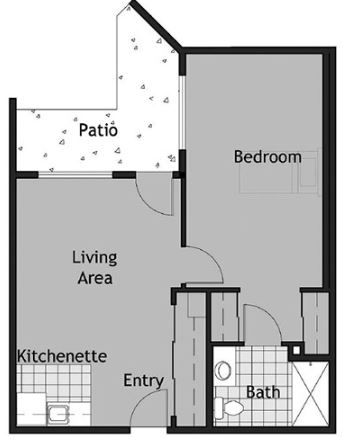
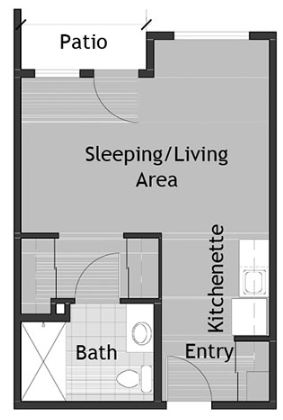
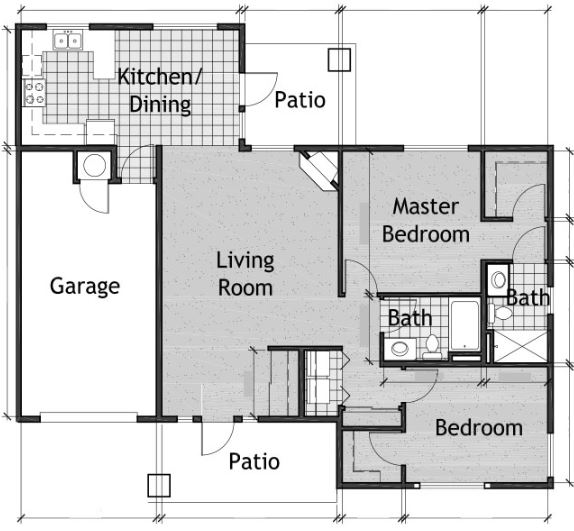
Floor plans run from studios to two-bedroom cottages across a substantial size range. Pets are welcome. Transportation, exercise programs, recreational activities, and housekeeping are confirmed on-site services.

Walk Score 5 means the surrounding area is essentially car-dependent. The location is convenient to Mentor’s center by car, but visitors and residents on foot will find few options within walking distance.

Parker Place is a mid-size, CMS-certified nursing home and independent living community under Hawthorn Senior Living’s management, suited to families in the Mentor area seeking a combination of short-term skilled care and independent living options with full Medicare and Medicaid acceptance.

(440) 255-0828

Quality ratings

Measured by Centers for Medicare & Medicaid Services (CMS)

Overall rating Info The Overall CMS Rating combines results from health inspections, staffing levels and quality measures. Health inspections carry the most weight. Staffing and quality scores can increase or decrease the final rating based on performance compared to state and national standards.
▼ 37.1% Below OH avg. ▼ 37.1% Below OH avg.OH average: 3.2Click the badge to see the full State ranking.Click here to see the full State ranking.
Health Inspection Info Based on the results of the facility's three most recent standard inspections and any complaint investigations. CMS reviews the number, scope, and severity of deficiencies, with more recent findings weighted more heavily.
▲ 7.1% Above OH avg. ▲ 7.1% Above OH avg.OH average: 2.8Click the badge to see the full State ranking.Click here to see the full State ranking.
Staffing Info Measures average nursing staff hours per resident per day, including Registered Nurses (RNs) and total nursing staff. Ratings are adjusted based on the level of care residents require and are compared to state and national benchmarks.
▼ 59.1% Below OH avg. ▼ 59.1% Below OH avg.OH average: 2.4Click the badge to see the full State ranking.Click here to see the full State ranking.
Quality Measures Info Based on clinical and physical health indicators reported to CMS, such as hospital readmissions, falls, pressure ulcers, and improvements in mobility. These measures reflect how well residents' health needs are being managed.
▼ 8.2% Below OH avg. ▼ 8.2% Below OH avg.OH average: 4.4Click the badge to see the full State ranking.Click here to see the full State ranking.

Staffing hours breakdown

Info Daily nursing hours per resident by staff type, reported to CMS. Higher is generally better — compare this facility to state and national averages to see where staffing stands.

Hours per resident per day — compared to Ohio state averages

Total nursing care / resident Info This home is ranked 150th out of 210 homes in Ohio for nurse hours. Total adjusted nursing hours per resident per day, combining RN, LPN, and aide time. CMS adjusts this for case-mix so facilities can be fairly compared.
3h 11m per day
Rank #150 / 210Nurse hours — State benchmarkedThis home is ranked 150th out of 210 homes in Ohio. Shows adjusted nurse hours per resident per day benchmarked to the Ohio average, with a ranking across 210 Ohio facilities. More hours mean more direct care. The national average is about 3.5 hrs; below 3.0 is a red flag.Rankings are based only on facilities in Ohio that report data for that category. Facilities without available data are excluded from the ranking.Click the rank badge to see the full State ranking.Click here to see the full State ranking.
This facility Ohio avg (3h 32m per day)
vs Ohio avg
-10%

5 of 6 metrics below state avg

Standout metric Physical Therapist is +7% above state avg
Staff typeHours / Day / Residentvs state avg
Registered Nurse (RN) Info RNs hold the highest nursing license and can assess residents, interpret test results, and direct care plans. More RN hours per day often signals stronger clinical oversight and faster response to health changes. 29m per day ▼ 24% State avg: 38m per day · National avg: 41m per day
LPN / LVN Info Licensed Practical Nurses (LPNs) or Licensed Vocational Nurses (LVNs) deliver routine hands-on care — medication administration, wound dressing, and monitoring vital signs. They work under RN supervision and make up a large share of daily bedside care. 44m per day ▼ 25% State avg: 58m per day · National avg: 52m per day
Nurse Aide Info Certified Nurse Aides (CNAs) provide the most direct day-to-day assistance: bathing, dressing, feeding, and mobility. Nurse aide hours are typically the largest staffing category and directly affect residents' quality of life. 1h 54m per day ▼ 11% State avg: 2h 7m per day · National avg: 2h 20m per day
Weekend Total Nursing Info Combined nursing hours (RN + LPN + Nurse Aide) per resident per day on weekends. Staffing often drops on weekends — this figure reveals whether the facility maintains adequate coverage outside of weekday hours. 2h 50m per day ▼ 15% State avg: 3h 20m per day · National avg: 3h 27m per day
Physical Therapist Info Hours per resident per day provided by licensed Physical Therapists (PTs) or PT Assistants. PT services help residents recover mobility after injury or illness and are especially important for post-acute (short-stay) rehabilitation. 3m per day ▲ 7% State avg: 3m per day · National avg: 4m per day
Weekend RN Info Registered nurse hours specifically on weekends. Facilities sometimes reduce RN presence on Saturdays and Sundays — a low weekend RN figure compared to weekday hours can indicate reduced clinical oversight when most administrative staff are absent. 20m per day ▼ 20% State avg: 25m per day · National avg: 29m per day

Capacity and availability

This home usually has availability

Lower occupancy than the Ohio average: 78.7%
Occupancy rate
60.1% Rank #190 / 211Occupancy rate — State benchmarkedThis home is ranked 190th out of 211 homes in Ohio. Shows this facility's occupancy rate versus the Ohio average, with its Statewide rank out of 211. Higher occupancy signals strong local demand and financial stability.Rankings are based only on facilities in Ohio that report data for that category. Facilities without available data are excluded from the ranking.Click the rank badge to see the full State ranking.Click here to see the full State ranking.
Avg. Length of Stay
115 days
Bed community size
147-bed community Rank #24 / 323Bed count — State benchmarkedThis home is ranked 24th out of 323 homes in Ohio. Shows this facility's certified or reported bed count compared to other Ohio facilities. Larger communities may offer more amenities, programs, and on-site services for residents and families.Rankings are based only on facilities in Ohio that report data for that category. Facilities without available data are excluded from the ranking.Click the rank badge to see the full State ranking.Click here to see the full State ranking.
A larger shared setting that may offer more common spaces and organized community services.
Walk Score
Walk Score: 5 / 100 Rank #649 / 705Walk Score — State benchmarkedThis home is ranked 649th out of 705 homes in Ohio. Shows how walkable this facility's neighborhood is compared to the average Walk Score across Ohio facilities. Higher scores benefit residents, families, and staff.Rankings are based only on facilities in Ohio that report data for that category. Facilities without available data are excluded from the ranking.Click the rank badge to see the full State ranking.Click here to see the full State ranking.
Car-dependent. Most errands require a car, with limited nearby walkable options.

Contact Parker Place Gracious Retirement Living

Staffing Data

Reporting period: October 1 – December 31, 2025 (Q4 2025). Source: CMS Payroll-Based Journal report.

Total staff 262
Employees 138
Contractors 124
Staff to resident ratio 2.70 : 1
33% more staff per resident than Ohio average
Ohio average ratio: 2.04 : 1 Ohio average ratio: 2.04 : 1See full Ohio ranking
Avg staff/day 54
Average shift 7.4 hours
9% worse than Ohio average
Ohio average: 8.1 hours Ohio average shift: 8.1 hoursSee full Ohio ranking
Total staff hours (quarter) 36,679

Nursing staff breakdown

Q4 2025 · Oct 1 – Dec 31 More info This data comes from the CMS Payroll-Based Journal report covering October 1 – December 31, 2025.
Registered Nurse

Manages medical care and health needs.

RN Staff Info 32 total: 13 full-time employees and 19 contractors. 32
Average shift length Info Average shift length. Calculated as total hours divided by days worked and average staff per day. 7.2 hours
Licensed Practical Nurse

Assists with medical care and medications.

LPN Staff Info 46 total: 23 full-time employees and 23 contractors. 46
Average shift length Info Average shift length. Calculated as total hours divided by days worked and average staff per day. 8.5 hours
Certified Nursing Assistant

Helps with daily care and mobility.

CNA Staff Info 138 total: 76 full-time employees and 62 contractors. 138
Average shift length Info Average shift length. Calculated as total hours divided by days worked and average staff per day. 7.4 hours

Contractor staffing

Q4 2025 · Oct 1 – Dec 31 More info This data comes from the CMS Payroll-Based Journal report covering October 1 – December 31, 2025.

Total hours from contractors

10.2%

3,741 contractor hours this quarter

Certified Nursing Assistant: 62 Licensed Practical Nurse: 23 Registered Nurse: 19 Feeding Assistant: 9 Other Physician: 5 Physician Assistant: 2 Respiratory Therapy Technician: 1 Medical Director: 1 Occupational Therapy Aide: 1 Occupational Therapy Assistant: 1

Staff by category

Q4 2025 · Oct 1 – Dec 31 More info This data comes from the CMS Payroll-Based Journal report covering October 1 – December 31, 2025.
Certified Nursing Assistant766213818,33792100%7.4
Licensed Practical Nurse2323467,01592100%8.5
Registered Nurse1319323,26592100%7.2
Other Dietary Services Staff2021,0588188%7.8
Clinical Nurse Specialist2029378188%6.5
Feeding Assistant0998836571%5.7
Respiratory Therapy Technician5165507177%6.3
Physical Therapy Assistant4045416773%6.2
Dietitian1015126470%8
Administrator2025006470%7.8
Qualified Social Worker1014966267%8
Nurse Practitioner1014485661%8
Dental Services Staff1014176368%6.6
Speech Language Pathologist1014166571%6.4
Occupational Therapy Aide1123574145%7.6
Physical Therapy Aide2022773942%6.8
Other Physician0552275459%3.4
Mental Health Service Worker2021922426%8
Physician Assistant0221295155%2.5
Qualified Activities Professional101901213%7.5
Medical Director011262628%1
Occupational Therapy Assistant011822%4
138 Certified Nursing Assistant
% of Days 100%
46 Licensed Practical Nurse
% of Days 100%
32 Registered Nurse
% of Days 100%
2 Other Dietary Services Staff
% of Days 88%
2 Clinical Nurse Specialist
% of Days 88%
9 Feeding Assistant
% of Days 71%
6 Respiratory Therapy Technician
% of Days 77%
4 Physical Therapy Assistant
% of Days 73%
1 Dietitian
% of Days 70%
2 Administrator
% of Days 70%
1 Qualified Social Worker
% of Days 67%
1 Nurse Practitioner
% of Days 61%
1 Dental Services Staff
% of Days 68%
1 Speech Language Pathologist
% of Days 71%
2 Occupational Therapy Aide
% of Days 45%
2 Physical Therapy Aide
% of Days 42%
5 Other Physician
% of Days 59%
2 Mental Health Service Worker
% of Days 26%
2 Physician Assistant
% of Days 55%
1 Qualified Activities Professional
% of Days 13%
1 Medical Director
% of Days 28%
1 Occupational Therapy Assistant
% of Days 2%

Penalties and fines

Federal penalties imposed by CMS for regulatory violations, including civil money penalties (fines) and denials of payment for new Medicare/Medicaid admissions.

Source: CMS Penalties Database

No penalties in the past 3 years

No civil money penalties or payment denials were reported in the last 3 years.

Quality of care over time

These measures show how residents usually do over time at this home, based on health outcomes and preventive care.

High-risk clinical events score Info A composite score based on pressure ulcers, falls with injury, weight loss, walking ability decline, and activities of daily living decline. 8.6
47% worse than Ohio average

Ohio average: 5.8

Functional decline score Info A composite score based on activities of daily living decline, walking ability decline, and incontinence. 18.4
45% worse than Ohio average

Ohio average: 12.7

Long-stay resident measures
Need for Help with Daily Activities Increased Info Percent of long-stay residents whose need for help with daily activities has increased 6.6%
In line with Ohio average

Ohio average: 6.8%

Walking Ability Worsened Info Percent of long-stay residents whose ability to move independently worsened 16.8%
88% worse than Ohio average

Ohio average: 8.9%

Low Risk Residents with Bowel/Bladder Incontinence Info Percent of low risk long-stay residents who lose control of their bowels or bladder 31.9%
45% worse than Ohio average

Ohio average: 22.0%

Falls with Major Injury Info Percent of long-stay residents experiencing one or more falls with major injury 2.8%
18% better than Ohio average

Ohio average: 3.4%

High Risk Residents with Pressure Ulcers Info Percent of long-stay high risk residents with pressure ulcers 11.4%
194% worse than Ohio average

Ohio average: 3.9%

Urinary Tract Infection Info Percent of long-stay residents with a urinary tract infection 0.0%
100% better than Ohio average

Ohio average: 0.5%

Lost Too Much Weight Info Percent of long-stay residents who lose too much weight 5.4%
14% better than Ohio average

Ohio average: 6.2%

Depressive Symptoms Info Percent of long-stay residents who have depressive symptoms 9.5%
60% better than Ohio average

Ohio average: 24.0%

Antipsychotic Use Info Percent of long-stay residents who received an antipsychotic medication 7.7%
9% better than Ohio average

Ohio average: 8.4%

Pneumococcal Vaccine Info Percent of long-stay residents assessed and appropriately given the pneumococcal vaccine 89.3%
In line with Ohio average

Ohio average: 92.4%

Influenza Vaccine Info Percent of long-stay residents assessed and appropriately given the seasonal influenza vaccine 95.0%
In line with Ohio average

Ohio average: 94.5%

Short-stay resident measures
Pneumococcal Vaccine Info Percent of short-stay residents assessed and appropriately given the pneumococcal vaccine 38.7%
50% worse than Ohio average

Ohio average: 78.0%

Antipsychotic medication increase Info Percent of short-stay residents who newly received an antipsychotic medication 1.0%
25% better than Ohio average

Ohio average: 1.3%

Influenza Vaccine Info Percent of short-stay residents assessed and appropriately given the seasonal influenza vaccine 47.5%
37% worse than Ohio average

Ohio average: 75.6%

Breakdown by payment type

Medicare

24% of new residents, usually for short-term rehab.

Typical stay 25 days

Private pay

65% of new residents, often for short stays.

Typical stay 4 - 5 months

Medicaid

11% of new residents, often for long-term daily care.

Typical stay 8 - 9 months

Facility Characteristics

Source: CMS Long-Term Care Facility Characteristics (Data as of Jan 2026)

Total residents 97
Medicare
15
15.5% of residents
Medicaid
79
81.4% of residents
Private pay or other
3
3.1% of residents
Programs & Services
Residents Group

Residents meet regularly to discuss policies, care quality, and activities

Active Resident Council

Organized group of residents that meets regularly to discuss facility policies, quality of life, and activities.

Finances and operations

Based on CMS SNF Cost Report for fiscal year ending in 12/2023.

Privately-owned community
Operated by a single business entity.
Net patient revenue Info Net patient revenue — what the home actually collects for resident care, after contractual allowances, bad debt and discounts are subtracted from its gross charges (CMS cost report, Worksheet G-3). It covers resident care only; money the home earns from other sources is shown separately as "Other income."
$5.9M
Net patient income Info Net patient income: net patient revenue minus the home's total operating expenses. A positive figure means it earns more from resident care than it spends to deliver it; a negative figure means the opposite. It excludes non-operating "other income."
-$1.1M
Privately-owned community Operated by a single business entity.
Net patient revenue Info Net patient revenue — what the home actually collects for resident care, after contractual allowances, bad debt and discounts are subtracted from its gross charges (CMS cost report, Worksheet G-3). It covers resident care only; money the home earns from other sources is shown separately as "Other income."
$5.9M Rank #92 / 210Revenue — State benchmarkedThis home is ranked 92nd out of 210 homes in Ohio. Shows this facility's annual revenue compared to the Ohio average. Higher revenue generally means more resources for staffing and capital — read alongside Payroll %.Rankings are based only on facilities in Ohio that report data for that category. Facilities without available data are excluded from the ranking.Click the rank badge to see the full State ranking.Click here to see the full State ranking.
Net patient income Info Net patient income: net patient revenue minus the home's total operating expenses. A positive figure means it earns more from resident care than it spends to deliver it; a negative figure means the opposite. It excludes non-operating "other income."
-$1.1M
Other income Info Money the home earns outside of resident care — such as investments, grants, rentals and other non-operating sources (CMS cost report, Worksheet G-3). It is tracked separately from net patient revenue: it is not part of that figure, and it is not included in net patient income.
$106.2K
Payroll costs Info Staff salaries plus wage-related costs — benefits such as payroll taxes, health insurance and retirement — from the home's own accounting records (CMS cost report, Worksheet A). Contract or agency labor is counted separately, under other operating costs. Rank #164 / 210Payroll — State benchmarkedThis home is ranked 164th out of 210 homes in Ohio. Shows total annual staff payroll benchmarked to the Ohio average. Higher payroll investment relative to peers often signals better staffing and less reliance on cheaper contract labor.Rankings are based only on facilities in Ohio that report data for that category. Facilities without available data are excluded from the ranking.Click the rank badge to see the full State ranking.Click here to see the full State ranking.
$2.9M 48.8% of net patient revenue Info Payroll as a share of revenue: staff salaries and wage-related benefits divided by net patient revenue. A higher figure means more of each revenue dollar goes to staff pay. Rank #203 / 210Payroll % — State benchmarkedThis home is ranked 203rd out of 210 homes in Ohio. Shows payroll as a percentage of revenue versus the Ohio average. Well-run Ohio facilities typically land around 54–64% — the top third Statewide. Below 25% may signal understaffing or heavy agency use — read with Staffing ratings.Rankings are based only on facilities in Ohio that report data for that category. Facilities without available data are excluded from the ranking.Click the rank badge to see the full State ranking.Click here to see the full State ranking.
Other operating costs Info Everything it costs to run the home apart from payroll — food, utilities, supplies, maintenance, contract labor and administration. Calculated as total operating expense minus payroll (staff salaries and wage-related benefits).
$4.1M
Total costs Info The home's total operating expense for the year — all the costs of running it, salaries included (CMS cost report, Worksheet G-3).
$7.0M

What does this home offer?

Pets allowed icon
Pets allowed icon

Pets Allowed

Room sizes icon
Room sizes icon

Room Sizes: 365-563 / 542-894 / 877-1,056 / 1,244-1,279 sq. ft

Housing options icon

Housing Options: Studio / Cottage / 1 Bed / 2 Bed

Building type icon
Building type icon

Building Type: 3-story

Transportation services icon

Transportation Services

Recreational activities icon

Recreational Activities

Housekeeping icon
Housekeeping icon

Housekeeping Services

Exercise program icon

Exercise Programs

Who this home usually serves

TYPE OF STAY

Primarily short stays

Residents typically stay for brief periods, with frequent admissions and discharges throughout the year.

Most new residents arrive under private pay (65% of admissions), and a typical private pay stay runs around 4 - 5 months.

Admissions
187 total

Coverage residents most often arrive under.

Medicare 24%
Private pay 65%
Medicaid 11%
Discharges
188 total

Coverage residents most often leave under.

Medicare 24%
Private pay 65%
Medicaid 11%

Living Spaces & Floor Plans for Parker Place Gracious Retirement Living

Parker Place 2 Bed
Parker Place 1 Bed
Parker Place Studio
Parker Place 2 Bed Cottage

Places of interest near Parker Place Gracious Retirement Living

Address 0.9 miles from city center Info Estimated distance in miles from Mentor's city center to Parker Place Gracious Retirement Living's address, calculated via Google Maps. — 4.8 miles to nearest hospital (University Hospitals TriPoint Medical Center)

Calculate Travel Distance to Parker Place Gracious Retirement Living

Add your location

Address

Compare Independent Living around Mentor

Parker Place Gracious Retirement Living
IL
NH
Mentor (Newell Creek) -
147
Facility 147
OH AVG 78
Rank #24 / 323
-
5
Facility 5
OH AVG 40
Rank #649 / 705
Studio / Cottage / 1 Bed / 2 Bed
Nason Center of Breckenridge Village
IL
AL
NH
Willoughby (Deer Creek) -
72
Facility 72
OH AVG 78
Rank #169 / 323
-
36
Facility 36
OH AVG 40
Rank #390 / 705
Private Rooms

Financial Assistance for
Independent Living in Ohio

Parker Place Gracious Retirement Living is located in Mentor, Ohio.
Here are the financial assistance programs available to residents in Ohio.

Get Financial aid guidance

PASSPORT Waiver

Ohio Medicaid PASSPORT

Age 60+
General Ohio resident, Medicaid-eligible, nursing home-level care need.
Income Limits (2025) ~$2,829/month 300% FBR, individual
Asset Limits $2,000 (individual), $3,000 (couple).
OH

Administered through regional agencies; waitlists possible.

Benefits
Personal care (5-7 hours/day) Respite (240 hours/year) Adult day care ($65/day) Home modifications ($1,500 avg.)

Ohio Home Care Program (non-Medicaid)

OH HCP

Age 60+
General Ohio resident, at risk of decline.
Income Limits ~$2,000/month individual, varies
Asset Limits $5,000 individual
OH

Limited funding; regional variation.

Benefits
In-home care (3-5 hours/week) Respite (up to 10 days/year) Transportation (~5 trips/month)

Assisted Living Waiver (ALW)

Ohio Assisted Living Waiver

Age 21+ (65+ prioritized)
General OH resident, Medicaid-eligible, NFLOC.
Income Limits (2025) ~$2,829/month (individual); QIT required.
Asset Limits $2,000 (individual), $3,000 (couple).
OH

Covers ~300 facilities; room/board not included (separate cost).

Benefits
Personal care Meals Medication management Transportation (~$3,000-$4,000/month value)

Program of All-Inclusive Care for the Elderly (PACE)

Ohio PACE (e.g., McGregor PACE)

Age 55+
General OH resident (specific counties), NFLOC, safe with PACE support.
Income Limits (2025) ~$2,829/month (Medicaid-eligible); private pay option available.
Asset Limits $2,000 (individual), $3,000 (couple) for Medicaid enrollees.
OH

Available in 9 counties (e.g., Cuyahoga, Franklin); expanding via Healthy Aging Grants.

Benefits
Personal care (5-7 hours/day) Medical care Meals Transportation Respite Therapies

Medicare Savings Program (MSP)

Ohio Medicare Savings Program

Age 65+ or disabled
General OH resident, Medicare Part A/B.
Income Limits (2025) ~$2,510/month (QMB), ~$3,380/month (SLMB), ~$3,598/month (QI)—individual.
Asset Limits $9,430 (individual), $14,130 (couple).
OH

Three tiers; includes Extra Help for Part D; no waitlist.

Benefits
Covers Part B premiums ($174.70/month) Deductibles ($240/year) Copays (~20%)

Home Energy Assistance Program (HEAP)

Ohio HEAP

Age 60+ prioritized
General OH resident, low-income household.
Income Limits (2025) ~$3,970/month individual, 185% FPL
Asset Limits Not assessed; income-focused.
OH

Covers gas, electric, oil; emergency aid via Winter/Summer Crisis Programs.

Benefits
Heating/cooling aid ($300-$1,000/season) Emergency aid ($500 max)

Family Caregiver Support Program (FCSP)

Ohio Family Caregiver Support Program

Age
General Caregivers of 60+ needing care or 55+ caregivers of others; OH resident; functional needs (2+ ADLs).
Income Limits (2025) Prioritizes ~$24,980/year (individual); no strict cap.
Asset Limits Not assessed; need-based.
OH

12 AAAs; rural/low-income priority; volunteer respite option.

Benefits
Respite (4-6 hours/week or 5 days/year) Adult day care ($60/day) Training Supplies (~$500/year)

VA Aid and Attendance (A&A) and Housebound Benefits

Ohio VA Aid and Attendance/Housebound

Age 65+ or disabled veteran/spouse
General OH resident, wartime service, need for ADL help (A&A) or homebound.
Income Limits (2025) Net income < ~$1,984/month (veteran with dependent, A&A); pension offsets income.
Asset Limits ~$155,356 net worth limit
OH

High veteran demand; supports care in multiple settings.

Benefits
Cash (~$1,433-$2,642/month veteran, ~$951-$1,318 spouse) for care costs (e.g., in-home, assisted living)

Homestead Exemption

Ohio Homestead Exemption

Age 65+ (or disabled)
General OH resident, homeowner, low-income.
Income Limits (2025) ~$38,500/year individual, adjusted annually
Asset Limits Not assessed; home ownership required.
OH

Reduces taxable value by $25,000; applies to primary residence.

Benefits
Tax reduction (~$400-$800/year avg., varies by county)

Save the Dream Ohio (Homeowner Assistance Fund)

Ohio Save the Dream

Age 60+ prioritized
General OH resident, homeowner, hardship post-Jan 21, 2020.
Income Limits (2025) ~$147,600/year family of 4, 150% AMI; varies by county
Asset Limits Not assessed; hardship-focused.
OH

Covers delinquent mortgages, utilities, taxes; max $25,000 mortgage aid.

Benefits
Mortgage aid ($25,000 max) Utility/property tax aid ($5,000 avg.)

More homes from the same operator

Frequently Asked Questions about Parker Place Gracious Retirement Living

What neighborhood is Parker Place Gracious Retirement Living in?

Parker Place Gracious Retirement Living is in the Newell Creek neighborhood.

Is Parker Place Gracious Retirement Living in a walkable area?

Parker Place Gracious Retirement Living has a walk score of 5. Car-dependent. Most errands require a car, with limited nearby walkable options.

What is the occupancy rate at Parker Place Gracious Retirement Living?

Parker Place Gracious Retirement Living's occupancy is 60.1%.

Are there photos of Parker Place Gracious Retirement Living?

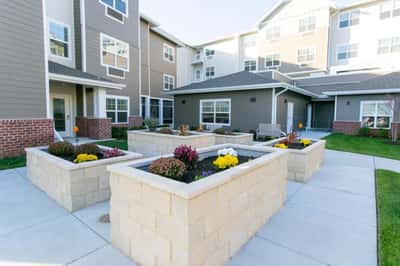
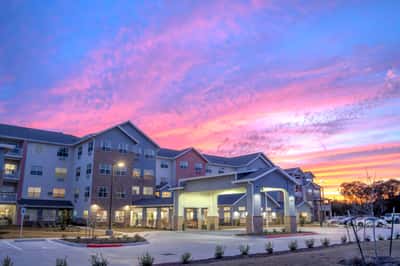
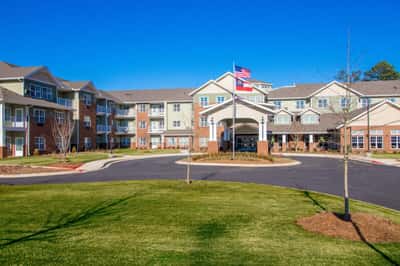
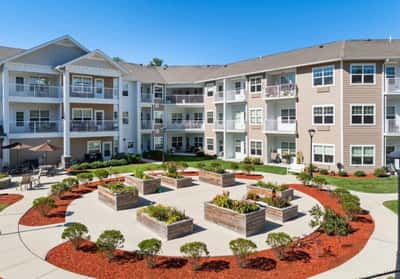
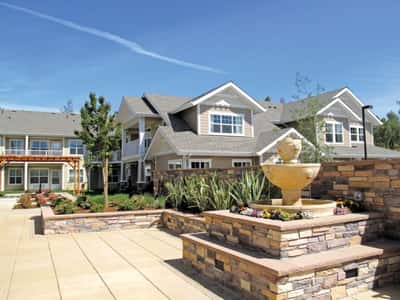
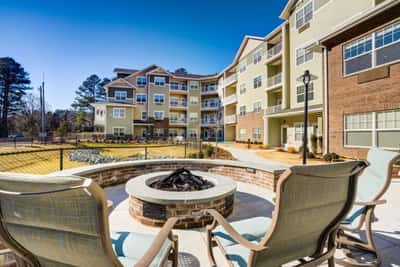
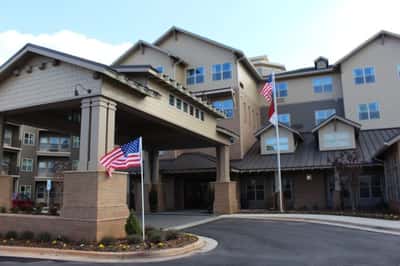
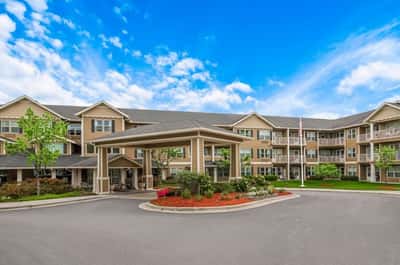
Yes — there are 5 photos of Parker Place Gracious Retirement Living in the photo gallery on this page.

What is the address of Parker Place Gracious Retirement Living?

Parker Place Gracious Retirement Living is located at 7960 Center St, Mentor, OH 44060.

What is the phone number of Parker Place Gracious Retirement Living?

(440) 255-0828 will put you in contact with the team at Parker Place Gracious Retirement Living.

Is Parker Place Gracious Retirement Living Medicare or Medicaid certified?

Yes — Parker Place Gracious Retirement Living is a CMS-certified provider of Medicare and Medicaid.

Guides for Better Senior Living

Care Cost Calculator: See Prices in Your Area

Nursing Home Data Explorer

Don’t Wait Too Long: 7 Red Flag Signs Your Parent Needs Assisted Living Now

The True Cost of Assisted Living in 2025 – And How Families Are Paying For It

Understanding Senior Living Costs: Pricing Models, Discounts & Financial Assistance