Parkview Nursing and Rehabilitation Center
Nursing Home, Assisted Living & Memory Care · Wilmington, DE
CMS overall rating Info CMS (the Centers for Medicare & Medicaid Services) is the federal agency that rates nursing home quality. Its Overall Rating runs from 1 to 5 stars, combining health inspections, staffing, and quality measures, with inspections weighted most heavily.

Parkview Nursing and Rehabilitation Center

Nursing Home, Assisted Living & Memory Care · Wilmington, DE
CMS overall rating Info CMS (the Centers for Medicare & Medicaid Services) is the federal agency that rates nursing home quality. Its Overall Rating runs from 1 to 5 stars, combining health inspections, staffing, and quality measures, with inspections weighted most heavily.
Calculator: See prices in your area
Parkview Nursing and Rehabilitation Center accepts Medicare, Medicaid, and private pay.

Overview of Parkview Nursing and Rehabilitation Center

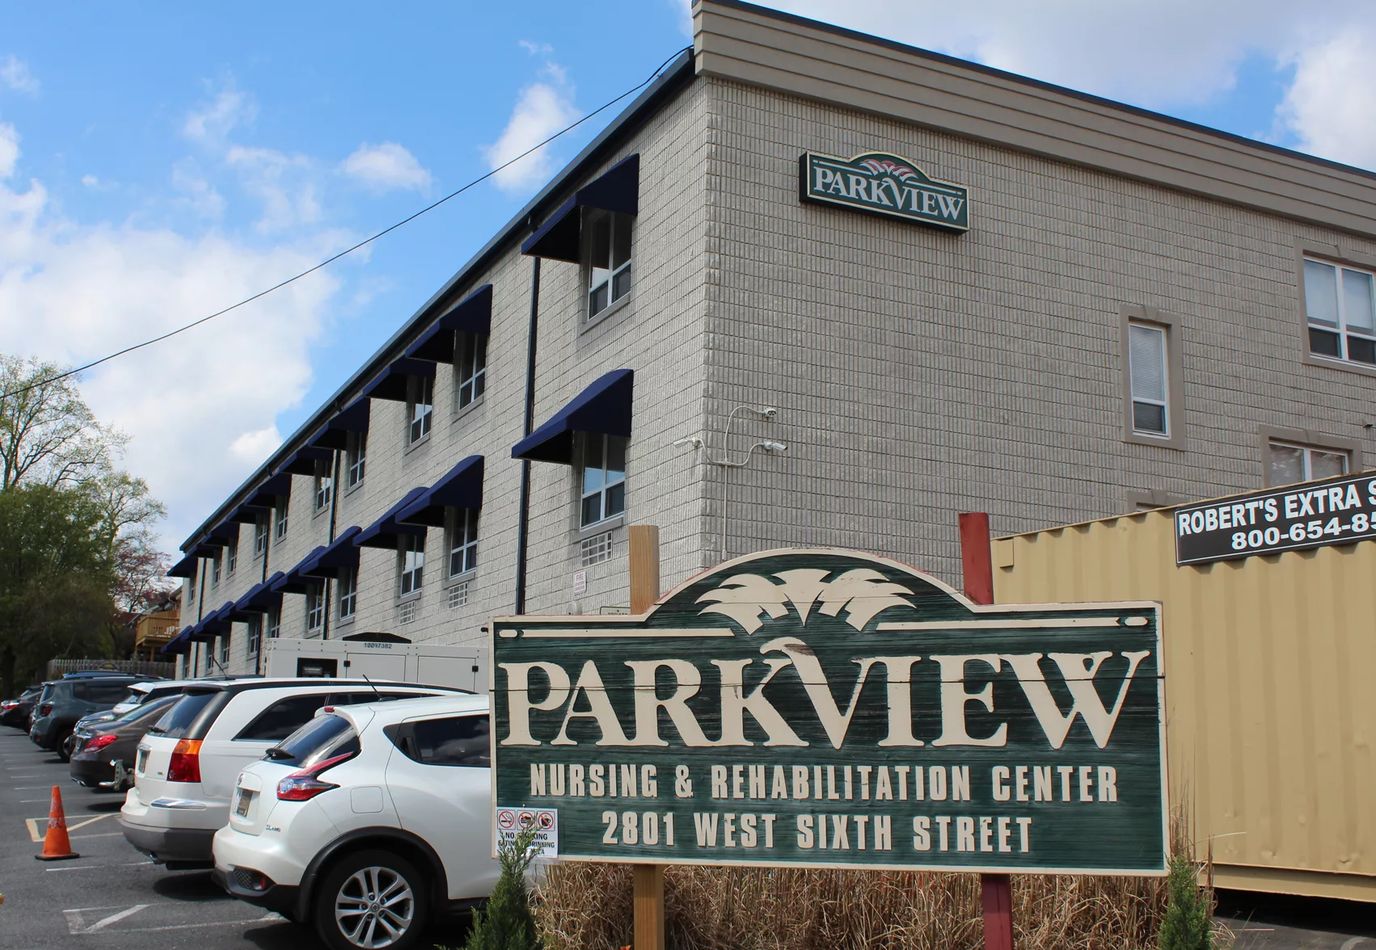
If you’re checking out Parkview Nursing and Rehabilitation Center at 2801 W 6th St, here’s the breakdown. It’s located in Wilmington’s Wawaset Heights neighborhood, and the location is actually pretty practical; you’re less than a mile from Saint Francis Hospital, which is vital if you need quick access to acute care. Plus, with a Walk Score of 77, it’s convenient for visitors to run errands nearby without needing a car.

The facility is managed by Master Delaware SNF Management, LP. It’s a 150-bed spot that handles nursing care, assisted living, and memory care.

Right now, it’s at 81.5% capacity, with 126 people currently living there. The average stay is about 163 days, showing a mix of people; some doing short-term rehab, others there for the long haul. They accept Medicare, Medicaid, and private pay.

Clinically, they cover a lot of ground. Whether it’s wound care, neuro and pulmonary therapy, or post-orthopedic recovery, they have a solid lineup of physical therapists, speech pathologists, and respiratory technicians. There’s an on-site medical director available seven days a week, which provides some extra peace of mind.

On the nursing side, residents get about 3 hours and 50 minutes of care per day on average. That includes 42 minutes with an RN, 46 minutes with an LPN or LVN, and 2 hours and 12 minutes with nurse aides. It’s also worth noting they have an active Resident Council where people can share their thoughts.

Overall, it’s a mid-sized, multi-level community. If you’re looking for a place that balances rehab with long-term care in a walkable neighborhood, Parkview is worth considering.

Quality ratings

Measured by Centers for Medicare & Medicaid Services (CMS)

Overall rating Info The Overall CMS Rating combines results from health inspections, staffing levels and quality measures. Health inspections carry the most weight. Staffing and quality scores can increase or decrease the final rating based on performance compared to state and national standards.
▼ 8.5% Below DE avg. ▼ 8.5% Below DE avg.DE average: 3.3Click the badge to see the full State ranking.Click here to see the full State ranking.
Health Inspection Info Based on the results of the facility's three most recent standard inspections and any complaint investigations. CMS reviews the number, scope, and severity of deficiencies, with more recent findings weighted more heavily.
▼ 27.7% Below DE avg. ▼ 27.7% Below DE avg.DE average: 2.8Click the badge to see the full State ranking.Click here to see the full State ranking.
Staffing Info Measures average nursing staff hours per resident per day, including Registered Nurses (RNs) and total nursing staff. Ratings are adjusted based on the level of care residents require and are compared to state and national benchmarks.
At DE avg. At DE avg.DE average: 4.0Click the badge to see the full State ranking.Click here to see the full State ranking.
Quality Measures Info Based on clinical and physical health indicators reported to CMS, such as hospital readmissions, falls, pressure ulcers, and improvements in mobility. These measures reflect how well residents' health needs are being managed.
▲ 23.6% Above DE avg. ▲ 23.6% Above DE avg.DE average: 4.0Click the badge to see the full State ranking.Click here to see the full State ranking.

Staffing hours breakdown

Info Daily nursing hours per resident by staff type, reported to CMS. Higher is generally better — compare this facility to state and national averages to see where staffing stands.

Hours per resident per day — compared to Delaware state averages

Total nursing care / resident Info This home is ranked 31st out of 40 homes in Delaware for nurse hours. Total adjusted nursing hours per resident per day, combining RN, LPN, and aide time. CMS adjusts this for case-mix so facilities can be fairly compared.
3h 50m per day
Rank #31 / 40Nurse hours — State benchmarkedThis home is ranked 31st out of 40 homes in Delaware. Shows adjusted nurse hours per resident per day benchmarked to the Delaware average, with a ranking across 40 Delaware facilities. More hours mean more direct care. The national average is about 3.5 hrs; below 3.0 is a red flag.Rankings are based only on facilities in Delaware that report data for that category. Facilities without available data are excluded from the ranking.Click the rank badge to see the full State ranking.Click here to see the full State ranking.
This facility Delaware avg (4h 39m per day)
vs Delaware avg
-18%

5 of 6 metrics below state avg

Staff typeHours / Day / Residentvs state avg
Registered Nurse (RN) Info RNs hold the highest nursing license and can assess residents, interpret test results, and direct care plans. More RN hours per day often signals stronger clinical oversight and faster response to health changes. 42m per day ▼ 31% State avg: 1h 0m per day · National avg: 41m per day
LPN / LVN Info Licensed Practical Nurses (LPNs) or Licensed Vocational Nurses (LVNs) deliver routine hands-on care — medication administration, wound dressing, and monitoring vital signs. They work under RN supervision and make up a large share of daily bedside care. 46m per day ▼ 26% State avg: 1h 2m per day · National avg: 52m per day
Nurse Aide Info Certified Nurse Aides (CNAs) provide the most direct day-to-day assistance: bathing, dressing, feeding, and mobility. Nurse aide hours are typically the largest staffing category and directly affect residents' quality of life. 2h 12m per day ▼ 12% State avg: 2h 29m per day · National avg: 2h 20m per day
Weekend Total Nursing Info Combined nursing hours (RN + LPN + Nurse Aide) per resident per day on weekends. Staffing often drops on weekends — this figure reveals whether the facility maintains adequate coverage outside of weekday hours. 3h 28m per day ▼ 18% State avg: 4h 14m per day · National avg: 3h 27m per day
Physical Therapist Info Hours per resident per day provided by licensed Physical Therapists (PTs) or PT Assistants. PT services help residents recover mobility after injury or illness and are especially important for post-acute (short-stay) rehabilitation. 2m per day ▼ 81% State avg: 12m per day · National avg: 4m per day
Weekend RN Info Registered nurse hours specifically on weekends. Facilities sometimes reduce RN presence on Saturdays and Sundays — a low weekend RN figure compared to weekday hours can indicate reduced clinical oversight when most administrative staff are absent. 41m per day ■ Avg State avg: 42m per day · National avg: 29m per day

Capacity and availability

This home usually has availability

Higher occupancy than the Delaware average: 80.7%
Occupancy rate
81.5% Rank #30 / 44Occupancy rate — State benchmarkedThis home is ranked 30th out of 44 homes in Delaware. Shows this facility's occupancy rate versus the Delaware average, with its Statewide rank out of 44. Higher occupancy signals strong local demand and financial stability.Rankings are based only on facilities in Delaware that report data for that category. Facilities without available data are excluded from the ranking.Click the rank badge to see the full State ranking.Click here to see the full State ranking.
Avg. Length of Stay
163 days
Bed community size
150-bed community Rank #10 / 73Bed count — State benchmarkedThis home is ranked 10th out of 73 homes in Delaware. Shows this facility's certified or reported bed count compared to other Delaware facilities. Larger communities may offer more amenities, programs, and on-site services for residents and families.Rankings are based only on facilities in Delaware that report data for that category. Facilities without available data are excluded from the ranking.Click the rank badge to see the full State ranking.Click here to see the full State ranking.
A larger shared setting that may offer more common spaces and organized community services.
Walk Score
Walk Score: 77 / 100 Rank #12 / 110Walk Score — State benchmarkedThis home is ranked 12th out of 110 homes in Delaware. Shows how walkable this facility's neighborhood is compared to the average Walk Score across Delaware facilities. Higher scores benefit residents, families, and staff.Rankings are based only on facilities in Delaware that report data for that category. Facilities without available data are excluded from the ranking.Click the rank badge to see the full State ranking.Click here to see the full State ranking.
Very walkable. Most errands can be accomplished on foot, and many essentials are within a short walk.

Contact Parkview Nursing and Rehabilitation Center

Staffing Data

Reporting period: October 1 – December 31, 2025 (Q4 2025). Source: CMS Payroll-Based Journal report.

Total staff 213
Employees 212
Contractors 1
Staff to resident ratio 1.69 : 1
0% compared with Delaware average
Delaware average ratio: 1.63 : 1 Delaware average ratio: 1.63 : 1See full Delaware ranking
Avg staff/day 77
Average shift 7.3 hours
0% compared with Delaware average
Delaware average: 7.6 hours Delaware average shift: 7.6 hoursSee full Delaware ranking
Total staff hours (quarter) 52,039

Nursing staff breakdown

Q4 2025 · Oct 1 – Dec 31 More info This data comes from the CMS Payroll-Based Journal report covering October 1 – December 31, 2025.
Registered Nurse

Manages medical care and health needs.

RN Staff Info All 21 RN Staff are full-time employees. No contractors work on this role. 21
Average shift length Info Average shift length. Calculated as total hours divided by days worked and average staff per day. 8.5 hours
Licensed Practical Nurse

Assists with medical care and medications.

LPN Staff Info All 28 LPN Staff are full-time employees. No contractors work on this role. 28
Average shift length Info Average shift length. Calculated as total hours divided by days worked and average staff per day. 7.9 hours
Certified Nursing Assistant

Helps with daily care and mobility.

CNA Staff Info All 95 CNA Staff are full-time employees. No contractors work on this role. 95
Average shift length Info Average shift length. Calculated as total hours divided by days worked and average staff per day. 7.2 hours

Contractor staffing

Q4 2025 · Oct 1 – Dec 31 More info This data comes from the CMS Payroll-Based Journal report covering October 1 – December 31, 2025.

Total hours from contractors

0.3%

173 contractor hours this quarter

Occupational Therapy Aide: 1

Staff by category

Q4 2025 · Oct 1 – Dec 31 More info This data comes from the CMS Payroll-Based Journal report covering October 1 – December 31, 2025.
Certified Nursing Assistant9509527,89792100%7.2
Licensed Practical Nurse280287,95492100%7.9
Registered Nurse210216,10992100%8.5
Clinical Nurse Specialist140142,4098592%7.5
RN Director of Nursing220221,6558188%5.7
Other Dietary Services Staff9091,6409199%7.3
Physical Therapy Aide2026006571%7
Physical Therapy Assistant4044916672%5.6
Qualified Social Worker3034786470%7.2
Respiratory Therapy Technician4044736672%7.2
Dietitian1014726368%7.5
Mental Health Service Worker1014616267%7.4
Administrator1014435964%7.5
Dental Services Staff3033484650%7.4
Nurse Practitioner1013084145%7.5
Occupational Therapy Aide0111732325%7.5
Speech Language Pathologist3031313740%3.4
95 Certified Nursing Assistant
% of Days 100%
28 Licensed Practical Nurse
% of Days 100%
21 Registered Nurse
% of Days 100%
14 Clinical Nurse Specialist
% of Days 92%
22 RN Director of Nursing
% of Days 88%
9 Other Dietary Services Staff
% of Days 99%
2 Physical Therapy Aide
% of Days 71%
4 Physical Therapy Assistant
% of Days 72%
3 Qualified Social Worker
% of Days 70%
4 Respiratory Therapy Technician
% of Days 72%
1 Dietitian
% of Days 68%
1 Mental Health Service Worker
% of Days 67%
1 Administrator
% of Days 64%
3 Dental Services Staff
% of Days 50%
1 Nurse Practitioner
% of Days 45%
1 Occupational Therapy Aide
% of Days 25%
3 Speech Language Pathologist
% of Days 40%

Penalties and fines

Includes penalties issued in 2024

Federal penalties imposed by CMS for regulatory violations, including civil money penalties (fines) and denials of payment for new Medicare/Medicaid admissions.

Source: CMS Penalties Database (Data as of Jan 2026)

Total fines amount $38K Rank #24 / 41Federal fines — State benchmarkedThis home is ranked 24th out of 41 homes in Delaware. Shows this facility's cumulative CMS federal fine dollars versus the Delaware average among facilities with fines, and where it ranks among 41 facilities in the pool. Lower total dollars mean a better rank.Rankings are based only on facilities in Delaware that report data for that category. Facilities without available data are excluded from the ranking.Click the rank badge to see the full State ranking.Click here to see the full State ranking.
61% lower than Delaware average

Delaware average: $98K

Number of fines 1
46% fewer fines than Delaware average

Delaware average: 1.9

Payment Denials Info Serious action where Medicare and/or Medicaid temporarily stops payments for new residents until issues are fixed. 0
100% fewer payment denials than Delaware average

Delaware average: 0.2

Fines amount comparison
This facility $38K
Delaware average $98K
Penalty History

Penalties are imposed by CMS for violations of federal nursing home regulations.

1 penalty in the past 3 years

Mar 1, 2024 · $38K

Civil Money Penalty Info Fines imposed for noncompliance, which can be assessed per day or per instance of violation. Mar 1, 2024
$38K

Last updated: Jan 2026

Quality of care over time

These measures show how residents usually do over time at this home, based on health outcomes and preventive care.

High-risk clinical events score Info A composite score based on pressure ulcers, falls with injury, weight loss, walking ability decline, and activities of daily living decline. 6.7
30% better than Delaware average

Delaware average: 9.6

Functional decline score Info A composite score based on activities of daily living decline, walking ability decline, and incontinence. 14.2
25% better than Delaware average

Delaware average: 19.0

Long-stay resident measures
Need for Help with Daily Activities Increased Info Percent of long-stay residents whose need for help with daily activities has increased 12.9%
16% better than Delaware average

Delaware average: 15.4%

Walking Ability Worsened Info Percent of long-stay residents whose ability to move independently worsened 10.0%
49% better than Delaware average

Delaware average: 19.8%

Low Risk Residents with Bowel/Bladder Incontinence Info Percent of low risk long-stay residents who lose control of their bowels or bladder 19.7%
11% better than Delaware average

Delaware average: 22.1%

Falls with Major Injury Info Percent of long-stay residents experiencing one or more falls with major injury 4.7%
58% worse than Delaware average

Delaware average: 3.0%

High Risk Residents with Pressure Ulcers Info Percent of long-stay high risk residents with pressure ulcers 2.7%
39% better than Delaware average

Delaware average: 4.4%

Urinary Tract Infection Info Percent of long-stay residents with a urinary tract infection 0.2%
90% better than Delaware average

Delaware average: 2.1%

Lost Too Much Weight Info Percent of long-stay residents who lose too much weight 3.4%
41% better than Delaware average

Delaware average: 5.8%

Depressive Symptoms Info Percent of long-stay residents who have depressive symptoms 3.2%
47% better than Delaware average

Delaware average: 6.0%

Antipsychotic Use Info Percent of long-stay residents who received an antipsychotic medication 10.6%
In line with Delaware average

Delaware average: 11.0%

Pneumococcal Vaccine Info Percent of long-stay residents assessed and appropriately given the pneumococcal vaccine 98.3%
In line with Delaware average

Delaware average: 95.3%

Influenza Vaccine Info Percent of long-stay residents assessed and appropriately given the seasonal influenza vaccine 97.7%
In line with Delaware average

Delaware average: 97.4%

Short-stay resident measures
Pneumococcal Vaccine Info Percent of short-stay residents assessed and appropriately given the pneumococcal vaccine 88.3%
8% better than Delaware average

Delaware average: 82.1%

Antipsychotic medication increase Info Percent of short-stay residents who newly received an antipsychotic medication 0.6%
37% better than Delaware average

Delaware average: 0.9%

Influenza Vaccine Info Percent of short-stay residents assessed and appropriately given the seasonal influenza vaccine 85.4%
In line with Delaware average

Delaware average: 83.1%

Breakdown by payment type

Medicare

29% of new residents, usually for short-term rehab.

Typical stay 30 days

Private pay

48% of new residents, often for short stays.

Typical stay 30 days

Medicaid

23% of new residents, often for long-term daily care.

Typical stay 1 - 2 years

Facility Characteristics

Source: CMS Long-Term Care Facility Characteristics (Data as of Jan 2026)

Total residents 126
Private pay or other
126
100% of residents
Programs & Services
Residents Group

Residents meet regularly to discuss policies, care quality, and activities

Active Resident Council

Organized group of residents that meets regularly to discuss facility policies, quality of life, and activities.

Finances and operations

Based on CMS SNF Cost Report for fiscal year ending in 06/2024.

For-profit
LLC
Net patient revenue Info Net patient revenue — what the home actually collects for resident care, after contractual allowances, bad debt and discounts are subtracted from its gross charges (CMS cost report, Worksheet G-3). It covers resident care only; money the home earns from other sources is shown separately as "Other income."
$15.0M
Net patient income Info Net patient income: net patient revenue minus the home's total operating expenses. A positive figure means it earns more from resident care than it spends to deliver it; a negative figure means the opposite. It excludes non-operating "other income."
-$1.5M
For-profit LLC
Net patient revenue Info Net patient revenue — what the home actually collects for resident care, after contractual allowances, bad debt and discounts are subtracted from its gross charges (CMS cost report, Worksheet G-3). It covers resident care only; money the home earns from other sources is shown separately as "Other income."
$15.0M Rank #25 / 37Revenue — State benchmarkedThis home is ranked 25th out of 37 homes in Delaware. Shows this facility's annual revenue compared to the Delaware average. Higher revenue generally means more resources for staffing and capital — read alongside Payroll %.Rankings are based only on facilities in Delaware that report data for that category. Facilities without available data are excluded from the ranking.Click the rank badge to see the full State ranking.Click here to see the full State ranking.
Net patient income Info Net patient income: net patient revenue minus the home's total operating expenses. A positive figure means it earns more from resident care than it spends to deliver it; a negative figure means the opposite. It excludes non-operating "other income."
-$1.5M
Other income Info Money the home earns outside of resident care — such as investments, grants, rentals and other non-operating sources (CMS cost report, Worksheet G-3). It is tracked separately from net patient revenue: it is not part of that figure, and it is not included in net patient income.
$949.3K
Payroll costs Info Staff salaries plus wage-related costs — benefits such as payroll taxes, health insurance and retirement — from the home's own accounting records (CMS cost report, Worksheet A). Contract or agency labor is counted separately, under other operating costs. Rank #10 / 37Payroll — State benchmarkedThis home is ranked 10th out of 37 homes in Delaware. Shows total annual staff payroll benchmarked to the Delaware average. Higher payroll investment relative to peers often signals better staffing and less reliance on cheaper contract labor.Rankings are based only on facilities in Delaware that report data for that category. Facilities without available data are excluded from the ranking.Click the rank badge to see the full State ranking.Click here to see the full State ranking.
$9.3M 61.9% of net patient revenue Info Payroll as a share of revenue: staff salaries and wage-related benefits divided by net patient revenue. A higher figure means more of each revenue dollar goes to staff pay. Rank #6 / 37Payroll % — State benchmarkedThis home is ranked 6th out of 37 homes in Delaware. Shows payroll as a percentage of revenue versus the Delaware average. Well-run Delaware facilities typically land around 52–60% — the top third Statewide. Below 25% may signal understaffing or heavy agency use — read with Staffing ratings.Rankings are based only on facilities in Delaware that report data for that category. Facilities without available data are excluded from the ranking.Click the rank badge to see the full State ranking.Click here to see the full State ranking.
Other operating costs Info Everything it costs to run the home apart from payroll — food, utilities, supplies, maintenance, contract labor and administration. Calculated as total operating expense minus payroll (staff salaries and wage-related benefits).
$7.2M
Total costs Info The home's total operating expense for the year — all the costs of running it, salaries included (CMS cost report, Worksheet G-3).
$16.5M

Who this home usually serves

TYPE OF STAY

Mix of rehab and long-term care

This home supports both short-term rehab and long-term care, with residents staying for a wide range of durations.

New residents most often arrive under private pay (48% of admissions), and a typical private pay stay runs around 30 days.

Admissions
288 total

Coverage residents most often arrive under.

Medicare 29%
Private pay 48%
Medicaid 23%
Discharges
275 total

Coverage residents most often leave under.

Medicare 20%
Private pay 40%
Medicaid 40%

Managed by Eric Toma

Administrator

Places of interest near Parkview Nursing and Rehabilitation Center

Address 2.6 miles from city center Info Estimated distance in miles from Wilmington's city center to Parkview Nursing and Rehabilitation Center's address, calculated via Google Maps. — 0.82 miles to nearest hospital (Saint Francis Hospital)

Calculate Travel Distance to Parkview Nursing and Rehabilitation Center

Add your location

Address

Compare Nursing Homes around Wilmington

The information below is reported by the Delaware Department of Health and Social Services, Division of Health Care Quality.

5 facilities compared · CMS & DE Dept. of Health data

Cardia Healthcare Silverside
NH
HC
MC
NC
PC
Wilmington
128
Facility 128
DE AVG 102
Rank #22 / 73
86.7%
Facility 86.7%
DE AVG 80.7%
Rank #22 / 44
+7%
4.55
Facility 4.55
DE AVG 4.66
Rank #11 / 40
-32%-2%
$10.6k
Facility $10.6k
DE AVG $96.1k
Rank #13 / 41
22
Facility 22
DE AVG 38.9
Rank #10 / 41
5.5
Facility 5.5
DE AVG 8.7
Rank #9 / 41
1104-
29
Facility 29
DE AVG 40
Rank #72 / 110
-
$20.1M
Facility $20.1M
DE AVG $19.5M
Rank #8 / 37
$9.1M
Facility $9.1M
DE AVG $6.3M
Rank #9 / 37
45.1%
Facility 45.1%
DE AVG 35.2%
Rank #23 / 37
85056
Shipley Living
NH
AL
IL
RC
Wilmington
17
Facility 17
DE AVG 102
Rank #72 / 73
70.5%
Facility 70.5%
DE AVG 80.7%
Rank #35 / 44
-13%
4.07
Facility 4.07
DE AVG 4.66
Rank #24 / 40
-11%-13%
$32.4k
Facility $32.4k
DE AVG $96.1k
Rank #23 / 41
60
Facility 60
DE AVG 38.9
Rank #34 / 41
10.0
Facility 10.0
DE AVG 8.7
Rank #25 / 41
262-
13
Facility 13
DE AVG 40
Rank #90 / 110
Timothy Ballas
$9.5M
Facility $9.5M
DE AVG $19.5M
Rank #33 / 37
$5.4M
Facility $5.4M
DE AVG $6.3M
Rank #27 / 37
56.7%
Facility 56.7%
DE AVG 35.2%
Rank #9 / 37
85031
Cadia Rehabilitation Pike Creek
NH
HC
NC
PC
Wilmington
177
Facility 177
DE AVG 102
Rank #4 / 73
78.5%
Facility 78.5%
DE AVG 80.7%
Rank #32 / 44
-3%
3.02
Facility 3.02
DE AVG 4.66
Rank #40 / 40
-26%-35%
$78.4k
Facility $78.4k
DE AVG $96.1k
Rank #31 / 41
53
Facility 53
DE AVG 38.9
Rank #31 / 41
8.8
Facility 8.8
DE AVG 8.7
Rank #20 / 41
6156-
49
Facility 49
DE AVG 40
Rank #37 / 110
-
$30.7M
Facility $30.7M
DE AVG $19.5M
Rank #3 / 37
$14.1M
Facility $14.1M
DE AVG $6.3M
Rank #1 / 37
46.1%
Facility 46.1%
DE AVG 35.2%
Rank #20 / 37
85054
Parkview Nursing and Rehabilitation Center
NH
AL
MC
Wilmington (Wawaset Heights)
150
Facility 150
DE AVG 102
Rank #10 / 73
81.5%
Facility 81.5%
DE AVG 80.7%
Rank #30 / 44
+1%
3.83
Facility 3.83
DE AVG 4.66
Rank #31 / 40
-21%-18%
$38.3k
Facility $38.3k
DE AVG $96.1k
Rank #24 / 41
21
Facility 21
DE AVG 38.9
Rank #8 / 41
7.0
Facility 7.0
DE AVG 8.7
Rank #14 / 41
1138-
77
Facility 77
DE AVG 40
Rank #12 / 110
Master Delaware Snf Management, LP
$15.0M
Facility $15.0M
DE AVG $19.5M
Rank #25 / 37
$9.3M
Facility $9.3M
DE AVG $6.3M
Rank #10 / 37
61.9%
Facility 61.9%
DE AVG 35.2%
Rank #6 / 37
85002
Kutz Senior Living Campus
NH
AL
MC
RC
Wilmington
90
Facility 90
DE AVG 102
Rank #45 / 73
87.8%
Facility 87.8%
DE AVG 80.7%
Rank #21 / 44
+9%
5.21
Facility 5.21
DE AVG 4.66
Rank #5 / 40
-83%+12%
$168.0k
Facility $168.0k
DE AVG $96.1k
Rank #38 / 41
59
Facility 59
DE AVG 38.9
Rank #32 / 41
14.8
Facility 14.8
DE AVG 8.7
Rank #36 / 41
469-
41
Facility 41
DE AVG 40
Rank #51 / 110
David Bacher
$15.4M
Facility $15.4M
DE AVG $19.5M
Rank #26 / 37
$8.1M
Facility $8.1M
DE AVG $6.3M
Rank #19 / 37
52.3%
Facility 52.3%
DE AVG 35.2%
Rank #12 / 37
85043

Financial Assistance for
Nursing Home in Delaware

Parkview Nursing and Rehabilitation Center is located in Wilmington, Delaware.
Here are the financial assistance programs available to residents in Delaware.

Get Financial aid guidance

Elderly and Disabled Waiver

Delaware Medicaid E&D Waiver

Age 65+ or disabled
General Delaware resident, Medicaid- eligible, nursing home-level care need.
Income Limits (2025) ~$2,829/month 300% FBR, individual
Asset Limits $2,000 (individual), $3,000 (couple).
DE

Small state, faster processing in some areas.

Benefits
Personal care (5-7 hours/day) Respite (240 hours/year) Adult day care (~$60/day) Home modifications

Delaware Caregiver Support Program

DE Caregiver Support (NFCSP)

Age Caregiver of someone 60+
General Delaware resident.
Income Limits No strict limit; prioritizes low-income.
Asset Limits Not applicable.
DE

Limited slots; rural focus.

Benefits
In-home respite (4-6 hours/day) Adult day care (~$60/day) Short-term facility care (up to 5 days)

Program of All-Inclusive Care for the Elderly (PACE)

Delaware Medicaid PACE

Age 55+
General Delaware resident, nursing home-level care need, safe with PACE support.
Income Limits (2025) ~$2,829/month 300% FBR
Asset Limits $2,000 (individual), $3,000 (couple).
DE

Limited to specific areas (e.g., New Castle County); few providers.

Benefits
Personal care (5-7 hours/day) Medical care Meals Transportation Therapy

Medicare Savings Program (MSP)

Delaware Medicare Savings Program

Age 65+ or disabled
General Delaware resident, enrolled in Medicare Part A/B.
Income Limits (2025) ~$2,510/month (QMB), ~$3,380/month (SLMB), ~$3,598/month (QI)—individual, adjusted annually.
Asset Limits $9,430 (individual), $14,130 (couple).
DE

Three tiers; broader limits than some states.

Benefits
Covers Medicare Part B premiums ($174.70/month) Deductibles ($240/year) Copays (~20% of services)

Frequently Asked Questions about Parkview Nursing and Rehabilitation Center

What neighborhood is Parkview Nursing and Rehabilitation Center in?

Parkview Nursing and Rehabilitation Center is in the Wawaset Heights neighborhood.

Is Parkview Nursing and Rehabilitation Center in a walkable area?

Parkview Nursing and Rehabilitation Center has a walk score of 77. Very walkable. Most errands can be accomplished on foot, and many essentials are within a short walk.

What is the occupancy rate at Parkview Nursing and Rehabilitation Center?

Parkview Nursing and Rehabilitation Center's occupancy is 81.5%.

Does Parkview Nursing and Rehabilitation Center operate as a for-profit or non-profit?

Parkview Nursing and Rehabilitation Center is registered as a for-profit.

Are there photos of Parkview Nursing and Rehabilitation Center?

Yes — there are 5 photos of Parkview Nursing and Rehabilitation Center in the photo gallery on this page.

What is the address of Parkview Nursing and Rehabilitation Center?

Parkview Nursing and Rehabilitation Center is located at 2801 W 6Th St, Wilmington, DE 19805.

What is the phone number of Parkview Nursing and Rehabilitation Center?

(302) 655-6135 will put you in contact with the team at Parkview Nursing and Rehabilitation Center.

Guides for Better Senior Living

Care Cost Calculator: See Prices in Your Area

Nursing Home Data Explorer

Don’t Wait Too Long: 7 Red Flag Signs Your Parent Needs Assisted Living Now

The True Cost of Assisted Living in 2025 – And How Families Are Paying For It

Understanding Senior Living Costs: Pricing Models, Discounts & Financial Assistance