

Hospitalizations per 1,000 days
 Number of hospitalizations per 1,000 long-stay resident days.
1.55
Number of hospitalizations per 1,000 long-stay resident days.
1.55
Colorado average: 1.30

We arrange tours, appointments, and even moving support so you don’t have to

| Staff type | Hours / Day / Resident | vs state avg |
|---|---|---|
|
Registered Nurse (RN)
| 50m per day | ■ Avg State avg: 50m per day · National avg: 41m per day |
|
LPN / LVN
| 29m per day | ▼ 29% State avg: 41m per day · National avg: 52m per day |
|
Nurse Aide
| 2h 32m per day | ▲ 15% State avg: 2h 12m per day · National avg: 2h 20m per day |
|
Weekend Total Nursing
| 3h 25m per day | ▲ 5% State avg: 3h 16m per day · National avg: 3h 26m per day |
|
Physical Therapist
| 3m per day | ▼ 40% State avg: 5m per day · National avg: 4m per day |
|
Weekend RN
| 31m per day | ▼ 14% State avg: 36m per day · National avg: 28m per day |
Pelican Pointe Health and Rehabilitation Center is administrated by Kenneth Asovalu Hribar.
These measures show how residents usually do over time at this home, based on health outcomes and preventive care.
Colorado average: 1.30
Colorado average: 1.67
Colorado average: 50.6%
Quality measures are calculated from Minimum Data Set (MDS) assessments. For most measures, lower percentages indicate better care quality.
![]() 0.0 miles from city center
0.0 miles from city center
![]() Estimated distance in miles from Windsor's city center to Pelican Pointe Health and Rehabilitation Center's address, calculated via Google Maps.
Estimated distance in miles from Windsor's city center to Pelican Pointe Health and Rehabilitation Center's address, calculated via Google Maps.
Add your location
Pelican Pointe Health and Rehabilitation Center is located in WINDSOR, Colorado.
Here are the financial assistance programs available to residents in Colorado.
The information below is reported by the Colorado Department of Public Health and Environment, Health Facilities Division.
| Peaks Care Center |
NH Nursing Home Licensed facility providing 24/7 skilled nursing care for residents with complex, ongoing medical needs. Staffed by RNs, LPNs, and CNAs. Inspected and star-rated annually by CMS. Accepts Medicare (short-term rehab) and Medicaid (long-term care).
AL Assisted Living A licensed, long-term care setting for seniors or individuals with disabilities who need help with daily activities — like bathing, dressing, and medication management — but not 24-hour skilled nursing. Offers housing, meals, and around-the-clock support while aiming to maximize resident independence.
IL Independent Living Lifestyle-focused communities for older adults offering dining, activities, and transportation with minimal personal care. Best for active, independent seniors who want community without medical support. | Longmont (Coffman Street) | 92 | 80.1% | +5% | 3.50 | +41% | -9% | $0 | 22 | 4.4 | 1 | 77 | A+ | 80 | Bogie33 | $11.7M | $5.1M | 43.5% | 65189 | ||||
| Boulder Canyon Health and Rehabilitation |
NH Nursing Home Licensed facility providing 24/7 skilled nursing care for residents with complex, ongoing medical needs. Staffed by RNs, LPNs, and CNAs. Inspected and star-rated annually by CMS. Accepts Medicare (short-term rehab) and Medicaid (long-term care).
AL Assisted Living A licensed, long-term care setting for seniors or individuals with disabilities who need help with daily activities — like bathing, dressing, and medication management — but not 24-hour skilled nursing. Offers housing, meals, and around-the-clock support while aiming to maximize resident independence.
IL Independent Living Lifestyle-focused communities for older adults offering dining, activities, and transportation with minimal personal care. Best for active, independent seniors who want community without medical support.
MC Memory Care Secured, specialized care for people living with Alzheimer's or dementia. Staff trained in cognitive impairment, with higher staff-to-resident ratios and an environment designed to reduce confusion and wandering risk. | Boulder (Park East) | 140 | 76.5% | 0% | 3.45 | -13% | -11% | $0 | 22 | 4.4 | - | 109 | - | 71 | Ray Lauritzen | $19.2M | $8.7M | 45.5% | 65222 | ||||
| Life Care Center of Littleton |
NH Nursing Home Licensed facility providing 24/7 skilled nursing care for residents with complex, ongoing medical needs. Staffed by RNs, LPNs, and CNAs. Inspected and star-rated annually by CMS. Accepts Medicare (short-term rehab) and Medicaid (long-term care).
AL Assisted Living A licensed, long-term care setting for seniors or individuals with disabilities who need help with daily activities — like bathing, dressing, and medication management — but not 24-hour skilled nursing. Offers housing, meals, and around-the-clock support while aiming to maximize resident independence. | Littleton | 120 | 80.6% | +5% | 4.35 | +29% | +13% | $0 | 26 | 8.7 | 1 | 97 | A+ | 54 | Sara Dent | $18.4M | $9.8M | 53.4% | 65370 | ||||
| Woodlake Legacy Senior Living | - |
NH Nursing Home Licensed facility providing 24/7 skilled nursing care for residents with complex, ongoing medical needs. Staffed by RNs, LPNs, and CNAs. Inspected and star-rated annually by CMS. Accepts Medicare (short-term rehab) and Medicaid (long-term care).
AL Assisted Living A licensed, long-term care setting for seniors or individuals with disabilities who need help with daily activities — like bathing, dressing, and medication management — but not 24-hour skilled nursing. Offers housing, meals, and around-the-clock support while aiming to maximize resident independence.
IL Independent Living Lifestyle-focused communities for older adults offering dining, activities, and transportation with minimal personal care. Best for active, independent seniors who want community without medical support.
MC Memory Care Secured, specialized care for people living with Alzheimer's or dementia. Staff trained in cognitive impairment, with higher staff-to-resident ratios and an environment designed to reduce confusion and wandering risk. | Lakewood (Foothills) | 131 | 51.4% | -33% | - | - | - | - | - | - | - | - | - | - | - | - | 71 | #N/A | $7.6M | $3.1M | 41% | 65374 |
The legal owner and operator of Pelican Pointe Health and Rehabilitation Center is Belmont Ridge Healthcare, Inc..
Pelican Pointe Health and Rehabilitation Center has a walk score of 65. Moderately walkable. Some errands can be accomplished on foot, with a mix of nearby amenities.
Kenneth Asovalu Hribar is the administrator of Pelican Pointe Health and Rehabilitation Center.
Pelican Pointe Health and Rehabilitation Center has 104 beds.
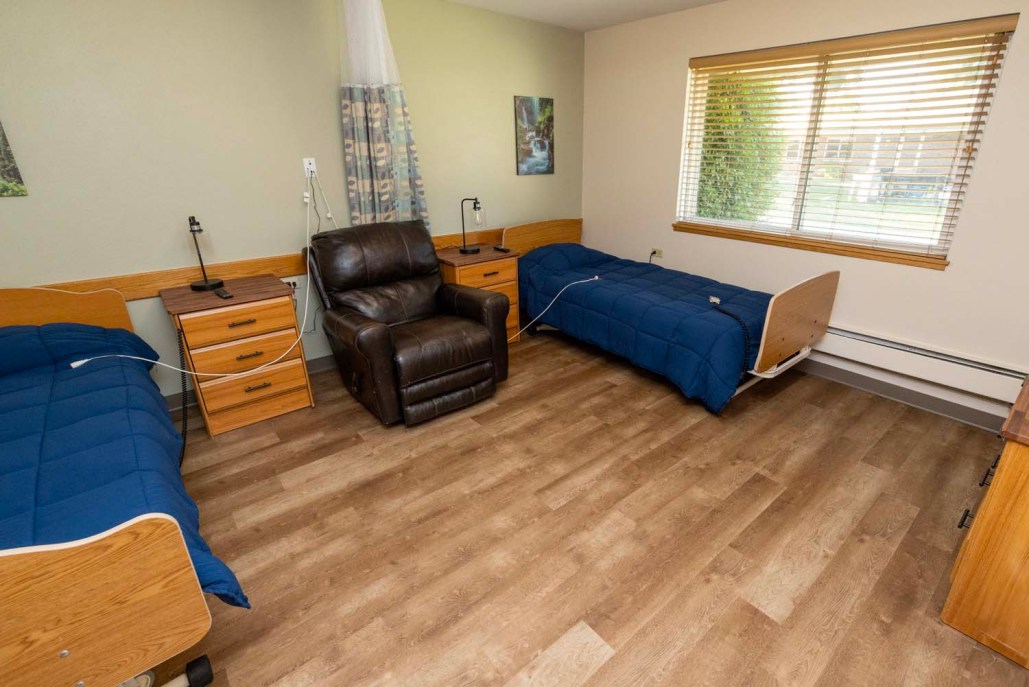
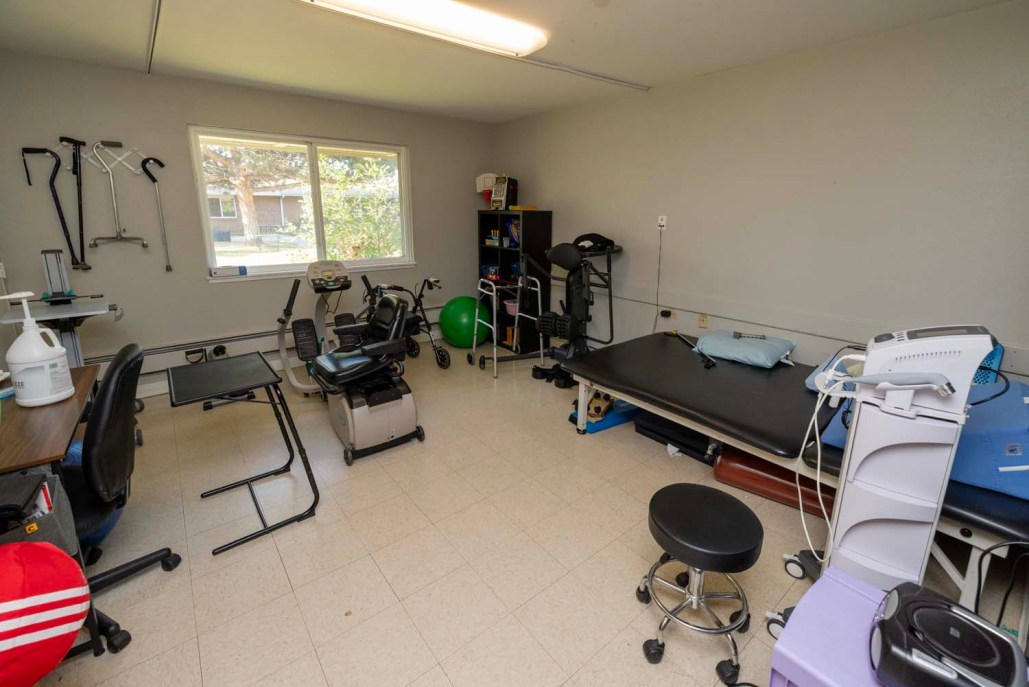
Yes — there are 4 photos of Pelican Pointe Health and Rehabilitation Center in the photo gallery on this page.
Pelican Pointe Health and Rehabilitation Center is located at 710 3RD ST.
(970) 686-7474 will put you in contact with the team at Pelican Pointe Health and Rehabilitation Center.
Care Cost Calculator: See Prices in Your Area
Nursing Home Data Explorer
Don’t Wait Too Long: 7 Red Flag Signs Your Parent Needs Assisted Living Now
The True Cost of Assisted Living in 2025 – And How Families Are Paying For It
Understanding Senior Living Costs: Pricing Models, Discounts & Financial Assistance


Thank you for your interest!
Our team will be in touch shortly to help with next steps.
