Penrose Harbor at Heron‘s Key
Nursing Home, Assisted Living & Memory Care · Olympia, WA
CMS overall rating Info The Overall CMS Rating is scored from 1 to 5 stars and combines results from health inspections, staffing levels, and quality measures. Health inspections carry the most weight. Staffing and quality scores can increase or decrease the final rating based on performance compared to state and national standards.

Penrose Harbor at Heron‘s Key

Nursing Home, Assisted Living & Memory Care · Olympia, WA
CMS overall rating Info The Overall CMS Rating is scored from 1 to 5 stars and combines results from health inspections, staffing levels, and quality measures. Health inspections carry the most weight. Staffing and quality scores can increase or decrease the final rating based on performance compared to state and national standards.
Calculator: See prices in your area
Penrose Harbor at Heron‘s Key accepts Medicare and private pay.

Overview of Penrose Harbor at Heron‘s Key

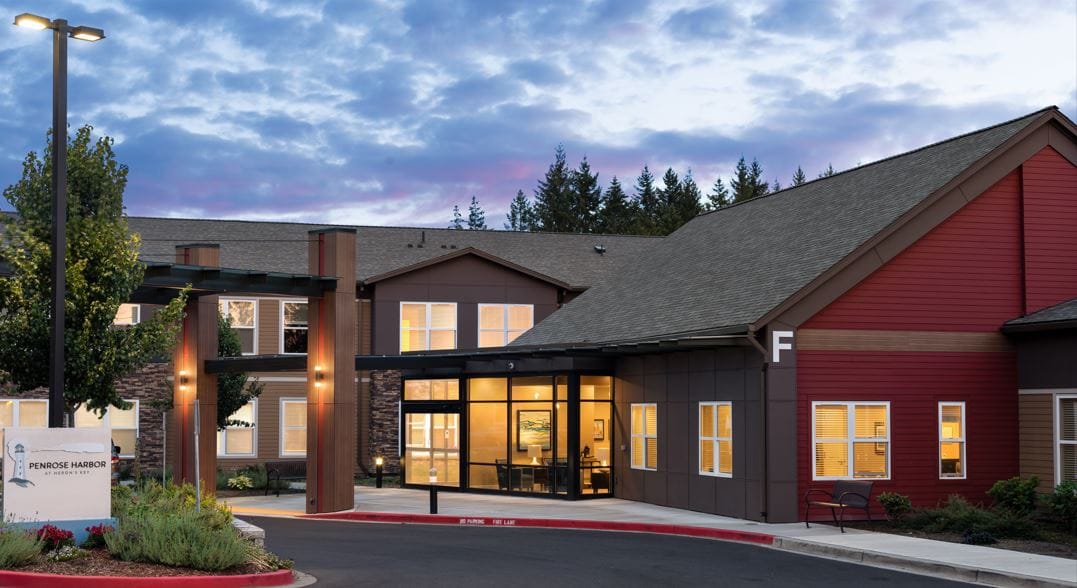
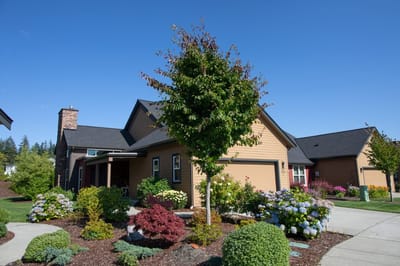
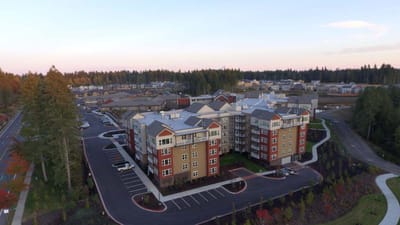
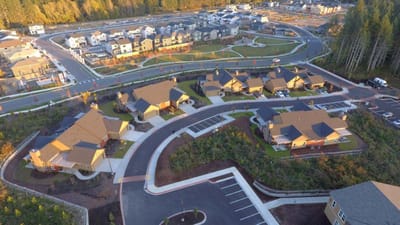
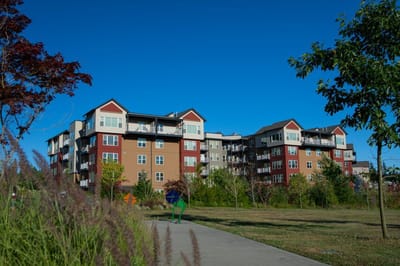
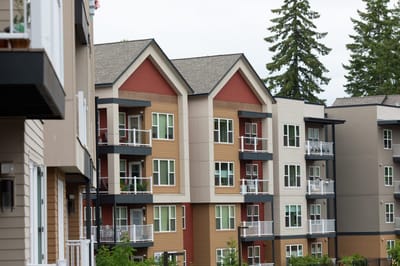
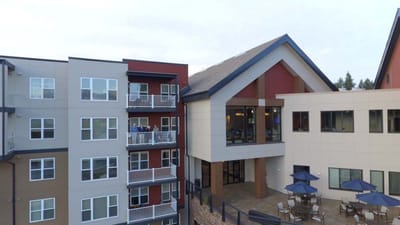
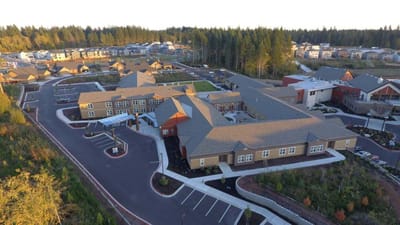
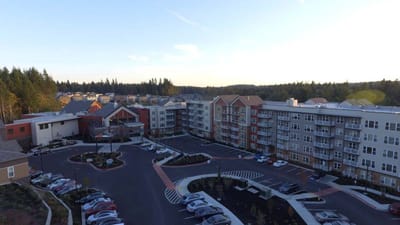
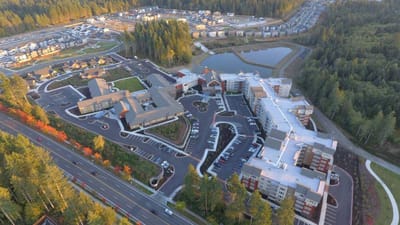
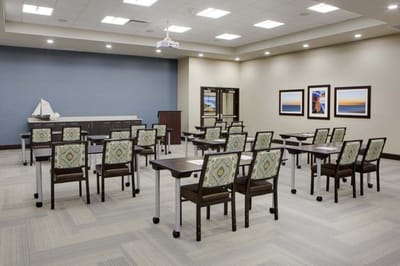
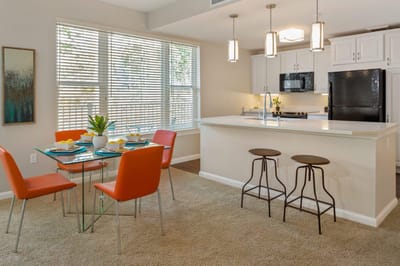
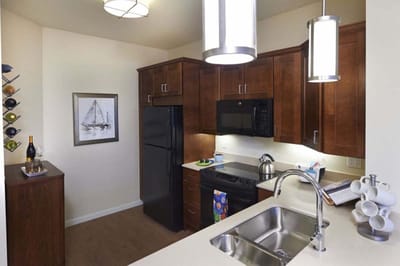
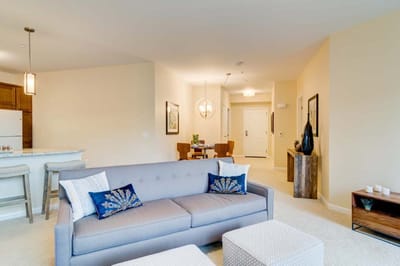
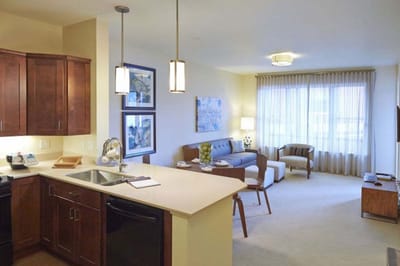
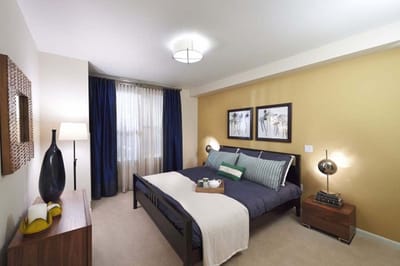
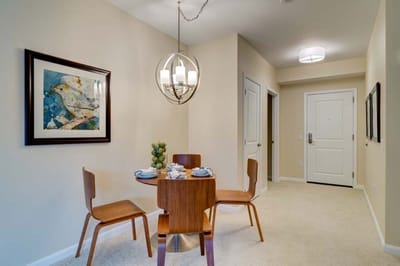
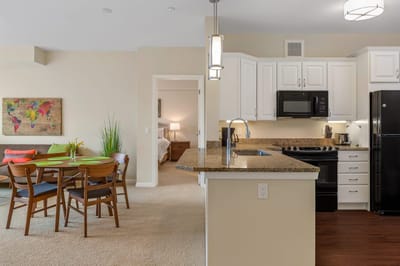
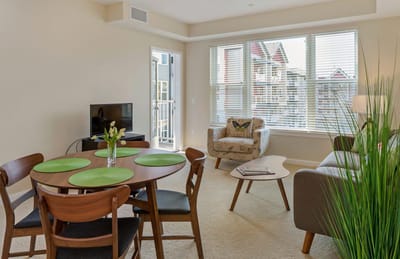
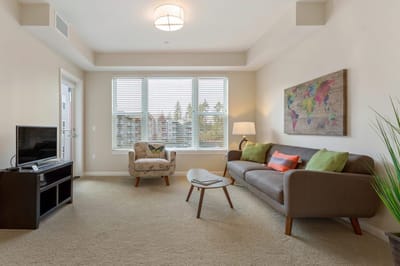
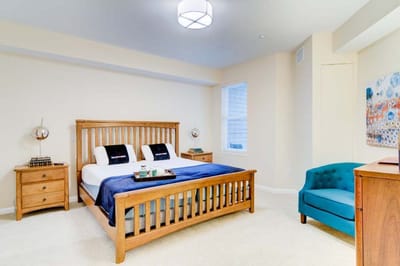
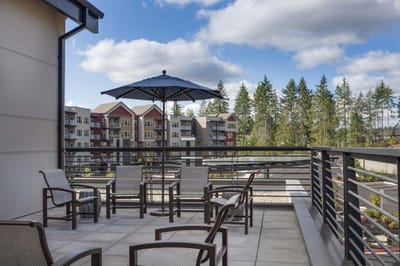
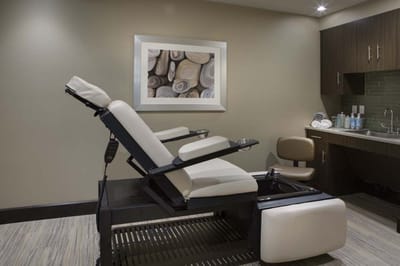
Nestled in the charming Harbor Hill neighborhood overlooking the scenic town of Gig Harbor, Washington, Penrose Harbor at Heron’s Key is a distinguished senior living community that caters to senior living, senior rehabilitation, and assisted living needs. Penrose Harbor at Heron’s Key prides itself on offering a serene and engaging environment where residents can thrive in retirement.

With a commitment to enhancing the well-being of seniors, this assisted living community provides a wide range of amenities and services that foster a vibrant and fulfilling senior living experience.

(253) 313-0800

Quality ratings

Measured by Centers for Medicare & Medicaid Services (CMS)

Overall rating Info The Overall CMS Rating combines results from health inspections, staffing levels and quality measures. Health inspections carry the most weight. Staffing and quality scores can increase or decrease the final rating based on performance compared to state and national standards.
▲ 44.5% Above WA avg. ▲ 44.5% Above WA avg.Click the badge to see the full State ranking.Click here to see the full State ranking.
Health Inspection Info Based on the results of the facility's three most recent standard inspections and any complaint investigations. CMS reviews the number, scope, and severity of deficiencies, with more recent findings weighted more heavily.
▲ 38.9% Above WA avg. ▲ 38.9% Above WA avg.Click the badge to see the full State ranking.Click here to see the full State ranking.
Staffing Info Measures average nursing staff hours per resident per day, including Registered Nurses (RNs) and total nursing staff. Ratings are adjusted based on the level of care residents require and are compared to state and national benchmarks.
▲ 29.9% Above WA avg. ▲ 29.9% Above WA avg.Click the badge to see the full State ranking.Click here to see the full State ranking.
Quality Measures Info Based on clinical and physical health indicators reported to CMS, such as hospital readmissions, falls, pressure ulcers, and improvements in mobility. These measures reflect how well residents' health needs are being managed.
▼ 26.5% Below WA avg. ▼ 26.5% Below WA avg.Click the badge to see the full State ranking.Click here to see the full State ranking.

Staffing hours breakdown

Info Daily nursing hours per resident by staff type, reported to CMS. Higher is generally better — compare this facility to state and national averages to see where staffing stands.

Hours per resident per day — compared to Washington state averages

Total nursing care / resident Info This home is ranked 1st out of 61 homes in Washington.

Total adjusted nursing hours per resident per day, combining RN, LPN, and aide time. CMS adjusts this for case-mix so facilities can be fairly compared.
5h 53m per day
Rank #1 / 61Nurse hours — State benchmarkedThis home is ranked 1st out of 61 homes in Washington.Shows adjusted nurse hours per resident per day benchmarked to the Washington average, with a ranking across 61 Washington SNFs. More hours mean more direct care. The national average is about 3.5 hrs; below 3.0 is a red flag.Click the rank badge to see the full State ranking.Click here to see the full State ranking.
This facility Washington avg (4h 22m per day)
vs Washington avg
+35%

1 of 6 metrics below state avg

Standout metric RN (Weekend) is +105% above state avg
Staff typeHours / Day / Residentvs state avg
Registered Nurse (RN) Info RNs hold the highest nursing license and can assess residents, interpret test results, and direct care plans. More RN hours per day often signals stronger clinical oversight and faster response to health changes. 1h 19m per day ▲ 49% State avg: 53m per day · National avg: 41m per day
LPN / LVN Info Licensed Practical Nurses (LPNs) or Licensed Vocational Nurses (LVNs) deliver routine hands-on care — medication administration, wound dressing, and monitoring vital signs. They work under RN supervision and make up a large share of daily bedside care. 40m per day ▼ 18% State avg: 49m per day · National avg: 52m per day
Nurse Aide Info Certified Nurse Aides (CNAs) provide the most direct day-to-day assistance: bathing, dressing, feeding, and mobility. Nurse aide hours are typically the largest staffing category and directly affect residents' quality of life. 3h 3m per day ▲ 14% State avg: 2h 41m per day · National avg: 2h 21m per day
Total Nursing (Weekend) Info Combined nursing hours (RN + LPN + Nurse Aide) per resident per day on weekends. Staffing often drops on weekends — this figure reveals whether the facility maintains adequate coverage outside of weekday hours. 4h 37m per day ▲ 22% State avg: 3h 47m per day · National avg: 3h 26m per day
Physical Therapist Info Hours per resident per day provided by licensed Physical Therapists (PTs) or PT Assistants. PT services help residents recover mobility after injury or illness and are especially important for post-acute (short-stay) rehabilitation. 8m per day ▲ 60% State avg: 5m per day · National avg: 4m per day
RN (Weekend) Info Registered nurse hours specifically on weekends. Facilities sometimes reduce RN presence on Saturdays and Sundays — a low weekend RN figure compared to weekday hours can indicate reduced clinical oversight when most administrative staff are absent. 1h 18m per day ▲ 105% State avg: 38m per day · National avg: 29m per day

Capacity and availability

This home usually has availability

Occupancy lower than 85% suggests more openings may be available.

Lower occupancy than the Washington average: 72.5%
Occupancy rate 69.7% Rank #35 / 64Occupancy rate — State benchmarkedThis home is ranked 35th out of 64 homes in Washington.Shows this facility's occupancy rate versus the Washington average, with its Statewide rank out of 64. Higher occupancy signals strong local demand and financial stability.Click the rank badge to see the full State ranking.Click here to see the full State ranking.
Avg. Length of Stay 140 days
Occupancy rate
69.7% Rank #35 / 64Occupancy rate — State benchmarkedThis home is ranked 35th out of 64 homes in Washington.Shows this facility's occupancy rate versus the Washington average, with its Statewide rank out of 64. Higher occupancy signals strong local demand and financial stability.Click the rank badge to see the full State ranking.Click here to see the full State ranking.
Avg. Length of Stay
140 days

Who this home usually serves

TYPE OF STAY

Mostly short-term rehab stays

Most residents typically stay for a few weeks or months before returning home or moving on.

Breakdown by payment type

Medicare

71% of new residents, usually for short-term rehab.

Typical stay 14 days

Private pay

29% of new residents, often for short stays.

Typical stay 2 - 3 years

Finances and operations

Voluntary non-profit community
Home revenue
$25.6M
Surplus of revenue
$1.6M
Voluntary non-profit community
Home revenue
$25.6M Rank #14 / 64Revenue — State benchmarkedThis home is ranked 14th out of 64 homes in Washington.Shows this facility's annual revenue compared to the Washington SNF average. Higher revenue generally means more resources for staffing and capital — read alongside Payroll %.Click the rank badge to see the full State ranking.Click here to see the full State ranking.
Surplus of revenue
$1.6M
Payroll costs Info The portion of the home's budget spent on staff, including nurses, caregivers, and other employees who support care and operations. Rank #27 / 64Payroll — State benchmarkedThis home is ranked 27th out of 64 homes in Washington.Shows total annual staff payroll benchmarked to the Washington average. Higher payroll investment relative to peers often signals better staffing and less reliance on cheaper contract labor.Click the rank badge to see the full State ranking.Click here to see the full State ranking.
$7.8M
30.3% of revenue Rank #61 / 64Payroll % — State benchmarkedThis home is ranked 61st out of 64 homes in Washington.Shows payroll as a percentage of revenue versus the Washington average. Well-run Washington SNFs typically land around 53–61% — the top third Statewide. Below 25% may signal understaffing or heavy agency use — read with Staffing ratings.Click the rank badge to see the full State ranking.Click here to see the full State ranking.
Other operating costs Info All remaining costs needed to run the home, such as food, utilities, building maintenance, supplies and administrative expenses.
$16.3M
Total costs $24.1M
Bed community size
49-bed community Rank #56 / 64Bed count — State benchmarkedThis home is ranked 56th out of 64 homes in Washington.Shows this facility's certified or reported bed count compared to other Washington SNFs. Larger communities may offer more amenities, programs, and on-site services for residents and families.Click the rank badge to see the full State ranking.Click here to see the full State ranking.
A moderately sized community that may balance personal attention with shared amenities and social activities.
Walk Score
Walk Score: 36 / 100 Rank #48 / 64Walk Score — State benchmarkedThis home is ranked 48th out of 64 homes in Washington.Shows how walkable this facility's neighborhood is compared to the average Walk Score across Washington SNFs. Higher scores benefit residents, families, and staff.Click the rank badge to see the full State ranking.Click here to see the full State ranking.
Somewhat walkable. A few nearby services may be reachable on foot, but most trips require transportation.

About this community

Awards

AwardsBest Nursing Home by U.S. News & World Report, High Performing ratings in both Short-Term Rehabilitation and Long-Term Care

License Details

Facility TypeBh
StatusOp
ExpirationOctober 31, 2026
CountyPierce
License Number2425

Payment & Insurance

1 service
Accept Medicare

Therapy & Rehabilitation

3 services
Rehabilitation Services
Respite Care
Short-Term Rehab

Staffing & Medical

1 service
24-Hour Staffing

Additional Policies & Features

HousekeepingYes
Linen ServiceYes
Utilities IncludedYes

Amenities & Lifestyle

Thoughtful Amenities
Delicious Dining
Fitness & Wellness
Committees & Groups
Pet Friendly Living
ActivitiesResidents enjoy a wide variety of senior activities and enrichment opportunities.

Dining & Nutrition

Food DescriptionResidents enjoy three delicious, chef-prepared meals each day, thoughtfully designed in coordination with our on-staff nutritionist.

What does this home offer?

Pets allowed icon
Pets allowed icon

Pets Allowed

Housing options icon

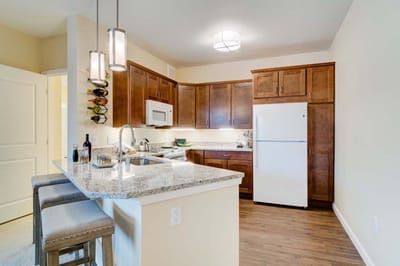
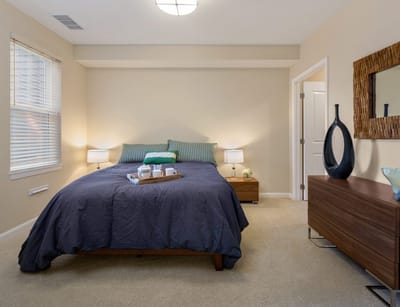
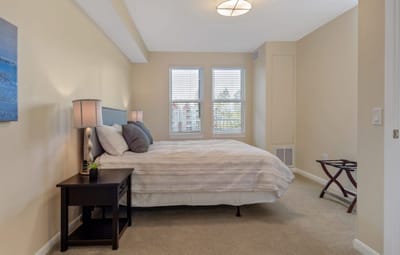
Housing Options: Suite

Building type icon
Building type icon

Building Type: Two-story

Transportation services icon

Transportation Services

Fitness and recreation icon

Fitness and Recreation

Types of Care at Penrose Harbor at Heron‘s Key

Assisted Living Memory Care

Contact Penrose Harbor at Heron‘s Key

Inspection History

In Washington, the Department of Social and Health Services, Residential Care Services conducts unannounced inspections and issues reports on the quality of care in all licensed settings.

Since 2022 · 4 years of data 31 deficiencies

Inspection Scorecard Info This scorecard compares key inspection, citation, and complaint metrics at this facility against the Washington state average. Metrics rated ≥15% worse than average are highlighted in red; those ≥15% better are highlighted in green.

Since 2022 vs. Washington state average
Latest Inspection November 15, 2024 Routine

Deficiencies Info Deficiencies are formal regulatory issues recorded during state inspections.

MetricThis FacilityWA Averagevs. WA Avg
Total deficiencies Info Formal regulatory issues recorded by inspectors across all inspection types. 3131 This facility has total deficiencies in line with the Washington average (31 vs. WA avg 31). Click this badge to view the full Washington ranking.— At avg
Deficiencies per year Info Average deficiencies per year since 2022. 7.87.8 This facility has deficiencies per year in line with the Washington average (7.8 vs. WA avg 7.8). Click this badge to view the full Washington ranking.— At avg

Inspection Reports Summary Info An editor-reviewed summary of the themes and findings across this facility's recent inspection reports.

The most recent inspection on November 15, 2024, identified multiple deficiencies related to resident rights, care planning, safe environment, staffing, and food safety. Earlier inspections showed a pattern of issues with medication management, resident care, infection control, and safety protocols, including a substantiated complaint investigation in August 2023 where a resident was injured due to failure to follow safe transfer procedures. The main themes across reports involved incomplete or inconsistent care planning, failure to follow established safety policies, and lapses in food sanitation and medication monitoring. No fines, immediate jeopardy findings, or license actions were listed in the available reports. The inspection history suggests ongoing challenges with regulatory compliance, with deficiencies continuing into the most recent review.

Read the full inspection reports for this facility, including detailed findings and corrective actions.

Show Inspection Reports

Health Inspection History

Inspections Since 2022
Total health inspections 4

Washington average 7.8


Last Health inspection on Nov 2024

Total health citations
33 Rank #16 / 61Health citations — State benchmarkedThis home is ranked 16th out of 61 homes in Washington.Shows this facility's total health deficiency citations benchmarked to the Washington State average, with a ranking across all 61 WA SNFs. Lower citation counts earn a better rank.Click the rank badge to see the full State ranking.Click here to see the full State ranking.

Washington average 48.9

Citations per inspection
8.25 Rank #44 / 61Citations per inspection — State benchmarkedThis home is ranked 44th out of 61 homes in Washington.Shows average deficiency citations per CMS inspection for this facility versus the Washington mean across 61 SNFs with citation data. Lower is better.Click the rank badge to see the full State ranking.Click here to see the full State ranking.

Washington average 6.92


Health citations are formal notices following inspections when they fail to comply with safety and care standards.

32 of 33 citations resulted from standard inspections; and 1 of 33 resulted from complaint investigations.

Breakdown of citation severity (last 4 years)
Critical Health citations
0
100% better than Washington average

Washington average: 0.3


Serious Health citations
1 Rank #1 / 39Serious citations (G–I) — State benchmarkedThis home is ranked 1st out of 39 homes in Washington.Shows G–I scope serious health citations for this facility versus other Washington SNFs. Lower counts rank better.Click the rank badge to see the full State ranking.Click here to see the full State ranking.
41% better than Washington average

Washington average: 1.7

0 critical citations Washington average: 0.3

1 serious citation Washington average: 1.7

31 moderate citations Washington average: 46.3

1 minor citation Washington average: 0.5
Citations history (last 4 years)
Environmental moderate citation Nov 15, 2024
Corrected

Nursing Services minor citation Nov 15, 2024
Corrected

Nutrition moderate citation Nov 15, 2024
Corrected

Pharmacy moderate citation Nov 15, 2024
Corrected

Living Spaces & Floor Plans for Penrose Harbor at Heron‘s Key

Assisted Living Floor Plan
Download PDF
Penrose Harbor at Heron‘s Key – GIG-13476_1.1_floorplan_all.pdf
Download PDF

Financial Assistance for
Nursing Home in Washington

Penrose Harbor at Heron‘s Key is located in Gig Harbor, Washington.
Here are the financial assistance programs available to residents in Washington.

Get Financial aid guidance

Community Options Program Entry System (COPES)

WA Medicaid COPES

Age 65+ or disabled
General Washington resident, Medicaid-eligible, nursing home-level care need.
Income Limits (2025) ~$2,829/month 300% FBR, individual
Asset Limits $2,000 (individual), $3,000 (couple).
WA

High demand in urban areas (e.g., Seattle).

Benefits
Personal care (5-7 hours/day) Respite (240 hours/year) Adult day care ($70/day) Home modifications ($1,500 avg.)

Washington Family Caregiver Support Program

WA NFCSP

Age Caregiver of someone 60+ (or with dementia)
General Washington resident.
Income Limits No strict limit; prioritizes low-income.
Asset Limits Not applicable.
WA

High urban demand; rural outreach.

Benefits
In-home respite (4-6 hours/day) Adult day care (~$70/day) Short-term facility care (up to 5 days)

Community First Choice (CFC)

Washington Community First Choice

Age 65+ (or disabled 18+)
General WA resident, Medicaid-eligible, need help with 2+ ADLs/IADLs.
Income Limits (2025) ~$2,829/month; QIT optional.
Asset Limits $2,000 (individual), $3,000 (couple).
WA

Broader than COPES; serves ~20,000; self-directed option.

Benefits
Personal care (4-6 hours/day) Respite (~240 hours/year) Assistive devices Training Transportation

Older Americans Act (OAA) Services

Washington OAA Services

Age 60+
General WA resident; no income/asset limits.
Income Limits (2025) None; donations encouraged.
Asset Limits Not assessed.
WA

13 AAAs; includes Meals on Wheels; rural focus.

Benefits
Meals (~$5-$7/meal) Transportation Homemaker services (~4 hours/week) Respite (~5 days/year) Legal aid

Medicare Savings Program (MSP)

Washington Medicare Savings Program

Age 65+ or disabled
General WA resident, Medicare Part A/B.
Income Limits (2025) ~$2,510/month (QMB), ~$3,380/month (SLMB), ~$3,598/month (QI)—individual.
Asset Limits $9,430 (individual), $14,130 (couple).
WA

Includes Extra Help for Part D; no waitlist.

Benefits
Covers Part B premiums ($174.70/month) Deductibles ($240/year) Copays (~20%)

VA Aid and Attendance (A&A) and Housebound Benefits

Washington VA Aid and Attendance/Housebound

Age 65+ or disabled veteran/spouse
General WA resident, wartime service, ADL help (A&A) or homebound.
Income Limits (2025) Net income < ~$1,984/month (veteran with dependent, A&A); pension offsets income.
Asset Limits ~$155,356 net worth
WA

High veteran use; supports rural/urban needs.

Benefits
Cash (~$1,433-$2,642/month veteran, ~$951-$1,318 spouse) for care costs

Senior Citizens Property Tax Exemption

Washington Senior Property Tax Exemption

Age 61+ or disabled retiree
General WA resident, homeowner, income-based.
Income Limits (2025) ~$45,000-$70,000/year varies by county, e.g., King: $70,000
Asset Limits Not assessed; home value cap varies ~$250,000-$400,000
WA

Saves ~$500-$1,500/year; offered statewide.

Benefits
Tax exemption (~$500-$1,500/year depending on county)

Senior Farmers’ Market Nutrition Program (SFMNP)

Washington SFMNP

Age 60+
General WA resident, low-income.
Income Limits (2025) ~$2,322/month 185% FPL
Asset Limits Not assessed.
WA

Vouchers (~$80/season); serves ~20,000 via AAAs.

Benefits
Vouchers (~$80/season) for produce at farmers’ markets

Places of interest near Penrose Harbor at Heron‘s Key

Address 41.4 miles from city center Info Estimated distance in miles from Gig Harbor's city center to Penrose Harbor at Heron‘s Key's address, calculated via Google Maps. — 9.55 miles to nearest hospital (MultiCare Tacoma General Hospital)

Calculate Travel Distance to Penrose Harbor at Heron‘s Key

Add your location

Address

Staffing Data

Reporting period: April 1 – June 30, 2025 (Q2 2025). Source: CMS Payroll-Based Journal report.

Total staff 69
Employees 57
Contractors 12
Staff to resident ratio 4.60:1
148% better than Washington average
Washington average ratio: 1.85:1 Washington average ratio: 1.85:1See full Washington ranking
Avg staff/day 20
Average shift 6.7 hours
17% worse than Washington average
Washington average: 8.1 hours Washington average shift: 8.1 hoursSee full Washington ranking
Total staff hours (quarter) 12,128

Nursing staff breakdown

Q2 2025 · Apr 1 – Jun 30 More info This data comes from the CMS Payroll-Based Journal report covering April 1 – June 30, 2025.
Registered Nurse

Manages medical care and health needs.

Total count 11
Average shift length Info Average shift length. Calculated as total hours divided by days worked and average staff per day. 7.5 hours

No contractors work on this role.

Licensed Practical Nurse

Assists with medical care and medications.

Total count 5
Average shift length Info Average shift length. Calculated as total hours divided by days worked and average staff per day. 8.9 hours

No contractors work on this role.

Certified Nursing Assistant

Helps with daily care and mobility.

Total count 32
Average shift length Info Average shift length. Calculated as total hours divided by days worked and average staff per day. 7.5 hours

No contractors work on this role.

Contractor staffing

Q2 2025 · Apr 1 – Jun 30 More info This data comes from the CMS Payroll-Based Journal report covering April 1 – June 30, 2025.

Total hours from contractors

7.2%

877 contractor hours this quarter

Respiratory Therapy Technician: 5 Qualified Social Worker: 2 Physical Therapy Assistant: 1 Speech Language Pathologist: 1 Diagnostic X-ray Services Staff: 1 Occupational Therapy Assistant: 1 Medical Director: 1

Staff by category

Q2 2025 · Apr 1 – Jun 30 More info This data comes from the CMS Payroll-Based Journal report covering April 1 – June 30, 2025.
Certified Nursing Assistant320325,58991100%7.5
Registered Nurse110112,26791100%7.5
Licensed Practical Nurse5056135459%8.9
Clinical Nurse Specialist1015126470%8
Nurse Practitioner1015046369%8
Mental Health Service Worker1014976066%8.3
Administrator1014725965%8
Other Dietary Services Staff3034438695%2.8
Speech Language Pathologist0113526066%5.9
Respiratory Therapy Technician0553145459%5.6
Occupational Therapy Aide1012232932%7.7
Physical Therapy Assistant0111923842%5
Dietitian1011316369%2.1
Occupational Therapy Assistant011933%3
Qualified Social Worker022544%1.1
Medical Director011333%1
Diagnostic X-ray Services Staff011322%1.3
32 Certified Nursing Assistant
% of Days 100%
11 Registered Nurse
% of Days 100%
5 Licensed Practical Nurse
% of Days 59%
1 Clinical Nurse Specialist
% of Days 70%
1 Nurse Practitioner
% of Days 69%
1 Mental Health Service Worker
% of Days 66%
1 Administrator
% of Days 65%
3 Other Dietary Services Staff
% of Days 95%
1 Speech Language Pathologist
% of Days 66%
5 Respiratory Therapy Technician
% of Days 59%
1 Occupational Therapy Aide
% of Days 32%
1 Physical Therapy Assistant
% of Days 42%
1 Dietitian
% of Days 69%
1 Occupational Therapy Assistant
% of Days 3%
2 Qualified Social Worker
% of Days 4%
1 Medical Director
% of Days 3%
1 Diagnostic X-ray Services Staff
% of Days 2%

Facility Characteristics

Source: CMS Long-Term Care Facility Characteristics (Data as of Jan 2026)

Total residents 15
Private pay or other
15
100% of residents
Programs & Services
Residents Group

Residents meet regularly to discuss policies, care quality, and activities

Family Member Group

Family members meet regularly to discuss policies, care quality, and activities

CCRC

Part of a Continuing Care Retirement Community offering multiple care levels

Active Family Council

Organized group of family members that meets regularly to discuss facility policies, resident care, and activities.

Active Resident Council

Organized group of residents that meets regularly to discuss facility policies, quality of life, and activities.

Quality of care over time

These measures show how residents usually do over time at this home, based on health outcomes and preventive care.

High-risk clinical events score Info A composite score based on pressure ulcers, falls with injury, weight loss, walking ability decline, and activities of daily living decline. 8.6
14% better than Washington average

Washington average: 10.0

Functional decline score Info A composite score based on activities of daily living decline, walking ability decline, and incontinence. 24.2
16% worse than Washington average

Washington average: 20.9

Long-stay resident measures
Above average Washington avg: 3.6 Info CMS star rating based on long-stay quality measure performance. 5 stars = significantly above average, 1 star = significantly below average.
Need for Help with Daily Activities Increased Info Percent of long-stay residents whose need for help with daily activities has increased 10.3%
37% better than Washington average

Washington average: 16.4%

Walking Ability Worsened Info Percent of long-stay residents whose ability to move independently worsened 27.9%
28% worse than Washington average

Washington average: 21.8%

Low Risk Residents with Bowel/Bladder Incontinence Info Percent of low risk long-stay residents who lose control of their bowels or bladder 34.3%
41% worse than Washington average

Washington average: 24.3%

Falls with Major Injury Info Percent of long-stay residents experiencing one or more falls with major injury 1.6%
39% better than Washington average

Washington average: 2.6%

High Risk Residents with Pressure Ulcers Info Percent of long-stay high risk residents with pressure ulcers 3.2%
36% better than Washington average

Washington average: 4.9%

Urinary Tract Infection Info Percent of long-stay residents with a urinary tract infection 3.3%
88% worse than Washington average

Washington average: 1.7%

Lost Too Much Weight Info Percent of long-stay residents who lose too much weight 0.0%
100% better than Washington average

Washington average: 5.8%

Depressive Symptoms Info Percent of long-stay residents who have depressive symptoms 3.5%
79% better than Washington average

Washington average: 16.2%

Antipsychotic Use Info Percent of long-stay residents who received an antipsychotic medication 38.1%
163% worse than Washington average

Washington average: 14.5%

Pneumococcal Vaccine Info Percent of long-stay residents assessed and appropriately given the pneumococcal vaccine 100.0%
In line with Washington average

Washington average: 96.2%

Short-stay resident measures
Significantly above average Washington avg: 3.6 Info CMS star rating based on short-stay quality measure performance. 5 stars = much above average, 1 star = much below average.
Pneumococcal Vaccine Info Percent of short-stay residents assessed and appropriately given the pneumococcal vaccine 100.0%
14% better than Washington average

Washington average: 88.1%

Antipsychotic medication increase Info Percent of short-stay residents who newly received an antipsychotic medication 5.3%
270% worse than Washington average

Washington average: 1.4%

Falls with major injury Info Percentage of SNF residents who experience falls with major injury during their stay. 0.0%
100% better than Washington average

Washington average: 0.8%

Ability to care for self at discharge Info Percentage of residents at or above expected ability to care for themselves at discharge. 75.0%
40% better than Washington average

Washington average: 53.7%

Successful return to home or community Info Rate of successful return to home or community from a skilled nursing facility. 56.0%
11% better than Washington average

Washington average: 50.6%

Penalties and fines

Federal penalties imposed by CMS for regulatory violations, including civil money penalties (fines) and denials of payment for new Medicare/Medicaid admissions.

Source: CMS Penalties Database (Data as of Jan 2026)

Total fines amount $15K Rank #29 / 61Federal fines — State benchmarkedThis home is ranked 29th out of 61 homes in Washington.Shows this facility's cumulative CMS federal fine dollars versus the Washington average among facilities with fines, and where it ranks among 61 skilled nursing facilities in the pool. Lower total dollars mean a better rank.Click the rank badge to see the full State ranking.Click here to see the full State ranking.
82% lower than Washington average

Washington average: $82K

Number of fines 1
46% fewer fines than Washington average

Washington average: 1.8

Payment Denials Info Serious action where Medicare and/or Medicaid temporarily stops payments for new residents until issues are fixed. 0
100% fewer payment denials than Washington average

Washington average: 0.3

Fines amount comparison
This facility $15K
Washington average $82K
Penalty History

Penalties are imposed by CMS for violations of federal nursing home regulations.

1 penalty in the past 3 years

Aug 31, 2023 · $15K

Civil Money Penalty Info Fines imposed for noncompliance, which can be assessed per day or per instance of violation. Aug 31, 2023
$15K

Last updated: Jan 2026

Guides for Better Senior Living

Care Cost Calculator: See Prices in Your Area

Nursing Home Data Explorer

Don’t Wait Too Long: 7 Red Flag Signs Your Parent Needs Assisted Living Now

The True Cost of Assisted Living in 2025 – And How Families Are Paying For It

Understanding Senior Living Costs: Pricing Models, Discounts & Financial Assistance

Frequently Asked Questions about Penrose Harbor at Heron‘s Key

Is Penrose Harbor at Heron‘s Key in a walkable area?

Penrose Harbor at Heron‘s Key has a walk score of 36. Somewhat walkable. A few nearby services may be reachable on foot, but most trips require transportation.

What is the license number of Penrose Harbor at Heron‘s Key?

According to WA state health department records, Penrose Harbor at Heron‘s Key's license number is 2425.

When does Penrose Harbor at Heron‘s Key's license expire?

According to WA state health department records, Penrose Harbor at Heron‘s Key's license expires on October 31, 2026.

Does Penrose Harbor at Heron‘s Key have different floorplan options?

Yes — see the floorplan options available at Penrose Harbor at Heron‘s Key on this page.

How many beds does Penrose Harbor at Heron‘s Key have?

Penrose Harbor at Heron‘s Key has 49 beds.

Are there photos of Penrose Harbor at Heron‘s Key?

Yes — there are 48 photos of Penrose Harbor at Heron‘s Key in the photo gallery on this page.

What is the phone number of Penrose Harbor at Heron‘s Key?

(253) 313-0800 will put you in contact with the team at Penrose Harbor at Heron‘s Key.

Explore Open Rooms
1 Contact details
2 What type of senior care service are you looking for?
3 What budget do you have in mind for senior care?
4 How soon do you need to find care?
5 Additional details

Thank you for your interest!

Our team will be in touch shortly to help with next steps.