Olympia Manor Rehabilitation Center
Nursing Home, Respite Care & Skilled Nursing · Olympia, WA
CMS overall rating Info CMS (the Centers for Medicare & Medicaid Services) is the federal agency that rates nursing home quality. Its Overall Rating runs from 1 to 5 stars, combining health inspections, staffing, and quality measures, with inspections weighted most heavily.

Olympia Manor Rehabilitation Center

Nursing Home, Respite Care & Skilled Nursing · Olympia, WA
CMS overall rating Info CMS (the Centers for Medicare & Medicaid Services) is the federal agency that rates nursing home quality. Its Overall Rating runs from 1 to 5 stars, combining health inspections, staffing, and quality measures, with inspections weighted most heavily.
Calculator: See prices in your area
Olympia Manor Rehabilitation Center accepts Medicare and private pay.

Overview of Olympia Manor Rehabilitation Center

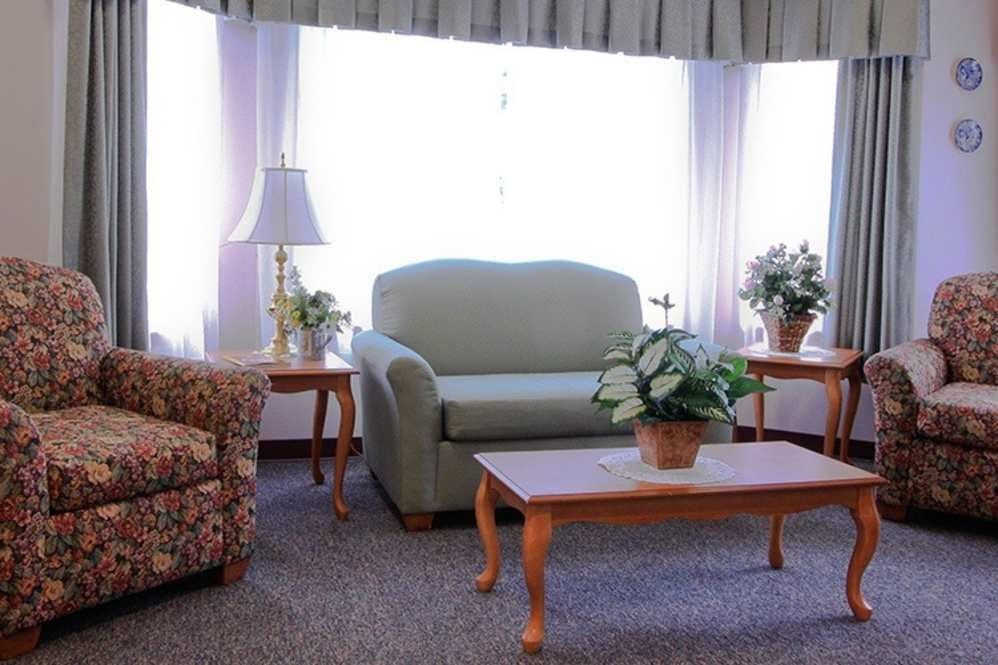
Serving residents in Olympia, Washington, Olympia Manor Rehabilitation Center is a skilled nursing and respite care community in the Cain Road neighborhood, a few miles from downtown. The community accepts Medicare and private pay, giving families more than one payment option. Most people come to Olympia Manor for short-term rehabilitation, often through Medicare, rather than for long-term nursing care.

The 71-bed community usually operates near full capacity. It has an occupancy rate of about 89%. Residents stay an average of 34 days, because of the community’s focus on rehabilitation and returning home after recovery. Nurse staffing averages about 3 hours and 12 minutes per resident each day, including around 1 hour and 16 minutes of registered nurse care. This combination provides residents with regular hands-on assistance and ongoing clinical nursing support throughout their stay.

The neighborhood has a Walk Score of 14, so most errands and outings require a car instead of a short walk. This is helpful for families to keep in mind when planning visits or taking care of nearby errands.

Families considering Olympia Manor for short-term rehabilitation should ask about the available room options and how daily therapy sessions are scheduled, as those details are not included in the current community profile.

Quality ratings

Measured by Centers for Medicare & Medicaid Services (CMS)

Overall rating Info The Overall CMS Rating combines results from health inspections, staffing levels and quality measures. Health inspections carry the most weight. Staffing and quality scores can increase or decrease the final rating based on performance compared to state and national standards.
▲ 55.0% Above WA avg. ▲ 55.0% Above WA avg.WA average: 3.2Click the badge to see the full State ranking.Click here to see the full State ranking.
Health Inspection Info Based on the results of the facility's three most recent standard inspections and any complaint investigations. CMS reviews the number, scope, and severity of deficiencies, with more recent findings weighted more heavily.
▲ 42.1% Above WA avg. ▲ 42.1% Above WA avg.WA average: 2.8Click the badge to see the full State ranking.Click here to see the full State ranking.
Staffing Info Measures average nursing staff hours per resident per day, including Registered Nurses (RNs) and total nursing staff. Ratings are adjusted based on the level of care residents require and are compared to state and national benchmarks.
▼ 12.4% Below WA avg. ▼ 12.4% Below WA avg.WA average: 3.4Click the badge to see the full State ranking.Click here to see the full State ranking.
Quality Measures Info Based on clinical and physical health indicators reported to CMS, such as hospital readmissions, falls, pressure ulcers, and improvements in mobility. These measures reflect how well residents' health needs are being managed.
▲ 27.2% Above WA avg. ▲ 27.2% Above WA avg.WA average: 3.9Click the badge to see the full State ranking.Click here to see the full State ranking.

Staffing hours breakdown

Info Daily nursing hours per resident by staff type, reported to CMS. Higher is generally better — compare this facility to state and national averages to see where staffing stands.

Hours per resident per day — compared to Washington state averages

Total nursing care / resident Info This home is ranked 85th out of 90 homes in Washington for nurse hours. Total adjusted nursing hours per resident per day, combining RN, LPN, and aide time. CMS adjusts this for case-mix so facilities can be fairly compared.
3h 12m per day
Rank #85 / 90Nurse hours — State benchmarkedThis home is ranked 85th out of 90 homes in Washington. Shows adjusted nurse hours per resident per day benchmarked to the Washington average, with a ranking across 90 Washington facilities. More hours mean more direct care. The national average is about 3.5 hrs; below 3.0 is a red flag.Rankings are based only on facilities in Washington that report data for that category. Facilities without available data are excluded from the ranking.Click the rank badge to see the full State ranking.Click here to see the full State ranking.
This facility Washington avg (4h 13m per day)
vs Washington avg
-24%

2 of 6 metrics below state avg

Standout metric Physical Therapist is +159% above state avg
Staff typeHours / Day / Residentvs state avg
Registered Nurse (RN) Info RNs hold the highest nursing license and can assess residents, interpret test results, and direct care plans. More RN hours per day often signals stronger clinical oversight and faster response to health changes. 1h 16m per day ▲ 43% State avg: 53m per day · National avg: 41m per day
LPN / LVN Info Licensed Practical Nurses (LPNs) or Licensed Vocational Nurses (LVNs) deliver routine hands-on care — medication administration, wound dressing, and monitoring vital signs. They work under RN supervision and make up a large share of daily bedside care. 33m per day ▼ 33% State avg: 49m per day · National avg: 52m per day
Nurse Aide Info Certified Nurse Aides (CNAs) provide the most direct day-to-day assistance: bathing, dressing, feeding, and mobility. Nurse aide hours are typically the largest staffing category and directly affect residents' quality of life. 2h 36m per day ▼ 3% State avg: 2h 41m per day · National avg: 2h 21m per day
Weekend Total Nursing Info Combined nursing hours (RN + LPN + Nurse Aide) per resident per day on weekends. Staffing often drops on weekends — this figure reveals whether the facility maintains adequate coverage outside of weekday hours. 3h 47m per day ■ Avg State avg: 3h 47m per day · National avg: 3h 26m per day
Physical Therapist Info Hours per resident per day provided by licensed Physical Therapists (PTs) or PT Assistants. PT services help residents recover mobility after injury or illness and are especially important for post-acute (short-stay) rehabilitation. 13m per day ▲ 159% State avg: 5m per day · National avg: 4m per day
Weekend RN Info Registered nurse hours specifically on weekends. Facilities sometimes reduce RN presence on Saturdays and Sundays — a low weekend RN figure compared to weekday hours can indicate reduced clinical oversight when most administrative staff are absent. 59m per day ▲ 55% State avg: 38m per day · National avg: 29m per day

Capacity and availability

This home usually has limited availability

Higher occupancy than the Washington average: 72.5%
Occupancy rate
89.3% Rank #50 / 310Occupancy rate — State benchmarkedThis home is ranked 50th out of 310 homes in Washington. Shows this facility's occupancy rate versus the Washington average, with its Statewide rank out of 310. Higher occupancy signals strong local demand and financial stability.Rankings are based only on facilities in Washington that report data for that category. Facilities without available data are excluded from the ranking.Click the rank badge to see the full State ranking.Click here to see the full State ranking.
Avg. Length of Stay Info Average number of days residents stay at this facility, based on CMS cost report data. Shorter stays often reflect post-acute or rehab care; longer stays reflect long-term care.
34 days
Bed community size
71-bed community Rank #205 / 366Bed count — State benchmarkedThis home is ranked 205th out of 366 homes in Washington. Shows this facility's certified or reported bed count compared to other Washington facilities. Larger communities may offer more amenities, programs, and on-site services for residents and families.Rankings are based only on facilities in Washington that report data for that category. Facilities without available data are excluded from the ranking.Click the rank badge to see the full State ranking.Click here to see the full State ranking.
A moderately sized community that may balance personal attention with shared amenities and social activities.
Walk Score
Walk Score: 14 / 100 Rank #565 / 628Walk Score — State benchmarkedThis home is ranked 565th out of 628 homes in Washington. Shows how walkable this facility's neighborhood is compared to the average Walk Score across Washington facilities. Higher scores benefit residents, families, and staff.Rankings are based only on facilities in Washington that report data for that category. Facilities without available data are excluded from the ranking.Click the rank badge to see the full State ranking.Click here to see the full State ranking.
Car-dependent. Most errands require a car, with limited nearby walkable options.

Contact Olympia Manor Rehabilitation Center

Staffing Data

Reporting period: October 1 – December 31, 2025 (Q4 2025). Source: CMS Payroll-Based Journal report.

Total staff 145
Employees 119
Contractors 26
Staff to resident ratio 2.04 : 1
10% more staff per resident than Washington average
Washington average ratio: 1.86 : 1 Washington average ratio: 1.86 : 1See full Washington ranking
Avg staff/day 52
Average shift 7.7 hours
5% worse than Washington average
Washington average: 8.1 hours Washington average shift: 8.1 hoursSee full Washington ranking
Total staff hours (quarter) 36,663

Nursing staff breakdown

Q4 2025 · Oct 1 – Dec 31 More info This data comes from the CMS Payroll-Based Journal report covering October 1 – December 31, 2025.
Registered Nurse

Manages medical care and health needs.

RN Staff Info 32 total: 20 full-time employees and 12 contractors. 32
Average shift length Info Average shift length. Calculated as total hours divided by days worked and average staff per day. 8.4 hours
Licensed Practical Nurse

Assists with medical care and medications.

LPN Staff Info 22 total: 16 full-time employees and 6 contractors. 22
Average shift length Info Average shift length. Calculated as total hours divided by days worked and average staff per day. 7.7 hours
Certified Nursing Assistant

Helps with daily care and mobility.

CNA Staff Info 54 total: 50 full-time employees and 4 contractors. 54
Average shift length Info Average shift length. Calculated as total hours divided by days worked and average staff per day. 7.6 hours

Contractor staffing

Q4 2025 · Oct 1 – Dec 31 More info This data comes from the CMS Payroll-Based Journal report covering October 1 – December 31, 2025.

Total hours from contractors

5.6%

2,038 contractor hours this quarter

Registered Nurse: 12 Licensed Practical Nurse: 6 Certified Nursing Assistant: 4 Speech Language Pathologist: 1 Physical Therapy Assistant: 1 Medical Director: 1 Feeding Assistant: 1

Staff by category

Q4 2025 · Oct 1 – Dec 31 More info This data comes from the CMS Payroll-Based Journal report covering October 1 – December 31, 2025.
Certified Nursing Assistant5045416,48192100%7.6
Registered Nurse2012327,09392100%8.4
Licensed Practical Nurse166223,48692100%7.7
Speech Language Pathologist6172,0638390%7.3
Respiratory Therapy Technician6061,3678289%6.7
Dental Services Staff2029807278%7.9
Nurse Practitioner4049286470%8
Physical Therapy Assistant4155564751%7
Physical Therapy Aide3035564246%9.3
Therapeutic Recreation Specialist1015496368%8.7
Dietitian1015156773%7.7
Other Dietary Services Staff1015146571%7.9
Feeding Assistant0113905257%7.5
Qualified Social Worker2023806368%6
Occupational Therapy Aide1013794953%7.7
Administrator1012566470%4
Medical Director0111261415%9
Respiratory Therapist1014667%7.6
54 Certified Nursing Assistant
% of Days 100%
32 Registered Nurse
% of Days 100%
22 Licensed Practical Nurse
% of Days 100%
7 Speech Language Pathologist
% of Days 90%
6 Respiratory Therapy Technician
% of Days 89%
2 Dental Services Staff
% of Days 78%
4 Nurse Practitioner
% of Days 70%
5 Physical Therapy Assistant
% of Days 51%
3 Physical Therapy Aide
% of Days 46%
1 Therapeutic Recreation Specialist
% of Days 68%
1 Dietitian
% of Days 73%
1 Other Dietary Services Staff
% of Days 71%
1 Feeding Assistant
% of Days 57%
2 Qualified Social Worker
% of Days 68%
1 Occupational Therapy Aide
% of Days 53%
1 Administrator
% of Days 70%
1 Medical Director
% of Days 15%
1 Respiratory Therapist
% of Days 7%

Penalties and fines

Includes penalties issued in 2024

Federal penalties imposed by CMS for regulatory violations, including civil money penalties (fines) and denials of payment for new Medicare/Medicaid admissions.

Source: CMS Penalties Database (Data as of Jan 2026)

Total fines amount $60K Rank #61 / 92Federal fines — State benchmarkedThis home is ranked 61st out of 92 homes in Washington. Shows this facility's cumulative CMS federal fine dollars versus the Washington average among facilities with fines, and where it ranks among 92 facilities in the pool. Lower total dollars mean a better rank.Rankings are based only on facilities in Washington that report data for that category. Facilities without available data are excluded from the ranking.Click the rank badge to see the full State ranking.Click here to see the full State ranking.
27% lower than Washington average

Washington average: $82K

Number of fines 1
46% fewer fines than Washington average

Washington average: 1.8

Payment Denials Info Serious action where Medicare and/or Medicaid temporarily stops payments for new residents until issues are fixed. 0
100% fewer payment denials than Washington average

Washington average: 0.3

Fines amount comparison
This facility $60K
Washington average $82K
Penalty History

Penalties are imposed by CMS for violations of federal nursing home regulations.

1 penalty in the past 3 years

Aug 12, 2024 · $60K

Civil Money Penalty Info Fines imposed for noncompliance, which can be assessed per day or per instance of violation. Aug 12, 2024
$60K

Last updated: Jan 2026

Quality of care over time

These measures show how residents usually do over time at this home, based on health outcomes and preventive care.

High-risk clinical events score Info A composite score based on pressure ulcers, falls with injury, weight loss, walking ability decline, and activities of daily living decline. 3.8
62% better than Washington average

Washington average: 10.0

Functional decline score Info A composite score based on activities of daily living decline, walking ability decline, and incontinence. 6.1
71% better than Washington average

Washington average: 20.9

Long-stay resident measures
Significantly above average Info CMS star rating based on long-stay quality measure performance. 5 stars = significantly above average, 1 star = significantly below average.
Need for Help with Daily Activities Increased Info Percent of long-stay residents whose need for help with daily activities has increased 0.0%
100% better than Washington average

Washington average: 16.4%

Low Risk Residents with Bowel/Bladder Incontinence Info Percent of low risk long-stay residents who lose control of their bowels or bladder 12.2%
50% better than Washington average

Washington average: 24.3%

Falls with Major Injury Info Percent of long-stay residents experiencing one or more falls with major injury 0.0%
100% better than Washington average

Washington average: 2.6%

High Risk Residents with Pressure Ulcers Info Percent of long-stay high risk residents with pressure ulcers 15.1%
207% worse than Washington average

Washington average: 4.9%

Urinary Tract Infection Info Percent of long-stay residents with a urinary tract infection 0.0%
100% better than Washington average

Washington average: 1.7%

Lost Too Much Weight Info Percent of long-stay residents who lose too much weight 0.0%
100% better than Washington average

Washington average: 5.8%

Depressive Symptoms Info Percent of long-stay residents who have depressive symptoms 18.2%
12% worse than Washington average

Washington average: 16.2%

Antipsychotic Use Info Percent of long-stay residents who received an antipsychotic medication 0.0%
100% better than Washington average

Washington average: 14.5%

Pneumococcal Vaccine Info Percent of long-stay residents assessed and appropriately given the pneumococcal vaccine 100.0%
In line with Washington average

Washington average: 96.2%

Short-stay resident measures
Above average Info CMS star rating based on short-stay quality measure performance. 5 stars = much above average, 1 star = much below average.
Pneumococcal Vaccine Info Percent of short-stay residents assessed and appropriately given the pneumococcal vaccine 99.9%
13% better than Washington average

Washington average: 88.1%

Antipsychotic medication increase Info Percent of short-stay residents who newly received an antipsychotic medication 1.8%
26% worse than Washington average

Washington average: 1.4%

Influenza Vaccine Info Percent of short-stay residents assessed and appropriately given the seasonal influenza vaccine 91.0%
11% better than Washington average

Washington average: 82.0%

Re-hospitalized after SNF stay Info Percentage of short-stay residents who were re-hospitalized after their nursing home admission. 24.4%
23% worse than Washington average

Washington average: 19.9%

Emergency department visits Info Percentage of short-stay residents who had an outpatient emergency department visit. 9.8%
26% better than Washington average

Washington average: 13.2%

Falls with major injury Info Percentage of SNF residents who experience falls with major injury during their stay. 0.0%
100% better than Washington average

Washington average: 0.8%

Ability to care for self at discharge Info Percentage of residents at or above expected ability to care for themselves at discharge. 77.8%
45% better than Washington average

Washington average: 53.7%

Successful return to home or community Info Rate of successful return to home or community from a skilled nursing facility. 66.0%
31% better than Washington average

Washington average: 50.6%

Breakdown by payment type

Medicare

81% of new residents, usually for short-term rehab.

Typical stay 1 months

Private pay

19% of new residents, often for short stays.

Typical stay 28 days

Facility Characteristics

Source: CMS Long-Term Care Facility Characteristics (Data as of Jan 2026)

Total residents 71
Medicare
49
69% of residents
Medicaid
4
5.6% of residents
Private pay or other
18
25.4% of residents
Programs & Services
Residents Group

Residents meet regularly to discuss policies, care quality, and activities

Active Resident Council

Organized group of residents that meets regularly to discuss facility policies, quality of life, and activities.

Finances and operations

Based on CMS SNF Cost Report for fiscal year ending in 12/2023.

For-profit
Operated by a single business entity.
Net patient revenue Info Net patient revenue — what the home actually collects for resident care, after contractual allowances, bad debt and discounts are subtracted from its gross charges (CMS cost report, Worksheet G-3). It covers resident care only; money the home earns from other sources is shown separately as "Other income."
$13.5M
Net patient income Info Net patient income: net patient revenue minus the home's total operating expenses. A positive figure means it earns more from resident care than it spends to deliver it; a negative figure means the opposite. It excludes non-operating "other income."
$1.6M
For-profit Operated by a single business entity.
Net patient revenue Info Net patient revenue — what the home actually collects for resident care, after contractual allowances, bad debt and discounts are subtracted from its gross charges (CMS cost report, Worksheet G-3). It covers resident care only; money the home earns from other sources is shown separately as "Other income."
$13.5M Rank #16 / 94Revenue — State benchmarkedThis home is ranked 16th out of 94 homes in Washington. Shows this facility's annual revenue compared to the Washington average. Higher revenue generally means more resources for staffing and capital — read alongside Payroll %.Rankings are based only on facilities in Washington that report data for that category. Facilities without available data are excluded from the ranking.Click the rank badge to see the full State ranking.Click here to see the full State ranking.
Net patient income Info Net patient income: net patient revenue minus the home's total operating expenses. A positive figure means it earns more from resident care than it spends to deliver it; a negative figure means the opposite. It excludes non-operating "other income."
$1.6M
Other income Info Money the home earns outside of resident care — such as investments, grants, rentals and other non-operating sources (CMS cost report, Worksheet G-3). It is tracked separately from net patient revenue: it is not part of that figure, and it is not included in net patient income.
$34.0K
Payroll costs Info Staff salaries plus wage-related costs — benefits such as payroll taxes, health insurance and retirement — from the home's own accounting records (CMS cost report, Worksheet A). Contract or agency labor is counted separately, under other operating costs. Rank #57 / 94Payroll — State benchmarkedThis home is ranked 57th out of 94 homes in Washington. Shows total annual staff payroll benchmarked to the Washington average. Higher payroll investment relative to peers often signals better staffing and less reliance on cheaper contract labor.Rankings are based only on facilities in Washington that report data for that category. Facilities without available data are excluded from the ranking.Click the rank badge to see the full State ranking.Click here to see the full State ranking.
$6.3M 46.5% of net patient revenue Info Payroll as a share of revenue: staff salaries and wage-related benefits divided by net patient revenue. A higher figure means more of each revenue dollar goes to staff pay. Rank #93 / 94Payroll % — State benchmarkedThis home is ranked 93rd out of 94 homes in Washington. Shows payroll as a percentage of revenue versus the Washington average. Well-run Washington facilities typically land around 53–61% — the top third Statewide. Below 25% may signal understaffing or heavy agency use — read with Staffing ratings.Rankings are based only on facilities in Washington that report data for that category. Facilities without available data are excluded from the ranking.Click the rank badge to see the full State ranking.Click here to see the full State ranking.
Other operating costs Info Everything it costs to run the home apart from payroll — food, utilities, supplies, maintenance, contract labor and administration. Calculated as total operating expense minus payroll (staff salaries and wage-related benefits).
$5.7M
Total costs Info The home's total operating expense for the year — all the costs of running it, salaries included (CMS cost report, Worksheet G-3).
$11.9M

Who this home usually serves

TYPE OF STAY

Mostly short-term rehab stays

Most residents typically stay for a few weeks or months before returning home or moving on.

Most new residents arrive under Medicare (81% of admissions), and a typical Medicare stay runs around 1 months.

Admissions
686 total

Coverage residents most often arrive under.

Medicare 81%
Private pay 19%
Discharges
677 total

Coverage residents most often leave under.

Medicare 73%
Private pay 23%
Medicaid 4%

Places of interest near Olympia Manor Rehabilitation Center

Address 1.9 miles from city center Info Estimated distance in miles from Olympia's city center to Olympia Manor Rehabilitation Center's address, calculated via Google Maps.

Calculate Travel Distance to Olympia Manor Rehabilitation Center

Add your location

Address

Compare Nursing Homes around Olympia

The information below is reported by the Washington Department of Social and Health Services, Residential Care Services.

5 facilities compared · CMS & WA Dept. of Health data

Penrose Harbor at Heron‘s Key
NH
AL
IL
MC
SNF
Gig Harbor
49
Facility 49
WA AVG 82
Rank #302 / 366
69.7%
Facility 69.7%
WA AVG 72.5%
Rank #198 / 310
-4%
5.88
Facility 5.88
WA AVG 4.22
Rank #1 / 90
+46%+39%
$15.0k
Facility $15.0k
WA AVG $87.7k
Rank #41 / 92
33
Facility 33
WA AVG 48.9
Rank #25 / 92
8.3
Facility 8.3
WA AVG 6.9
Rank #65 / 92
122-
36
Facility 36
WA AVG 51
Rank #433 / 628
Herons Key
$23.3MFiscal year ending 12/2023
Facility $23.3MFiscal year ending 12/2023
WA AVG $13.2M
Rank #15 / 94
$7.8MFiscal year ending 12/2023
Facility $7.8MFiscal year ending 12/2023
WA AVG $5.7M
Rank #36 / 94
33.3%Fiscal year ending 12/2023
Facility 33.3%Fiscal year ending 12/2023
WA AVG 45.5%
Rank #89 / 94
505531
Olympia Manor Rehabilitation Center
NH
RC
SNF
Olympia (Cain Road)
71
Facility 71
WA AVG 82
Rank #205 / 366
89.3%
Facility 89.3%
WA AVG 72.5%
Rank #50 / 310
+23%
3.20
Facility 3.20
WA AVG 4.22
Rank #85 / 90
+54%-24%
$59.8k
Facility $59.8k
WA AVG $87.7k
Rank #61 / 92
39
Facility 39
WA AVG 48.9
Rank #33 / 92
4.3
Facility 4.3
WA AVG 6.9
Rank #13 / 92
169-
14
Facility 14
WA AVG 51
Rank #565 / 628
-
$13.5MFiscal year ending 12/2023
Facility $13.5MFiscal year ending 12/2023
WA AVG $13.2M
Rank #16 / 94
$6.3MFiscal year ending 12/2023
Facility $6.3MFiscal year ending 12/2023
WA AVG $5.7M
Rank #57 / 94
46.5%Fiscal year ending 12/2023
Facility 46.5%Fiscal year ending 12/2023
WA AVG 45.5%
Rank #93 / 94
505514
Olympia Transitional Care and Rehabilitation
NH
MC
SNF
Olympia
113
Facility 113
WA AVG 82
Rank #63 / 366
61.7%
Facility 61.7%
WA AVG 72.5%
Rank #243 / 310
-15%
4.47
Facility 4.47
WA AVG 4.22
Rank #17 / 90
-53%+6%
$0
Facility $0
WA AVG $87.7k
Rank #1 / 92
29
Facility 29
WA AVG 48.9
Rank #15 / 92
4.1
Facility 4.1
WA AVG 6.9
Rank #11 / 92
181-
38
Facility 38
WA AVG 51
Rank #420 / 628
Joel Smith
$15.1MFiscal year ending 12/2023
Facility $15.1MFiscal year ending 12/2023
WA AVG $13.2M
Rank #35 / 94
$8.6MFiscal year ending 12/2023
Facility $8.6MFiscal year ending 12/2023
WA AVG $5.7M
Rank #25 / 94
57%Fiscal year ending 12/2023
Facility 57%Fiscal year ending 12/2023
WA AVG 45.5%
Rank #29 / 94
505243
Puget Health Care Center
NH
SNF
Olympia (Capital Mall Drive Southwest)
108
Facility 108
WA AVG 82
Rank #79 / 366
89.0%
Facility 89.0%
WA AVG 72.5%
Rank #51 / 310
+23%
4.06
Facility 4.06
WA AVG 4.22
Rank #47 / 90
-45%-4%
$8.0k
Facility $8.0k
WA AVG $87.7k
Rank #34 / 92
18
Facility 18
WA AVG 48.9
Rank #7 / 92
3.0
Facility 3.0
WA AVG 6.9
Rank #3 / 92
193-
31
Facility 31
WA AVG 51
Rank #469 / 628
-
$14.8MFiscal year ending 12/2023
Facility $14.8MFiscal year ending 12/2023
WA AVG $13.2M
Rank #34 / 94
$7.3MFiscal year ending 12/2023
Facility $7.3MFiscal year ending 12/2023
WA AVG $5.7M
Rank #40 / 94
49.2%Fiscal year ending 12/2023
Facility 49.2%Fiscal year ending 12/2023
WA AVG 45.5%
Rank #61 / 94
505299
Willapa Harbor Care
NH
SNF
Raymond
60
Facility 60
WA AVG 82
Rank #246 / 366
60.5%
Facility 60.5%
WA AVG 72.5%
Rank #246 / 310
-17%
3.91
Facility 3.91
WA AVG 4.22
Rank #58 / 90
-19%-7%
$0
Facility $0
WA AVG $87.7k
Rank #1 / 92
30
Facility 30
WA AVG 48.9
Rank #19 / 92
7.5
Facility 7.5
WA AVG 6.9
Rank #58 / 92
-46-
13
Facility 13
WA AVG 51
Rank #570 / 628
Tashina Mcneley
$1.3MFiscal year ending 03/2023
Facility $1.3MFiscal year ending 03/2023
WA AVG $13.2M
Rank #94 / 94
$540.6kFiscal year ending 03/2023
Facility $540.6kFiscal year ending 03/2023
WA AVG $5.7M
Rank #94 / 94
41.3%Fiscal year ending 03/2023
Facility 41.3%Fiscal year ending 03/2023
WA AVG 45.5%
Rank #79 / 94
505349

Financial Assistance for
Nursing Home in Washington

Olympia Manor Rehabilitation Center is located in Olympia, Washington.
Here are the financial assistance programs available to residents in Washington.

Get Financial aid guidance

Community Options Program Entry System (COPES)

WA Medicaid COPES

Age 65+ or disabled
General Washington resident, Medicaid-eligible, nursing home-level care need.
Income Limits (2025) ~$2,829/month 300% FBR, individual
Asset Limits $2,000 (individual), $3,000 (couple).
WA

High demand in urban areas (e.g., Seattle).

Benefits
Personal care (5-7 hours/day) Respite (240 hours/year) Adult day care ($70/day) Home modifications ($1,500 avg.)

Washington Family Caregiver Support Program

WA NFCSP

Age Caregiver of someone 60+ (or with dementia)
General Washington resident.
Income Limits No strict limit; prioritizes low-income.
Asset Limits Not applicable.
WA

High urban demand; rural outreach.

Benefits
In-home respite (4-6 hours/day) Adult day care (~$70/day) Short-term facility care (up to 5 days)

Community First Choice (CFC)

Washington Community First Choice

Age 65+ (or disabled 18+)
General WA resident, Medicaid-eligible, need help with 2+ ADLs/IADLs.
Income Limits (2025) ~$2,829/month; QIT optional.
Asset Limits $2,000 (individual), $3,000 (couple).
WA

Broader than COPES; serves ~20,000; self-directed option.

Benefits
Personal care (4-6 hours/day) Respite (~240 hours/year) Assistive devices Training Transportation

Older Americans Act (OAA) Services

Washington OAA Services

Age 60+
General WA resident; no income/asset limits.
Income Limits (2025) None; donations encouraged.
Asset Limits Not assessed.
WA

13 AAAs; includes Meals on Wheels; rural focus.

Benefits
Meals (~$5-$7/meal) Transportation Homemaker services (~4 hours/week) Respite (~5 days/year) Legal aid

Medicare Savings Program (MSP)

Washington Medicare Savings Program

Age 65+ or disabled
General WA resident, Medicare Part A/B.
Income Limits (2025) ~$2,510/month (QMB), ~$3,380/month (SLMB), ~$3,598/month (QI)—individual.
Asset Limits $9,430 (individual), $14,130 (couple).
WA

Includes Extra Help for Part D; no waitlist.

Benefits
Covers Part B premiums ($174.70/month) Deductibles ($240/year) Copays (~20%)

VA Aid and Attendance (A&A) and Housebound Benefits

Washington VA Aid and Attendance/Housebound

Age 65+ or disabled veteran/spouse
General WA resident, wartime service, ADL help (A&A) or homebound.
Income Limits (2025) Net income < ~$1,984/month (veteran with dependent, A&A); pension offsets income.
Asset Limits ~$155,356 net worth
WA

High veteran use; supports rural/urban needs.

Benefits
Cash (~$1,433-$2,642/month veteran, ~$951-$1,318 spouse) for care costs

Senior Citizens Property Tax Exemption

Washington Senior Property Tax Exemption

Age 61+ or disabled retiree
General WA resident, homeowner, income-based.
Income Limits (2025) ~$45,000-$70,000/year varies by county, e.g., King: $70,000
Asset Limits Not assessed; home value cap varies ~$250,000-$400,000
WA

Saves ~$500-$1,500/year; offered statewide.

Benefits
Tax exemption (~$500-$1,500/year depending on county)

Senior Farmers’ Market Nutrition Program (SFMNP)

Washington SFMNP

Age 60+
General WA resident, low-income.
Income Limits (2025) ~$2,322/month 185% FPL
Asset Limits Not assessed.
WA

Vouchers (~$80/season); serves ~20,000 via AAAs.

Benefits
Vouchers (~$80/season) for produce at farmers’ markets

Frequently Asked Questions about Olympia Manor Rehabilitation Center

What neighborhood is Olympia Manor Rehabilitation Center in?

Olympia Manor Rehabilitation Center is in the Cain Road neighborhood.

Is Olympia Manor Rehabilitation Center in a walkable area?

Olympia Manor Rehabilitation Center has a walk score of 14. Car-dependent. Most errands require a car, with limited nearby walkable options.

What is the occupancy rate at Olympia Manor Rehabilitation Center?

Olympia Manor Rehabilitation Center's occupancy is 89.3%.

Does Olympia Manor Rehabilitation Center operate as a for-profit or non-profit?

Olympia Manor Rehabilitation Center is registered as a for-profit.

Are there photos of Olympia Manor Rehabilitation Center?

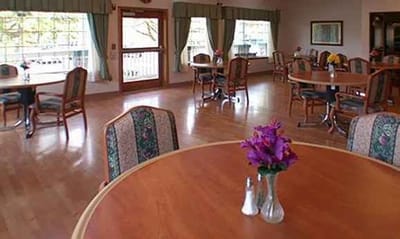
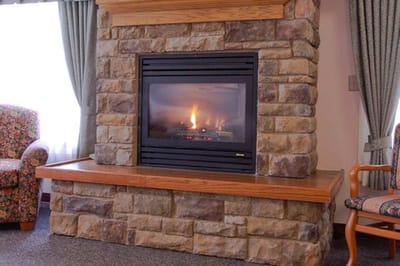
Yes — there are 3 photos of Olympia Manor Rehabilitation Center in the photo gallery on this page.

What is the address of Olympia Manor Rehabilitation Center?

Olympia Manor Rehabilitation Center is located at 1811 22Nd Ave Se, Olympia, WA 98501.

What is the phone number of Olympia Manor Rehabilitation Center?

(360) 943-0910 will put you in contact with the team at Olympia Manor Rehabilitation Center.

Guides for Better Senior Living

Care Cost Calculator: See Prices in Your Area

Nursing Home Data Explorer

Don’t Wait Too Long: 7 Red Flag Signs Your Parent Needs Assisted Living Now

The True Cost of Assisted Living in 2025 – And How Families Are Paying For It

Understanding Senior Living Costs: Pricing Models, Discounts & Financial Assistance