


Pleasant Garden Clover


Pleasant Garden Clover
Pleasant Garden Clover accepts Medicaid.
Overview of Pleasant Garden Clover
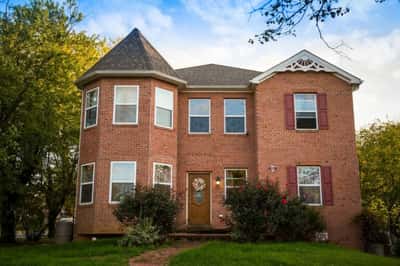
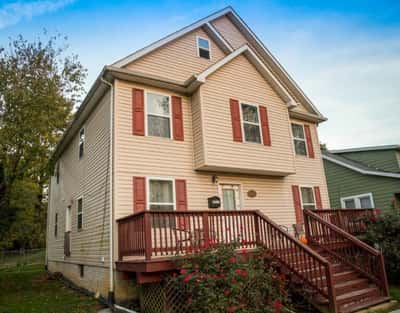
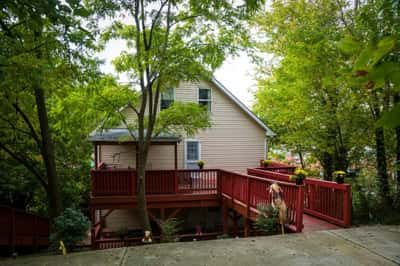
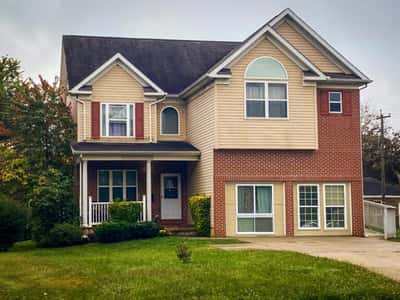
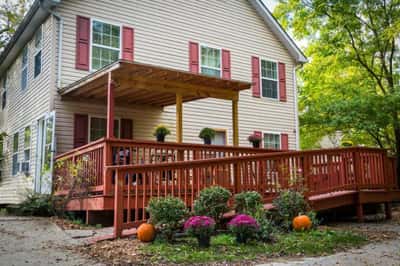
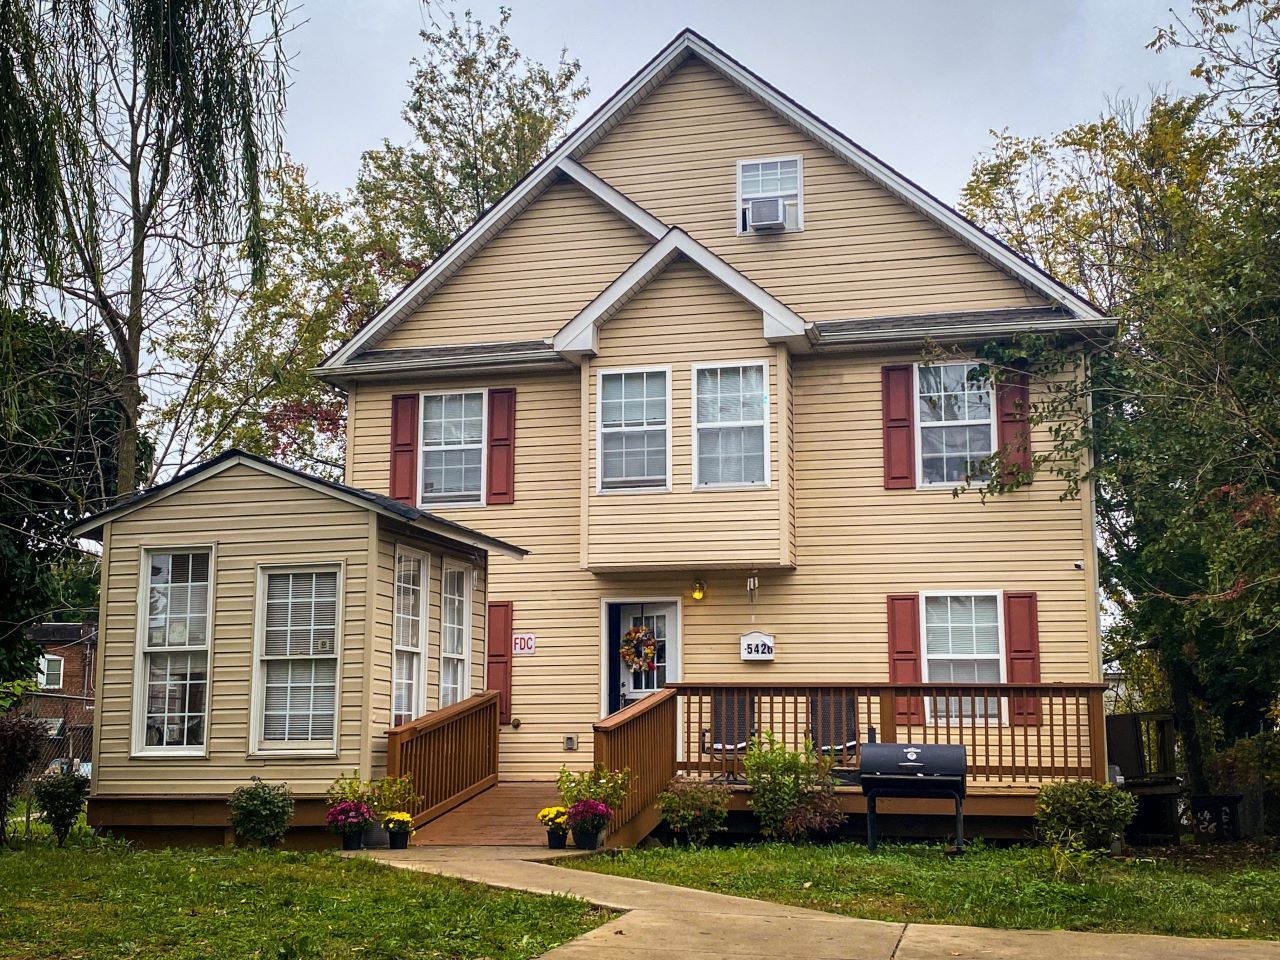
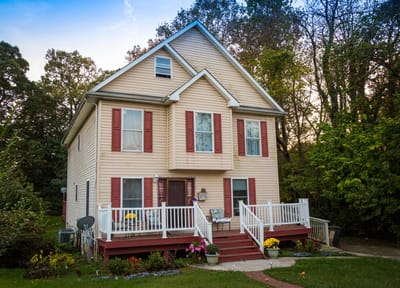
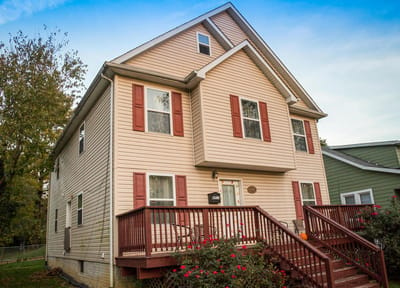
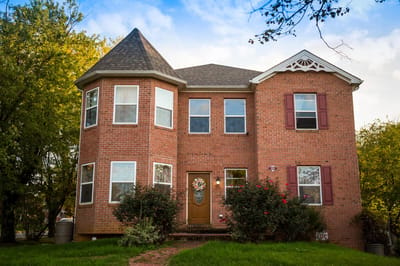
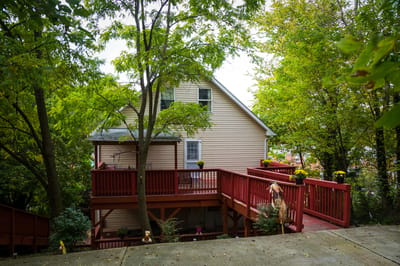
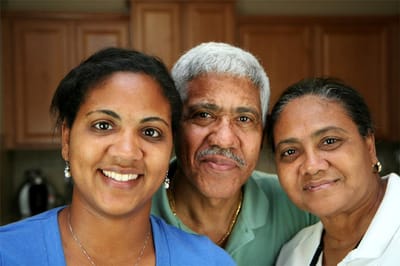
Nestled in the peaceful neighborhood of Baltimore, MD, Pleasant Garden Clover is a reliable senior living community, offering premiere assisted living services that help residents age in place successfully. The community strives to create a pleasant living experience for all residents, offering them secure, attended, comfortable and stunning accommodations with convenient access to various services. Here, residents are given compassionate care and assistance that maintains their dignity and freedom, thanks to a team of excellent certified, professional caregivers.
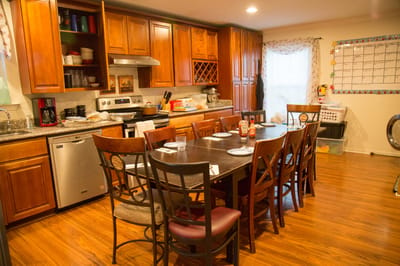
Conveniently near several shopping areas, restaurants, and multiple local senior centers, the community ensures residents have easy access to the amenities and experiences they need to live fully. Residents also enjoy delicious meals prepared in the home’s kitchen and served family style around the dining room table, fostering bonding over meals and healthy eating habits. In Pleasant Garden Clover, residents and even the employees are given a nurturing environment that allows them to thrive and grow.
15-bed community Rank #277 / 697Bed count — State benchmarkedThis home is ranked 277th out of 697 homes in Maryland for bed count. Shows this facility's certified or reported bed count compared to other Maryland SNFs. Larger communities may offer more amenities, programs, and on-site services for residents and families.Click the rank badge to see the full State ranking.Click here to see the full State ranking.
A smaller, more intimate setting that may offer a quieter environment and closer staff-resident interactions.
15 years in operation Rank #132 / 208Years in operation — State benchmarkedThis home is ranked 132nd out of 208 homes in Maryland for years in operation. Shows how long this facility has been in operation compared to other Maryland SNFs. Longer operating histories may benefit residents, families, and staff.Click the rank badge to see the full State ranking.Click here to see the full State ranking.
A community with a solid operating history and experience delivering ongoing care.
Walk Score: 88 / 100 Rank #39 / 985Walk Score — State benchmarkedThis home is ranked 39th out of 985 homes in Maryland for walk score. Shows how walkable this facility's neighborhood is compared to the average Walk Score across Maryland SNFs. Higher scores benefit residents, families, and staff.Click the rank badge to see the full State ranking.Click here to see the full State ranking.
Very walkable. Most errands can be accomplished on foot, and many essentials are within a short walk.
BBB Rating: A+ (Not Accredited)
An independent rating from the Better Business Bureau based on factors such as complaint history, transparency, and business practices.
How BBB ratings work
How BBB ratings work
About this community
CountyBaltimore City
Private Room
$83 - $115 per day
Semi-Private Room
$30 - $83 per day
Hospice Affiliations
Staffing
Key information about the people who lead and staff this community.
No CNA training program
Mild Alzheimer's Level
Moderate Alzheimer's Level
No severe Alzheimer's level
Specific ProgramsGalleries, Documents
Demographics
Resident demographic information for this facility.
Gender
- Female 27.3%
- Male 72.7%
Age Distribution
- 65-74 54.6%
- 75-84 27.3%
- ≤64 18.2%
Ethnicity
- African American 90.9%
- White 9.1%
Infection Prevention & Vaccination
How this facility protects residents through staff vaccination policies and immunization practices.
Influenza Gold Star
Awarded by the Maryland Health Care Commission (MHCC) to healthcare facilities that achieve a high influenza vaccination rate.
Mandatory Vaccination Policy
The facility requires certain vaccinations for staff as part of its infection prevention measures.
Mandatory COVID Policy
The facility requires COVID-19 vaccination for staff.
What does this home offer?
Building Type: 3-story
Places of interest near Pleasant Garden Clover
![]() 7.5 miles from city center
7.5 miles from city center
![]() Estimated distance in miles from Baltimore's city center to Pleasant Garden Clover's address, calculated via Google Maps.
Estimated distance in miles from Baltimore's city center to Pleasant Garden Clover's address, calculated via Google Maps.
Calculate Travel Distance to Pleasant Garden Clover
Add your location
Financial Assistance for
Assisted Living in Maryland
Pleasant Garden Clover is located in Baltimore, Maryland.
Here are the financial assistance programs available to residents in Maryland.
Compare Assisted Living around Baltimore
The information below is reported by the Maryland Department of Health, Office of Health Care Quality.
Filter by care type
|
|
|
|
|
|
|
|
|
|
|
|
|
|
|
|
|
|
|
|---|---|---|---|---|---|---|---|---|---|---|---|---|---|---|---|---|---|
| Sunrise of Annapolis |
AL
Assisted Living A licensed, long-term care setting for seniors or individuals with disabilities who need help with daily activities — like bathing, dressing, and medication management — but not 24-hour skilled nursing. Offers housing, meals, and around-the-clock support while aiming to maximize resident independence.
MC
Memory Care Secured, specialized care for people living with Alzheimer's or dementia. Staff trained in cognitive impairment, with higher staff-to-resident ratios and an environment designed to reduce confusion and wandering risk. |
Annapolis |
106
Facility
106
MD AVG
44
Rank
#110 / 697
| Yes |
38
Facility
38
MD AVG
43
Rank
#542 / 985
| Studio / 1 Bed / 2 Bed |
30
Facility
30
MD AVG
21
Rank
#44 / 208
| - |
31%
Male Residents — State Benchmarked 31% of residents are male, compared to the Maryland average of 31%. This facility caters to a majority female resident pool (69% female), consistent with the broader assisted living trend where women significantly outnumber men. |
69%
Female Residents — State Benchmarked 69% of residents are female, compared to the Maryland average of 69%. Women comprise the large majority, consistent with national assisted living demographics where women live longer and enter care facilities at higher rates. |
90%
White Residents — State Benchmarked 90% of residents are reported as White, compared to the Maryland average of 81%. A higher White share than is typical for assisted living in Maryland in this dataset — compare with peer facilities for local context. |
6%
African American Residents — State Benchmarked 6% of residents are reported as African American or Black, compared to the Maryland average of 13%. In line with the Maryland average for African American residents among facilities reporting this breakdown. |
4%
Other Ethnicity Residents — State Benchmarked 4% of residents fall into categories other than White or African American (combined), compared to the Maryland average of 6%. This column aggregates Hispanic, Asian, multiracial, and any other labeled groups that are not classified as White or African American. Reported subgroups in this total: American Indian (1%), Hawaiian/Pacific Islander (1%), Hispanic (1%). |
12%
Residents Age 65–74 — State Benchmarked 12% of residents are 65–74, compared to the Maryland average of 13%. In line with the statewide profile for this youngest senior bracket in assisted living. |
22%
Residents Age 75–84 — State Benchmarked 22% of residents are 75–84, compared to the Maryland average of 31%. Below the state norm — the resident mix may skew either younger or older than this typical middle bracket. |
65%
Residents Age 85–94 — State Benchmarked 65% of residents are 85–94, compared to the Maryland average of 44%. A high concentration of very elderly residents signals a higher-acuity facility with experience caring for advanced age-related needs. |
- |
| Sunrise of Severna Park |
AL
Assisted Living A licensed, long-term care setting for seniors or individuals with disabilities who need help with daily activities — like bathing, dressing, and medication management — but not 24-hour skilled nursing. Offers housing, meals, and around-the-clock support while aiming to maximize resident independence. |
Severna Park (Mckinsey Road) |
100
Facility
100
MD AVG
44
Rank
#120 / 697
| Yes |
70
Facility
70
MD AVG
43
Rank
#184 / 985
| - |
29
Facility
29
MD AVG
21
Rank
#48 / 208
| - |
29%
Male Residents — State Benchmarked 29% of residents are male, compared to the Maryland average of 31%. This facility caters to a majority female resident pool (71% female), consistent with the broader assisted living trend where women significantly outnumber men. |
71%
Female Residents — State Benchmarked 71% of residents are female, compared to the Maryland average of 69%. Women comprise the large majority, consistent with national assisted living demographics where women live longer and enter care facilities at higher rates. |
99%
White Residents — State Benchmarked 99% of residents are reported as White, compared to the Maryland average of 81%. A higher White share than is typical for assisted living in Maryland in this dataset — compare with peer facilities for local context. |
1%
African American Residents — State Benchmarked 1% of residents are reported as African American or Black, compared to the Maryland average of 13%. A lower African American share than is typical in Maryland; local markets still vary widely. |
0%
Other Ethnicity Residents — State Benchmarked 0% of residents fall into categories other than White or African American (combined), compared to the Maryland average of 6%. This column aggregates Hispanic, Asian, multiracial, and any other labeled groups that are not classified as White or African American. |
6%
Residents Age 65–74 — State Benchmarked 6% of residents are 65–74, compared to the Maryland average of 13%. Fewer younger seniors suggests the resident population skews older, likely requiring higher acuity care and more hands-on support. |
29%
Residents Age 75–84 — State Benchmarked 29% of residents are 75–84, compared to the Maryland average of 31%. This is the second most common age bracket in assisted living, representing residents with moderate care needs. |
56%
Residents Age 85–94 — State Benchmarked 56% of residents are 85–94, compared to the Maryland average of 44%. A high concentration of very elderly residents signals a higher-acuity facility with experience caring for advanced age-related needs. |
8%
Residents Age 95+ — State Benchmarked 8% of residents are 95 or older, compared to the Maryland average of 16%. Most residents here have not yet reached the oldest-old bracket, suggesting a younger overall community. |
| Brightview White Marsh |
AL
Assisted Living A licensed, long-term care setting for seniors or individuals with disabilities who need help with daily activities — like bathing, dressing, and medication management — but not 24-hour skilled nursing. Offers housing, meals, and around-the-clock support while aiming to maximize resident independence.
MC
Memory Care Secured, specialized care for people living with Alzheimer's or dementia. Staff trained in cognitive impairment, with higher staff-to-resident ratios and an environment designed to reduce confusion and wandering risk. |
Nottingham |
99
Facility
99
MD AVG
44
Rank
#133 / 697
| No |
49
Facility
49
MD AVG
43
Rank
#431 / 985
| - |
25
Facility
25
MD AVG
21
Rank
#83 / 208
| - |
17%
Male Residents — State Benchmarked 17% of residents are male, compared to the Maryland average of 31%. This facility caters to a majority female resident pool (83% female), consistent with the broader assisted living trend where women significantly outnumber men. |
83%
Female Residents — State Benchmarked 83% of residents are female, compared to the Maryland average of 69%. Women comprise the large majority, consistent with national assisted living demographics where women live longer and enter care facilities at higher rates. |
98%
White Residents — State Benchmarked 98% of residents are reported as White, compared to the Maryland average of 81%. A higher White share than is typical for assisted living in Maryland in this dataset — compare with peer facilities for local context. |
2%
African American Residents — State Benchmarked 2% of residents are reported as African American or Black, compared to the Maryland average of 13%. A lower African American share than is typical in Maryland; local markets still vary widely. |
0%
Other Ethnicity Residents — State Benchmarked 0% of residents fall into categories other than White or African American (combined), compared to the Maryland average of 6%. This column aggregates Hispanic, Asian, multiracial, and any other labeled groups that are not classified as White or African American. |
3%
Residents Age 65–74 — State Benchmarked 3% of residents are 65–74, compared to the Maryland average of 13%. Fewer younger seniors suggests the resident population skews older, likely requiring higher acuity care and more hands-on support. |
17%
Residents Age 75–84 — State Benchmarked 17% of residents are 75–84, compared to the Maryland average of 31%. Below the state norm — the resident mix may skew either younger or older than this typical middle bracket. |
51%
Residents Age 85–94 — State Benchmarked 51% of residents are 85–94, compared to the Maryland average of 44%. A high concentration of very elderly residents signals a higher-acuity facility with experience caring for advanced age-related needs. |
29%
Residents Age 95+ — State Benchmarked 29% of residents are 95 or older, compared to the Maryland average of 16%. A high proportion of the oldest-old suggests strong end-of-life care experience and very-high-acuity capabilities. |
| Symphony Manor |
AL
Assisted Living A licensed, long-term care setting for seniors or individuals with disabilities who need help with daily activities — like bathing, dressing, and medication management — but not 24-hour skilled nursing. Offers housing, meals, and around-the-clock support while aiming to maximize resident independence.
IL
Independent Living Lifestyle-focused communities for older adults offering dining, activities, and transportation with minimal personal care. Best for active, independent seniors who want community without medical support. |
Baltimore (Roland Park) |
69
Facility
69
MD AVG
44
Rank
#198 / 697
| Yes |
71
Facility
71
MD AVG
43
Rank
#175 / 985
| Studio / 1 Bed / 2 Bed |
15
Facility
15
MD AVG
21
Rank
#132 / 208
| - |
21%
Male Residents — State Benchmarked 21% of residents are male, compared to the Maryland average of 31%. This facility caters to a majority female resident pool (79% female), consistent with the broader assisted living trend where women significantly outnumber men. |
79%
Female Residents — State Benchmarked 79% of residents are female, compared to the Maryland average of 69%. Women comprise the large majority, consistent with national assisted living demographics where women live longer and enter care facilities at higher rates. |
79%
White Residents — State Benchmarked 79% of residents are reported as White, compared to the Maryland average of 81%. Close to the average for this category among assisted living facilities in Maryland with reported race/ethnicity data. |
19%
African American Residents — State Benchmarked 19% of residents are reported as African American or Black, compared to the Maryland average of 13%. In line with the Maryland average for African American residents among facilities reporting this breakdown. |
1%
Other Ethnicity Residents — State Benchmarked 1% of residents fall into categories other than White or African American (combined), compared to the Maryland average of 6%. This column aggregates Hispanic, Asian, multiracial, and any other labeled groups that are not classified as White or African American. Reported subgroups in this total: Asian (1%). |
15%
Residents Age 65–74 — State Benchmarked 15% of residents are 65–74, compared to the Maryland average of 13%. In line with the statewide profile for this youngest senior bracket in assisted living. |
44%
Residents Age 75–84 — State Benchmarked 44% of residents are 75–84, compared to the Maryland average of 31%. A high concentration in this mid-range bracket, where residents typically need moderate support with daily activities. |
18%
Residents Age 85–94 — State Benchmarked 18% of residents are 85–94, compared to the Maryland average of 44%. The population here skews younger than the statewide norm, which may indicate a more active, lower-acuity community. |
24%
Residents Age 95+ — State Benchmarked 24% of residents are 95 or older, compared to the Maryland average of 16%. A high proportion of the oldest-old suggests strong end-of-life care experience and very-high-acuity capabilities. |
| Pleasant Garden Clover |
AL
Assisted Living A licensed, long-term care setting for seniors or individuals with disabilities who need help with daily activities — like bathing, dressing, and medication management — but not 24-hour skilled nursing. Offers housing, meals, and around-the-clock support while aiming to maximize resident independence. |
Baltimore (Pimlico) |
15
Facility
15
MD AVG
44
Rank
#277 / 697
| No |
88
Facility
88
MD AVG
43
Rank
#39 / 985
| - |
15
Facility
15
MD AVG
21
Rank
#132 / 208
| A+ |
73%
Male Residents — State Benchmarked 73% of residents are male, compared to the Maryland average of 31%. An unusually high male share for assisted living, where most facilities skew heavily female. |
27%
Female Residents — State Benchmarked 27% of residents are female, compared to the Maryland average of 69%. An unusually low female share — most assisted living facilities have 65–75% female residents. |
9%
White Residents — State Benchmarked 9% of residents are reported as White, compared to the Maryland average of 81%. A lower White share than the Maryland average — the community may draw a more diverse resident mix relative to other facilities in Maryland. |
91%
African American Residents — State Benchmarked 91% of residents are reported as African American or Black, compared to the Maryland average of 13%. A higher African American share than the typical Maryland average — useful context when comparing cultural fit and community composition. |
0%
Other Ethnicity Residents — State Benchmarked 0% of residents fall into categories other than White or African American (combined), compared to the Maryland average of 6%. This column aggregates Hispanic, Asian, multiracial, and any other labeled groups that are not classified as White or African American. |
55%
Residents Age 65–74 — State Benchmarked 55% of residents are 65–74, compared to the Maryland average of 13%. A higher share of younger seniors often signals a more independent, active resident community with lower acuity care needs. |
27%
Residents Age 75–84 — State Benchmarked 27% of residents are 75–84, compared to the Maryland average of 31%. This is the second most common age bracket in assisted living, representing residents with moderate care needs. |
- | - |
Frequently Asked Questions about Pleasant Garden Clover
What neighborhood is Pleasant Garden Clover in?
Pleasant Garden Clover is in the Pimlico neighborhood of MD 21215.
Is Pleasant Garden Clover in a walkable area?
Pleasant Garden Clover has a walk score of 88. Very walkable. Most errands can be accomplished on foot, and many essentials are within a short walk.
How many beds does Pleasant Garden Clover have?
Pleasant Garden Clover has 15 beds.
Are there photos of Pleasant Garden Clover?
Yes — there are 13 photos of Pleasant Garden Clover in the photo gallery on this page.
What is the address of Pleasant Garden Clover?
Pleasant Garden Clover is located at 5426 Clover Rd, Baltimore, MD 21215, USA.
What is the phone number of Pleasant Garden Clover?
(410) 300-4443 will put you in contact with the team at Pleasant Garden Clover.
What county is Pleasant Garden Clover located in?
Pleasant Garden Clover is in Baltimore City County.
Guides for Better Senior Living
Care Cost Calculator: See Prices in Your Area
Nursing Home Data Explorer
Don’t Wait Too Long: 7 Red Flag Signs Your Parent Needs Assisted Living Now
The True Cost of Assisted Living in 2025 – And How Families Are Paying For It
Understanding Senior Living Costs: Pricing Models, Discounts & Financial Assistance
Contact Us

Published on
Updated on
Feedback
Write a review for Pleasant Garden Clover
Rate your overall experience with this community
Explore Open Rooms
1
Contact details
2
What type of senior care service are you looking for?
3
What budget do you have in mind for senior care?
4
How soon do you need to find care?
5
Additional details
Thank you for your interest!
Our team will be in touch shortly to help with next steps.
Need Help?
Let us help you or a loved one find the perfect senior home.
