Potomac Falls Health and Rehab Center
Nursing Home, Respite Care & Memory Care · Great Falls, VA
CMS overall rating Info The Overall CMS Rating is scored from 1 to 5 stars and combines results from health inspections, staffing levels, and quality measures. Health inspections carry the most weight. Staffing and quality scores can increase or decrease the final rating based on performance compared to state and national standards.

Potomac Falls Health and Rehab Center

Nursing Home, Respite Care & Memory Care · Great Falls, VA
CMS overall rating Info The Overall CMS Rating is scored from 1 to 5 stars and combines results from health inspections, staffing levels, and quality measures. Health inspections carry the most weight. Staffing and quality scores can increase or decrease the final rating based on performance compared to state and national standards.
Calculator: See prices in your area
Potomac Falls Health and Rehab Center accepts Medicare, Medicaid, and private pay.

Overview of Potomac Falls Health and Rehab Center

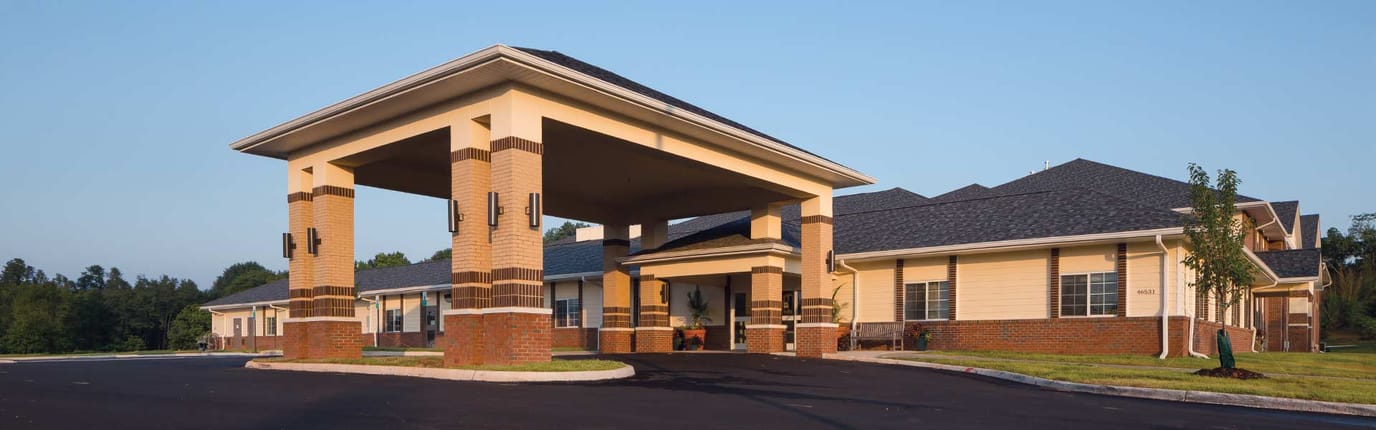
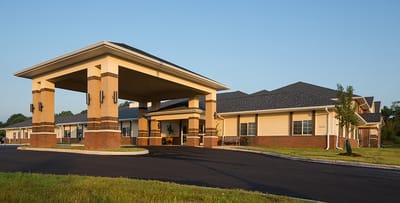
Potomac Falls Health and Rehab Center is a highly recognized nursing home in Sterling, VA, offering long-term care, rehabilitation, and respite care. With private and semi-private rooms in a home-like setting, the community ensures older adults can keep their peace of mind in retirement. Housekeeping, a fine dining program, and creative therapy programs are among the excellent services provided to improve residents’ quality of life. Through an innovative care approach, the community strives to provide care for their unique needs and preferences.

Book clubs, arts and crafts, and live performances provide residents with more opportunities to continue learning and have fun. A beauty salon and cozy communal spaces are also available, so residents can relax and interact with friends. Located along Leesburg Pike, near public transportation, restaurants, and shops, the community ensures easy access to their needs and leisure. This nursing home has high-quality services, making it a great choice for senior living in Virginia.

(703) 834-5800

Quality ratings

Measured by Centers for Medicare & Medicaid Services (CMS)

Overall rating Info The Overall CMS Rating combines results from health inspections, staffing levels and quality measures. Health inspections carry the most weight. Staffing and quality scores can increase or decrease the final rating based on performance compared to state and national standards.
At VA avg. At VA avg.Click the badge to see the full State ranking.Click here to see the full State ranking.
Health Inspection Info Based on the results of the facility's three most recent standard inspections and any complaint investigations. CMS reviews the number, scope, and severity of deficiencies, with more recent findings weighted more heavily.
▲ 8.1% Above VA avg. ▲ 8.1% Above VA avg.Click the badge to see the full State ranking.Click here to see the full State ranking.
Staffing Info Measures average nursing staff hours per resident per day, including Registered Nurses (RNs) and total nursing staff. Ratings are adjusted based on the level of care residents require and are compared to state and national benchmarks.
▲ 21.5% Above VA avg. ▲ 21.5% Above VA avg.Click the badge to see the full State ranking.Click here to see the full State ranking.
Quality Measures Info Based on clinical and physical health indicators reported to CMS, such as hospital readmissions, falls, pressure ulcers, and improvements in mobility. These measures reflect how well residents' health needs are being managed.
▲ 3.9% Above VA avg. ▲ 3.9% Above VA avg.Click the badge to see the full State ranking.Click here to see the full State ranking.

Staffing hours breakdown

Info Daily nursing hours per resident by staff type, reported to CMS. Higher is generally better — compare this facility to state and national averages to see where staffing stands.

Hours per resident per day — compared to Virginia state averages

Total nursing care / resident Info This home is ranked 49th out of 85 homes in Virginia. Total adjusted nursing hours per resident per day, combining RN, LPN, and aide time. CMS adjusts this for case-mix so facilities can be fairly compared.
3h 35m per day
Rank #49 / 85Nurse hours — State benchmarkedThis home is ranked 49th out of 85 homes in Virginia. Shows adjusted nurse hours per resident per day benchmarked to the Virginia average, with a ranking across 85 Virginia SNFs. More hours mean more direct care. The national average is about 3.5 hrs; below 3.0 is a red flag.Click the rank badge to see the full State ranking.Click here to see the full State ranking.
This facility Virginia avg (3h 45m per day)
vs Virginia avg
-4%

3 of 6 metrics below state avg

Standout metric LPN / LVN is +10% above state avg
Staff typeHours / Day / Residentvs state avg
Registered Nurse (RN) Info RNs hold the highest nursing license and can assess residents, interpret test results, and direct care plans. More RN hours per day often signals stronger clinical oversight and faster response to health changes. 39m per day ▼ 5% State avg: 41m per day · National avg: 41m per day
LPN / LVN Info Licensed Practical Nurses (LPNs) or Licensed Vocational Nurses (LVNs) deliver routine hands-on care — medication administration, wound dressing, and monitoring vital signs. They work under RN supervision and make up a large share of daily bedside care. 1h 6m per day ▲ 10% State avg: 1h 0m per day · National avg: 52m per day
Nurse Aide Info Certified Nurse Aides (CNAs) provide the most direct day-to-day assistance: bathing, dressing, feeding, and mobility. Nurse aide hours are typically the largest staffing category and directly affect residents' quality of life. 1h 57m per day ▼ 9% State avg: 2h 8m per day · National avg: 2h 21m per day
Weekend Total Nursing Info Combined nursing hours (RN + LPN + Nurse Aide) per resident per day on weekends. Staffing often drops on weekends — this figure reveals whether the facility maintains adequate coverage outside of weekday hours. 3h 20m per day ■ Avg State avg: 3h 19m per day · National avg: 3h 26m per day
Physical Therapist Info Hours per resident per day provided by licensed Physical Therapists (PTs) or PT Assistants. PT services help residents recover mobility after injury or illness and are especially important for post-acute (short-stay) rehabilitation. 4m per day ▼ 20% State avg: 5m per day · National avg: 4m per day
Weekend RN Info Registered nurse hours specifically on weekends. Facilities sometimes reduce RN presence on Saturdays and Sundays — a low weekend RN figure compared to weekday hours can indicate reduced clinical oversight when most administrative staff are absent. 29m per day ▲ 4% State avg: 28m per day · National avg: 29m per day

Types of Care at Potomac Falls Health and Rehab Center

Respite Care Memory Care Nursing Home

Capacity and availability

This home usually has limited availability

Occupancy between 85% and 95% suggests balanced demand.

Higher occupancy than the Virginia average: 85.7%
Occupancy rate 93.6% Rank #24 / 311Occupancy rate — State benchmarkedThis home is ranked 24th out of 311 homes in Virginia. Shows this facility's occupancy rate versus the Virginia average, with its Statewide rank out of 311. Higher occupancy signals strong local demand and financial stability.Click the rank badge to see the full State ranking.Click here to see the full State ranking.
Avg. Length of Stay 64 days
Occupancy rate
93.6% Rank #24 / 311Occupancy rate — State benchmarkedThis home is ranked 24th out of 311 homes in Virginia. Shows this facility's occupancy rate versus the Virginia average, with its Statewide rank out of 311. Higher occupancy signals strong local demand and financial stability.Click the rank badge to see the full State ranking.Click here to see the full State ranking.
Avg. Length of Stay
64 days
Walk Score
Walk Score: 59 / 100 Rank #116 / 449Walk Score — State benchmarkedThis home is ranked 116th out of 449 homes in Virginia. Shows how walkable this facility's neighborhood is compared to the average Walk Score across Virginia SNFs. Higher scores benefit residents, families, and staff.Click the rank badge to see the full State ranking.Click here to see the full State ranking.
Moderately walkable. Some errands can be accomplished on foot, with a mix of nearby amenities.

Contact Potomac Falls Health and Rehab Center

Staffing Data

Reporting period: October 1 – December 31, 2025 (Q4 2025). Source: CMS Payroll-Based Journal report.

Total staff 147
Employees 124
Contractors 23
Staff to resident ratio 1.08:1
35% worse than Virginia average
Virginia average ratio: 1.67:1 Virginia average ratio: 1.67:1See full Virginia ranking
Avg staff/day 81
Average shift 7.8 hours
0% compared with Virginia average
Virginia average: 8 hours Virginia average shift: 8 hoursSee full Virginia ranking
Total staff hours (quarter) 58,128

Nursing staff breakdown

Q4 2025 · Oct 1 – Dec 31 More info This data comes from the CMS Payroll-Based Journal report covering October 1 – December 31, 2025.
Registered Nurse

Manages medical care and health needs.

RN Staff 12
Average shift length Info Average shift length. Calculated as total hours divided by days worked and average staff per day. 8.1 hours

No contractors work on this role.

Licensed Practical Nurse

Assists with medical care and medications.

LPN Staff 26
Average shift length Info Average shift length. Calculated as total hours divided by days worked and average staff per day. 8.2 hours

No contractors work on this role.

Certified Nursing Assistant

Helps with daily care and mobility.

CNA Staff 55
Average shift length Info Average shift length. Calculated as total hours divided by days worked and average staff per day. 8 hours

No contractors work on this role.

Contractor staffing

Q4 2025 · Oct 1 – Dec 31 More info This data comes from the CMS Payroll-Based Journal report covering October 1 – December 31, 2025.

Total hours from contractors

7.7%

4,479 contractor hours this quarter

Physical Therapy Assistant: 5 Speech Language Pathologist: 5 Physical Therapy Aide: 4 Respiratory Therapy Technician: 3 Qualified Social Worker: 2 Therapeutic Recreation Specialist: 1 Nurse Practitioner: 1 Medical Director: 1 Occupational Therapy Assistant: 1

Staff by category

Q4 2025 · Oct 1 – Dec 31 More info This data comes from the CMS Payroll-Based Journal report covering October 1 – December 31, 2025.
Certified Nursing Assistant5505526,36292100%8
Licensed Practical Nurse2602612,91492100%8.2
Registered Nurse120123,82592100%8.1
Clinical Nurse Specialist110113,69992100%8.3
RN Director of Nursing6062,93392100%7.9
Mental Health Service Worker4041,3977784%7.9
Physical Therapy Assistant0551,2577582%6.5
Respiratory Therapy Technician0339498390%6.8
Speech Language Pathologist0559337784%7.9
Other Dietary Services Staff5056377582%6.6
Dietitian1015586773%8.3
Physical Therapy Aide0445358592%3.8
Nurse Practitioner1125166470%8.1
Qualified Social Worker0224626368%7.2
Occupational Therapy Aide2024626571%7
Administrator1014565762%8
Therapeutic Recreation Specialist0111452426%6
Medical Director011481213%4
Occupational Therapy Assistant0114367%7.2
55 Certified Nursing Assistant
% of Days 100%
26 Licensed Practical Nurse
% of Days 100%
12 Registered Nurse
% of Days 100%
11 Clinical Nurse Specialist
% of Days 100%
6 RN Director of Nursing
% of Days 100%
4 Mental Health Service Worker
% of Days 84%
5 Physical Therapy Assistant
% of Days 82%
3 Respiratory Therapy Technician
% of Days 90%
5 Speech Language Pathologist
% of Days 84%
5 Other Dietary Services Staff
% of Days 82%
1 Dietitian
% of Days 73%
4 Physical Therapy Aide
% of Days 92%
2 Nurse Practitioner
% of Days 70%
2 Qualified Social Worker
% of Days 68%
2 Occupational Therapy Aide
% of Days 71%
1 Administrator
% of Days 62%
1 Therapeutic Recreation Specialist
% of Days 26%
1 Medical Director
% of Days 13%
1 Occupational Therapy Assistant
% of Days 7%

Penalties and fines

Federal penalties imposed by CMS for regulatory violations, including civil money penalties (fines) and denials of payment for new Medicare/Medicaid admissions.

Source: CMS Penalties Database

No penalties in the past 3 years

No civil money penalties or payment denials were reported in the last 3 years.

Quality of care over time

These measures show how residents usually do over time at this home, based on health outcomes and preventive care.

High-risk clinical events score Info A composite score based on pressure ulcers, falls with injury, weight loss, walking ability decline, and activities of daily living decline. 10.4
In line with Virginia average

Virginia average: 10.1

Functional decline score Info A composite score based on activities of daily living decline, walking ability decline, and incontinence. 20.3
In line with Virginia average

Virginia average: 19.7

Long-stay resident measures
Significantly above average Info CMS star rating based on long-stay quality measure performance. 5 stars = significantly above average, 1 star = significantly below average.
Need for Help with Daily Activities Increased Info Percent of long-stay residents whose need for help with daily activities has increased 15.7%
7% better than Virginia average

Virginia average: 16.8%

Walking Ability Worsened Info Percent of long-stay residents whose ability to move independently worsened 24.2%
22% worse than Virginia average

Virginia average: 19.7%

Low Risk Residents with Bowel/Bladder Incontinence Info Percent of low risk long-stay residents who lose control of their bowels or bladder 21.1%
7% better than Virginia average

Virginia average: 22.6%

Falls with Major Injury Info Percent of long-stay residents experiencing one or more falls with major injury 3.5%
In line with Virginia average

Virginia average: 3.6%

High Risk Residents with Pressure Ulcers Info Percent of long-stay high risk residents with pressure ulcers 4.2%
21% better than Virginia average

Virginia average: 5.4%

Urinary Tract Infection Info Percent of long-stay residents with a urinary tract infection 1.0%
34% better than Virginia average

Virginia average: 1.5%

Lost Too Much Weight Info Percent of long-stay residents who lose too much weight 4.6%
22% better than Virginia average

Virginia average: 5.9%

Depressive Symptoms Info Percent of long-stay residents who have depressive symptoms 1.1%
92% better than Virginia average

Virginia average: 14.9%

Antipsychotic Use Info Percent of long-stay residents who received an antipsychotic medication 12.0%
7% better than Virginia average

Virginia average: 12.9%

Pneumococcal Vaccine Info Percent of long-stay residents assessed and appropriately given the pneumococcal vaccine 100.0%
10% better than Virginia average

Virginia average: 91.3%

Influenza Vaccine Info Percent of long-stay residents assessed and appropriately given the seasonal influenza vaccine 98.2%
In line with Virginia average

Virginia average: 94.0%

Hospitalizations per 1,000 days Info Number of hospitalizations per 1,000 long-stay resident days. 1.03
29% better than Virginia average

Virginia average: 1.46

ED visits per 1,000 days Info Number of outpatient emergency department visits per 1,000 long-stay resident days. 0.73
48% better than Virginia average

Virginia average: 1.41

Short-stay resident measures
Above average Info CMS star rating based on short-stay quality measure performance. 5 stars = much above average, 1 star = much below average.
Pneumococcal Vaccine Info Percent of short-stay residents assessed and appropriately given the pneumococcal vaccine 97.7%
30% better than Virginia average

Virginia average: 74.9%

Antipsychotic medication increase Info Percent of short-stay residents who newly received an antipsychotic medication 1.0%
20% better than Virginia average

Virginia average: 1.2%

Influenza Vaccine Info Percent of short-stay residents assessed and appropriately given the seasonal influenza vaccine 97.2%
32% better than Virginia average

Virginia average: 73.6%

Re-hospitalized after SNF stay Info Percentage of short-stay residents who were re-hospitalized after their nursing home admission. 21.5%
In line with Virginia average

Virginia average: 22.0%

Emergency department visits Info Percentage of short-stay residents who had an outpatient emergency department visit. 8.3%
29% better than Virginia average

Virginia average: 11.7%

Falls with major injury Info Percentage of SNF residents who experience falls with major injury during their stay. 1.3%
74% worse than Virginia average

Virginia average: 0.8%

Ability to care for self at discharge Info Percentage of residents at or above expected ability to care for themselves at discharge. 36.8%
32% worse than Virginia average

Virginia average: 53.7%

Successful return to home or community Info Rate of successful return to home or community from a skilled nursing facility. 60.3%
19% better than Virginia average

Virginia average: 50.6%

Breakdown by payment type

Medicare

33% of new residents, usually for short-term rehab.

Typical stay 23 days

Private pay

57% of new residents, often for short stays.

Typical stay 26 days

Medicaid

9% of new residents, often for long-term daily care.

Typical stay 1 years

Facility Characteristics

Source: CMS Long-Term Care Facility Characteristics (Data as of Jan 2026)

Total residents 136
Medicare
24
17.6% of residents
Medicaid
87
64% of residents
Private pay or other
25
18.4% of residents
Programs & Services
Residents Group

Residents meet regularly to discuss policies, care quality, and activities

Active Resident Council

Organized group of residents that meets regularly to discuss facility policies, quality of life, and activities.

Finances and operations

Privately-owned community
Operated by a business corporation.
Home revenue
$32.8M
Profit
$2.3M
Privately-owned community Operated by a business corporation.
Home revenue
$32.8M Rank #27 / 85Revenue — State benchmarkedThis home is ranked 27th out of 85 homes in Virginia. Shows this facility's annual revenue compared to the Virginia SNF average. Higher revenue generally means more resources for staffing and capital — read alongside Payroll %.Click the rank badge to see the full State ranking.Click here to see the full State ranking.
Profit
$2.3M
Payroll costs Info The portion of the home's budget spent on staff, including nurses, caregivers, and other employees who support care and operations. Rank #28 / 85Payroll — State benchmarkedThis home is ranked 28th out of 85 homes in Virginia. Shows total annual staff payroll benchmarked to the Virginia average. Higher payroll investment relative to peers often signals better staffing and less reliance on cheaper contract labor.Click the rank badge to see the full State ranking.Click here to see the full State ranking.
$13.2M
40.3% of revenue Rank #54 / 85Payroll % — State benchmarkedThis home is ranked 54th out of 85 homes in Virginia. Shows payroll as a percentage of revenue versus the Virginia average. Well-run Virginia SNFs typically land around 51–60% — the top third Statewide. Below 25% may signal understaffing or heavy agency use — read with Staffing ratings.Click the rank badge to see the full State ranking.Click here to see the full State ranking.
Other operating costs Info All remaining costs needed to run the home, such as food, utilities, building maintenance, supplies and administrative expenses.
$17.3M
Total costs $30.5M

What does this home offer?

Housing options icon

Housing Options: Private / Shared Rooms

Building type icon
Building type icon

Building Type: 2-story

Dining services icon

Dining Services

Housekeeping icon
Housekeeping icon

Housekeeping Services

Social and recreational activities icon

Social and Recreational Activities

On-site medical care and health services icon

On-site Medical Care and Health Services

Rehabilitative support icon

Rehabilitative Support

Who this home usually serves

TYPE OF STAY

Mix of rehab and long-term care

This home supports both short-term rehab and long-term care, with residents staying for a wide range of durations.

Places of interest near Potomac Falls Health and Rehab Center

Address 3.6 miles from city center Info Estimated distance in miles from Sterling's city center to Potomac Falls Health and Rehab Center's address, calculated via Google Maps.

Calculate Travel Distance to Potomac Falls Health and Rehab Center

Add your location

Address

Financial Assistance for
Nursing Home in Virginia

Potomac Falls Health and Rehab Center is located in Sterling, Virginia.
Here are the financial assistance programs available to residents in Virginia.

Get Financial aid guidance

Commonwealth Coordinated Care Plus (CCC Plus)

VA Medicaid CCC Plus

Age 65+ or disabled
General Virginia resident, Medicaid-eligible, nursing home-level care need.
Income Limits (2025) ~$2,829/month 300% FBR, individual
Asset Limits $2,000 (individual), $3,000 (couple).
VA

Managed care model; high demand in urban areas.

Benefits
Personal care (5-7 hours/day) Respite (240 hours/year) Adult day care ($65/day) Home modifications ($1,500 avg.)

Virginia Respite Care Grant Program

VA Respite Grant

Age Caregiver of someone 60+
General Virginia resident.
Income Limits ~$2,500/month individual, varies
Asset Limits $40,000 individual
VA

Limited grants; rural/urban balance.

Benefits
In-home respite (up to 30 days/year) Adult day care (~$65/day) Facility respite (up to 5 days)

Adult Services Program

Virginia Adult Services (AS)

Age 60+ (or disabled 18+)
General VA resident, need significant care (2+ ADLs), not Medicaid-eligible.
Income Limits (2025) Varies by locality; typically < ~$2,510/month 200% FPL
Asset Limits Limited assets (excludes home, car); varies by DSS.
VA

Serves ~5,000 annually; focuses on low-income independence.

Benefits
Personal care (4-6 hours/week) Adult day care (~$60/day) Chore services Assessments Respite (~5 days/year)

Auxiliary Grant Program

Virginia Auxiliary Grant (AG)

Age 65+ (or disabled 18+)
General VA resident, living in approved ALF/foster care, SSI-eligible or low-income.
Income Limits (2025) ~$1,041/month (individual, SSI level + $20 disregard); higher with medical deductions.
Asset Limits $2,000 individual
VA

Serves 4,000; personal needs allowance ($90/month).

Benefits
Cash (~$1,400-$1,700/month in 2025, varies by region) for ALF/foster care costs; basic care included

Medicare Savings Program (MSP)

Virginia Medicare Savings Program

Age 65+ or disabled
General VA resident, Medicare Part A/B.
Income Limits (2025) ~$2,510/month (QMB), ~$3,380/month (SLMB), ~$3,598/month (QI)—individual.
Asset Limits $9,430 (individual), $14,130 (couple).
VA

Includes Extra Help for Part D; no waitlist.

Benefits
Covers Part B premiums ($174.70/month) Deductibles ($240/year) Copays (~20%)

Energy Assistance Program (EAP)

Virginia Energy Assistance Program

Age 60+ prioritized
General VA resident, low-income household.
Income Limits (2025) ~$3,970/month 185% FPL
Asset Limits Not assessed.
VA

Fuel, Crisis, Cooling components; serves ~100,000 households.

Benefits
Heating/cooling aid ($300-$1,000/season) Crisis aid ($500 max) Equipment repair (~$250)

VA Aid and Attendance (A&A) and Housebound Benefits

Virginia VA Aid and Attendance/Housebound

Age 65+ or disabled veteran/spouse
General VA resident, wartime service, ADL help (A&A) or homebound.
Income Limits (2025) Net income < ~$1,984/month (veteran with dependent, A&A); pension offsets income.
Asset Limits ~$155,356 net worth
VA

High veteran population; supports rural/urban needs.

Benefits
Cash (~$1,433-$2,642/month veteran, ~$951-$1,318 spouse) for care costs

Property Tax Relief for the Elderly and Disabled

Virginia Property Tax Relief

Age 65+ or disabled
General VA resident, homeowner, income/asset limits vary by locality.
Income Limits (2025) ~$50,000-$75,000/year household, e.g., Fairfax: $72,000; Richmond: $50,000
Asset Limits Varies e.g., Fairfax: $400,000 net worth; Richmond: $100,000
VA

Offered in 90% of localities; saves ~$500-$2,000/year.

Benefits
Tax exemption/deferral (~$500-$2,000/year depending on locality)

Senior Farmers’ Market Nutrition Program (SFMNP)

Virginia SFMNP

Age 60+
General VA resident, low-income.
Income Limits (2025) ~$2,322/month 185% FPL
Asset Limits Not assessed.
VA

Vouchers (~$50-$75/season); serves ~15,000 via AAAs.

Benefits
Vouchers (~$50-$75/season) for produce at farmers’ markets

Compare Nursing Home around Great Falls

The information below is reported by the Virginia Department of Social Services and Department of Health.

4 facilities compared · CMS & VA Dept. of Health data

Filter by care type
Arleigh Burke Pavilion at Vinson Hall Retirement Community
NH

Nursing Home Licensed facility providing 24/7 skilled nursing care for residents with complex, ongoing medical needs. Staffed by RNs, LPNs, and CNAs. Inspected and star-rated annually by CMS. Accepts Medicare (short-term rehab) and Medicaid (long-term care).

AL

Assisted Living A licensed, long-term care setting for seniors or individuals with disabilities who need help with daily activities — like bathing, dressing, and medication management — but not 24-hour skilled nursing. Offers housing, meals, and around-the-clock support while aiming to maximize resident independence.

IL

Independent Living Lifestyle-focused communities for older adults offering dining, activities, and transportation with minimal personal care. Best for active, independent seniors who want community without medical support.

MC

Memory Care Secured, specialized care for people living with Alzheimer's or dementia. Staff trained in cognitive impairment, with higher staff-to-resident ratios and an environment designed to reduce confusion and wandering risk.

Mclean (Kirby Road)32 85.9% 0%5.53 -11%+48%$0134.3-41 52 Nmcgr$31.4M$15.5M49.3%495410
Potomac Falls Health and Rehab Center
NH

Nursing Home Licensed facility providing 24/7 skilled nursing care for residents with complex, ongoing medical needs. Staffed by RNs, LPNs, and CNAs. Inspected and star-rated annually by CMS. Accepts Medicare (short-term rehab) and Medicaid (long-term care).

MC

Memory Care Secured, specialized care for people living with Alzheimer's or dementia. Staff trained in cognitive impairment, with higher staff-to-resident ratios and an environment designed to reduce confusion and wandering risk.

RC

Respite Care Short-term temporary care — days to weeks — to give family caregivers a break. Full care provided during the stay. Often used after hospitalization or to trial a facility before a permanent placement decision.

Sterling (Leesburg Pike)150 93.6% +9%3.58 -15%-4%$03712.32147 59 Brenda White$32.8M$13.2M40.3%495179
The Virginian
NH

Nursing Home Licensed facility providing 24/7 skilled nursing care for residents with complex, ongoing medical needs. Staffed by RNs, LPNs, and CNAs. Inspected and star-rated annually by CMS. Accepts Medicare (short-term rehab) and Medicaid (long-term care).

AL

Assisted Living A licensed, long-term care setting for seniors or individuals with disabilities who need help with daily activities — like bathing, dressing, and medication management — but not 24-hour skilled nursing. Offers housing, meals, and around-the-clock support while aiming to maximize resident independence.

IL

Independent Living Lifestyle-focused communities for older adults offering dining, activities, and transportation with minimal personal care. Best for active, independent seniors who want community without medical support.

MC

Memory Care Secured, specialized care for people living with Alzheimer's or dementia. Staff trained in cognitive impairment, with higher staff-to-resident ratios and an environment designed to reduce confusion and wandering risk.

Fairfax (Arlington Boulevard)170 91.0% +6%3.90 +53%+4%$0217.0258 37 Focus Sh I Trs II LLC$34.0M$19.0M56%495319
August Healthcare at Leewood
NH

Nursing Home Licensed facility providing 24/7 skilled nursing care for residents with complex, ongoing medical needs. Staffed by RNs, LPNs, and CNAs. Inspected and star-rated annually by CMS. Accepts Medicare (short-term rehab) and Medicaid (long-term care).

AL

Assisted Living A licensed, long-term care setting for seniors or individuals with disabilities who need help with daily activities — like bathing, dressing, and medication management — but not 24-hour skilled nursing. Offers housing, meals, and around-the-clock support while aiming to maximize resident independence.

MC

Memory Care Secured, specialized care for people living with Alzheimer's or dementia. Staff trained in cognitive impairment, with higher staff-to-resident ratios and an environment designed to reduce confusion and wandering risk.

Annandale (Braddock Road)132 81.6% -5%4.19 -8%+12%$03311.0-131 60 Ina Belviy$16.5M$8.6M52.4%495337

Frequently Asked Questions about Potomac Falls Health and Rehab Center

What neighborhood is Potomac Falls Health and Rehab Center in?

Potomac Falls Health and Rehab Center is in the Leesburg Pike neighborhood.

Is Potomac Falls Health and Rehab Center in a walkable area?

Potomac Falls Health and Rehab Center has a walk score of 59. Moderately walkable. Some errands can be accomplished on foot, with a mix of nearby amenities.

What is the address of Potomac Falls Health and Rehab Center?

Potomac Falls Health and Rehab Center is located at 46531 Leesburg Pike, Sterling, VA 20164.

What is the phone number of Potomac Falls Health and Rehab Center?

(703) 834-5800 will put you in contact with the team at Potomac Falls Health and Rehab Center.

Is Potomac Falls Health and Rehab Center Medicare or Medicaid certified?

Yes — Potomac Falls Health and Rehab Center is a CMS-certified provider of Medicare and Medicaid.

Guides for Better Senior Living

Care Cost Calculator: See Prices in Your Area

Nursing Home Data Explorer

Don’t Wait Too Long: 7 Red Flag Signs Your Parent Needs Assisted Living Now

The True Cost of Assisted Living in 2025 – And How Families Are Paying For It

Understanding Senior Living Costs: Pricing Models, Discounts & Financial Assistance

Explore Open Rooms
1 Contact details
2 What type of senior care service are you looking for?
3 What budget do you have in mind for senior care?
4 How soon do you need to find care?
5 Additional details

Thank you for your interest!

Our team will be in touch shortly to help with next steps.