


Total health inspections
10
New Mexico average 6.8
Last Health inspection on Nov 2025
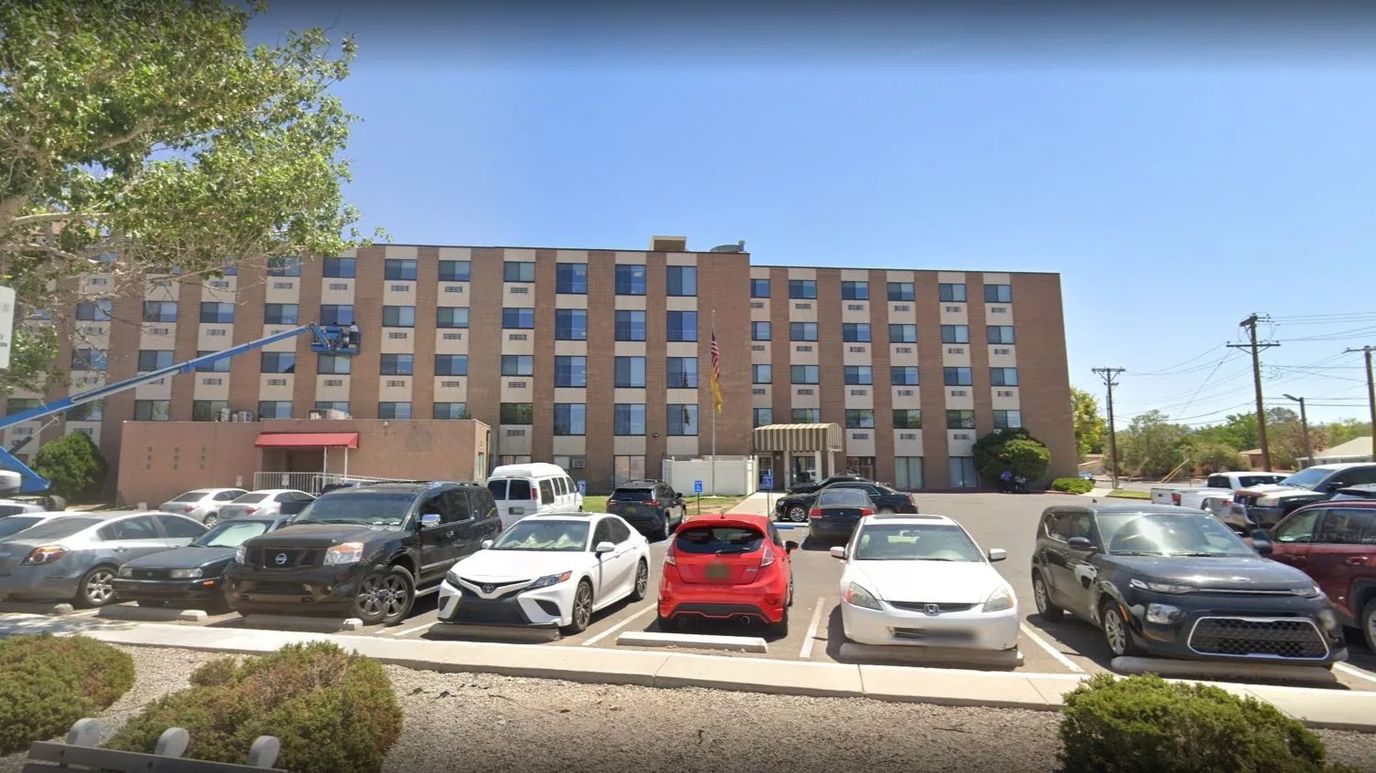
Princeton Place has been operating in Albuquerque’s La Mesa neighborhood for 40 years. The facility sits at 500 Louisiana Blvd NE, a 369-bed community offering nursing home care, memory care, hospice care, and nursing care. Presbyterian Kaseman Hospital is 1.02 miles out.
The Walk Score is 48, so most errands need a car, though a few nearby services are walkable. Ms. Cathy Sowers is the administrator.
At 286 residents and an average length of stay of 154 days, this is a facility built around long-term care. Total nursing time runs 3 hours and 33 minutes per resident per day: 2 hours 27 minutes from nurse aides, 43 minutes from RNs, and 32 minutes from LPN/LVNs. Physical therapy, occupational therapy, respiratory therapy, and dental services are available on-site, alongside dedicated memory care and hospice programs.
The amenity package includes a salon, fitness center, therapy gym, and outdoor patio. Meals are home-cooked. An Active Resident Council operates on-site, and the facility runs a staffed activities program. Shared and private suite options are available.
State inspections have historically covered areas such as medication management, infection prevention and control, environmental safety, and care planning and documentation. Princeton Place accepts Medicare, Medicaid, and private pay. For families looking at long-term placement in Albuquerque, Princeton Place is the largest nursing facility in the state by bed count, with a full care continuum and four decades of operating history in the city.
| Staff type | Hours / Day / Resident | vs state avg |
|---|---|---|
|
Registered Nurse (RN)
| 43m per day | ▲ 16% State avg: 37m per day · National avg: 41m per day |
|
LPN / LVN
| 32m per day | ▼ 25% State avg: 43m per day · National avg: 52m per day |
|
Nurse Aide
| 2h 27m per day | ▲ 9% State avg: 2h 14m per day · National avg: 2h 21m per day |
|
Weekend Total Nursing
| 3h 20m per day | ▲ 7% State avg: 3h 7m per day · National avg: 3h 26m per day |
|
Physical Therapist
| 1m per day | ▼ 79% State avg: 5m per day · National avg: 4m per day |
|
Weekend RN
| 38m per day | ▲ 37% State avg: 28m per day · National avg: 29m per day |
Key information about the people who lead and staff this community.
In New Mexico, the Department of Health, Division of Health Improvement is the primary regulatory authority that conducts unannounced inspections and investigates quality of care complaints.
Deficiencies
| This Facility | NM Average | vs. NM Avg |
|---|---|---|---|
|
Total deficiencies
| 59 | 30 | This facility has 97% more total deficiencies than a typical New Mexico nursing home (59 vs. NM avg 30).↑ 97% worse |
New Mexico average 6.8
Last Health inspection on Nov 2025
New Mexico average 48.6
New Mexico average 7.31
Health citations are formal notices following inspections when they fail to comply with safety and care standards.
36 of 54 citations resulted from standard inspections; 17 of 54 resulted from complaint investigations; and 1 of 54 came from combined inspections (standard and complaint).
New Mexico average: 1.1
New Mexico average: 1.3
Reporting period: October 1 – December 31, 2025 (Q4 2025). Source: CMS Payroll-Based Journal report.
Manages medical care and health needs.
Assists with medical care and medications.
Helps with daily care and mobility.
Total hours from contractors
21,619 contractor hours this quarter
| Certified Nursing Assistant | 101 | 112 | 213 | 58,529 | 92 | 100% | 9.2 |
| Registered Nurse | 31 | 44 | 75 | 15,154 | 92 | 100% | 9.3 |
| Licensed Practical Nurse | 27 | 0 | 27 | 10,897 | 92 | 100% | 9.7 |
| Other Dietary Services Staff | 17 | 0 | 17 | 6,729 | 92 | 100% | 7.8 |
| Qualified Activities Professional | 10 | 0 | 10 | 4,109 | 92 | 100% | 9.9 |
| Medication Aide/Technician | 9 | 0 | 9 | 3,544 | 92 | 100% | 8.6 |
| RN Director of Nursing | 7 | 0 | 7 | 2,749 | 70 | 76% | 8 |
| Clinical Nurse Specialist | 9 | 0 | 9 | 2,610 | 74 | 80% | 8.1 |
| Dental Services Staff | 5 | 0 | 5 | 2,068 | 68 | 74% | 7.7 |
| Administrator | 3 | 0 | 3 | 1,200 | 64 | 70% | 8 |
| Speech Language Pathologist | 2 | 1 | 3 | 923 | 72 | 78% | 7 |
| Physical Therapy Aide | 3 | 0 | 3 | 863 | 78 | 85% | 6.4 |
| Physical Therapy Assistant | 2 | 0 | 2 | 542 | 75 | 82% | 6.6 |
| Qualified Social Worker | 2 | 0 | 2 | 484 | 68 | 74% | 6.9 |
| Nurse Practitioner | 1 | 0 | 1 | 440 | 55 | 60% | 8 |
| Respiratory Therapy Technician | 1 | 0 | 1 | 436 | 55 | 60% | 7.9 |
| Mental Health Service Worker | 1 | 0 | 1 | 428 | 54 | 59% | 7.9 |
| Occupational Therapy Assistant | 0 | 2 | 2 | 178 | 69 | 75% | 2.4 |
| Occupational Therapy Aide | 0 | 1 | 1 | 118 | 31 | 34% | 3.8 |
| Medical Director | 0 | 1 | 1 | 34 | 26 | 28% | 1.3 |
| Nurse Aide in Training | 1 | 0 | 1 | 22 | 2 | 2% | 11 |
Includes penalties issued in 2024-2025
Federal penalties imposed by CMS for regulatory violations, including civil money penalties (fines) and denials of payment for new Medicare/Medicaid admissions.
Source: CMS Penalties Database (Data as of Jan 2026)
New Mexico average: $86K
New Mexico average: 2.6
New Mexico average: 0.5
Penalties are imposed by CMS for violations of federal nursing home regulations.
2 penalties in the past 3 years
Multiple penalties were reported in the last 3 years.
Last updated: Jan 2026
These measures show how residents usually do over time at this home, based on health outcomes and preventive care.
New Mexico average: 9.6
New Mexico average: 18.3
New Mexico average: 15.6%
New Mexico average: 18.3%
New Mexico average: 21.0%
New Mexico average: 3.3%
New Mexico average: 5.8%
New Mexico average: 1.0%
New Mexico average: 5.8%
New Mexico average: 1.7%
New Mexico average: 12.7%
New Mexico average: 97.2%
New Mexico average: 98.7%
New Mexico average: 1.61
New Mexico average: 2.64
New Mexico average: 86.1%
New Mexico average: 1.3%
New Mexico average: 86.4%
New Mexico average: 21.3%
New Mexico average: 15.9%
New Mexico average: 0.8%
New Mexico average: 53.7%
New Mexico average: 50.6%
Quality measures are calculated from Minimum Data Set (MDS) assessments. For most measures, lower percentages indicate better care quality.
9% of new residents, usually for short-term rehab.
34% of new residents, often for short stays.
57% of new residents, often for long-term daily care.
Source: CMS Long-Term Care Facility Characteristics (Data as of Jan 2026)
Residents meet regularly to discuss policies, care quality, and activities
Organized group of residents that meets regularly to discuss facility policies, quality of life, and activities.
Data sourced from CMS Long-Term Care Facility Characteristics quarterly report. Payer mix reflects the current resident census by primary payment source.
Historical financial and operational data for Princeton Place from 2011–2023, based on CMS SNF Cost Reports.
Key figures below are for fiscal year ending in 12/2023.
Based on CMS SNF Cost Report for fiscal year ending in 12/2023.
Most residents stay for extended periods and receive ongoing daily care.
Most new residents arrive under Medicaid (57% of admissions), and a typical Medicaid stay runs around 7 - 8 months.
Coverage residents most often arrive under.
Coverage residents most often leave under.
![]() 4.7 miles from city center
4.7 miles from city center
![]() Estimated distance in miles from Albuquerque's city center to Princeton Place's address, calculated via Google Maps.
— 1.02 miles to nearest hospital (Presbyterian Kaseman Hospital)
Estimated distance in miles from Albuquerque's city center to Princeton Place's address, calculated via Google Maps.
— 1.02 miles to nearest hospital (Presbyterian Kaseman Hospital)
Add your location
Info below is compiled from CMS reports & the NM Dept. of Health, senior community websites & trusted data sources such as Walk Score & BBB.
Communities are listed from highest to lowest based on our ranking methodology.
| Advanced Health Care of Albuquerque | NH SNF | Albuquerque (Duke City Industrial Area) | 47
Facility
47
NM AVG
68
Rank
#82 / 144 |
100.0%
Facility
100.0%
NM AVG
77.1
Rank
#1 / 108 | +30% | 3.93
Facility
3.93
NM AVG
4.01
Rank
#14 / 48 | +24% | -2% | $39.9k
Facility
$39.9k
NM AVG
$83.5k
Rank
#33 / 49 | 18
Facility
18
NM AVG
48.6
Rank
#4 / 49 | 3.0
Facility
3.0
NM AVG
7.3
Rank
#3 / 49 | 4 | 47 | - |
62
Facility
62
NM AVG
43
Rank
#66 / 207 | Ralph Hansen | $10.1MFiscal year ending 12/2023
Facility
$10.1MFiscal year ending 12/2023
NM AVG
$11.4M
Rank
#20 / 49 | $5.0MFiscal year ending 12/2023
Facility
$5.0MFiscal year ending 12/2023
NM AVG
$5.0M
Rank
#30 / 49 | 49.8%Fiscal year ending 12/2023
Facility
49.8%Fiscal year ending 12/2023
NM AVG
46.6%
Rank
#46 / 49 | 325119 | ||||
| Albuquerque Heights Healthcare and Rehabilitation Center | NH HOS MC PC RC SNF | Albuquerque (Hodgin) | 134
Facility
134
NM AVG
68
Rank
#9 / 144 |
35.8%
Facility
35.8%
NM AVG
77.1
Rank
#105 / 108 | -54% | 3.67
Facility
3.67
NM AVG
4.01
Rank
#22 / 48 | +6% | -9% | $8.2k
Facility
$8.2k
NM AVG
$83.5k
Rank
#23 / 49 | 81
Facility
81
NM AVG
48.6
Rank
#45 / 49 | 6.8
Facility
6.8
NM AVG
7.3
Rank
#21 / 49 | 1 | 48 | A+ |
73
Facility
73
NM AVG
43
Rank
#31 / 207 | David Hicks | $19.3MFiscal year ending 12/2023
Facility
$19.3MFiscal year ending 12/2023
NM AVG
$11.4M
Rank
#6 / 49 | $8.9MFiscal year ending 12/2023
Facility
$8.9MFiscal year ending 12/2023
NM AVG
$5.0M
Rank
#2 / 49 | 46.1%Fiscal year ending 12/2023
Facility
46.1%Fiscal year ending 12/2023
NM AVG
46.6%
Rank
#13 / 49 | 325069 | ||||
| Odelia Healthcare | NH PC SNF | Ne Albuquerque (First Plaza) | 119
Facility
119
NM AVG
68
Rank
#23 / 144 |
95.8%
Facility
95.8%
NM AVG
77.1
Rank
#16 / 108 | +24% | 3.62
Facility
3.62
NM AVG
4.01
Rank
#26 / 48 | +44% | -10% | $4.1k
Facility
$4.1k
NM AVG
$83.5k
Rank
#21 / 49 | 33
Facility
33
NM AVG
48.6
Rank
#13 / 49 | 4.7
Facility
4.7
NM AVG
7.3
Rank
#8 / 49 | 1 | 114 | - |
90
Facility
90
NM AVG
43
Rank
#4 / 207 | Solomon Gurwitz | $17.5MFiscal year ending 08/2024
Facility
$17.5MFiscal year ending 08/2024
NM AVG
$11.4M
Rank
#10 / 49 | $8.9MFiscal year ending 08/2024
Facility
$8.9MFiscal year ending 08/2024
NM AVG
$5.0M
Rank
#5 / 49 | 51%Fiscal year ending 08/2024
Facility
51%Fiscal year ending 08/2024
NM AVG
46.6%
Rank
#15 / 49 | 325060 | ||||
| Fiesta Park Wellness & Rehabilitation | NH PC SNF | Ne Albuquerque (Wildflower Area) | 105
Facility
105
NM AVG
68
Rank
#30 / 144 |
97.1%
Facility
97.1%
NM AVG
77.1
Rank
#14 / 108 | +26% | 3.75
Facility
3.75
NM AVG
4.01
Rank
#22 / 48 | -50% | -7% | $21.2k
Facility
$21.2k
NM AVG
$83.5k
Rank
#28 / 49 | 40
Facility
40
NM AVG
48.6
Rank
#21 / 49 | 6.7
Facility
6.7
NM AVG
7.3
Rank
#20 / 49 | 2 | 102 | - |
18
Facility
18
NM AVG
43
Rank
#153 / 207 | - | $16.4MFiscal year ending 12/2023
Facility
$16.4MFiscal year ending 12/2023
NM AVG
$11.4M
Rank
#2 / 49 | $8.8MFiscal year ending 12/2023
Facility
$8.8MFiscal year ending 12/2023
NM AVG
$5.0M
Rank
#6 / 49 | 53.5%Fiscal year ending 12/2023
Facility
53.5%Fiscal year ending 12/2023
NM AVG
46.6%
Rank
#42 / 49 | 325123 | ||||
| Princeton Place | NH HOS MC SNF | Albuquerque (La Mesa) | 369
Facility
369
NM AVG
68
Rank
#1 / 144 |
78.9%
Facility
78.9%
NM AVG
77.1
Rank
#62 / 108 | +2% | 3.55
Facility
3.55
NM AVG
4.01
Rank
#30 / 48 | +63% | -12% | $74.9k
Facility
$74.9k
NM AVG
$83.5k
Rank
#40 / 49 | 54
Facility
54
NM AVG
48.6
Rank
#31 / 49 | 5.4
Facility
5.4
NM AVG
7.3
Rank
#10 / 49 | 2 | 291 | A+ |
48
Facility
48
NM AVG
43
Rank
#101 / 207 | - | $25.4MFiscal year ending 12/2023
Facility
$25.4MFiscal year ending 12/2023
NM AVG
$11.4M
Rank
#1 / 49 | $13.8MFiscal year ending 12/2023
Facility
$13.8MFiscal year ending 12/2023
NM AVG
$5.0M
Rank
#1 / 49 | 54.4%Fiscal year ending 12/2023
Facility
54.4%Fiscal year ending 12/2023
NM AVG
46.6%
Rank
#29 / 49 | 325045 |
Princeton Place is located in Albuquerque, New Mexico.
Here are the financial assistance programs available to residents in New Mexico.
Princeton Place is in the La Mesa neighborhood of Albuquerque.
Princeton Place has a walk score of 48. Somewhat walkable. A few nearby services may be reachable on foot, but most trips require transportation.
Princeton Place's occupancy is 61.9%.
Princeton Place has been operating for approximately 40 years, based on available licensing and registration records.
No, Princeton Place has a no-pet policy.
Princeton Place is registered as a for-profit in NM.
Yes — there is 1 photo of Princeton Place in the photo gallery on this page.
Care Cost Calculator: See Prices in Your Area
Nursing Home Data Explorer
Don’t Wait Too Long: 7 Red Flag Signs Your Parent Needs Assisted Living Now
The True Cost of Assisted Living in 2025 – And How Families Are Paying For It
Understanding Senior Living Costs: Pricing Models, Discounts & Financial Assistance


