Explore Open Rooms

1 Contact details
2 What type of senior care service are you looking for?
3 What budget do you have in mind for senior care?
4 How soon do you need to find care?
5 Additional details

Thank you for your interest!

Our team will be in touch shortly to help with next steps.

Nursing Home

Raleigh Rehabilitation Center

Nursing Home

Raleigh Rehabilitation Center

616 Wade Ave, Raleigh, NC 27605 View map
Overview of Raleigh Rehabilitation Center

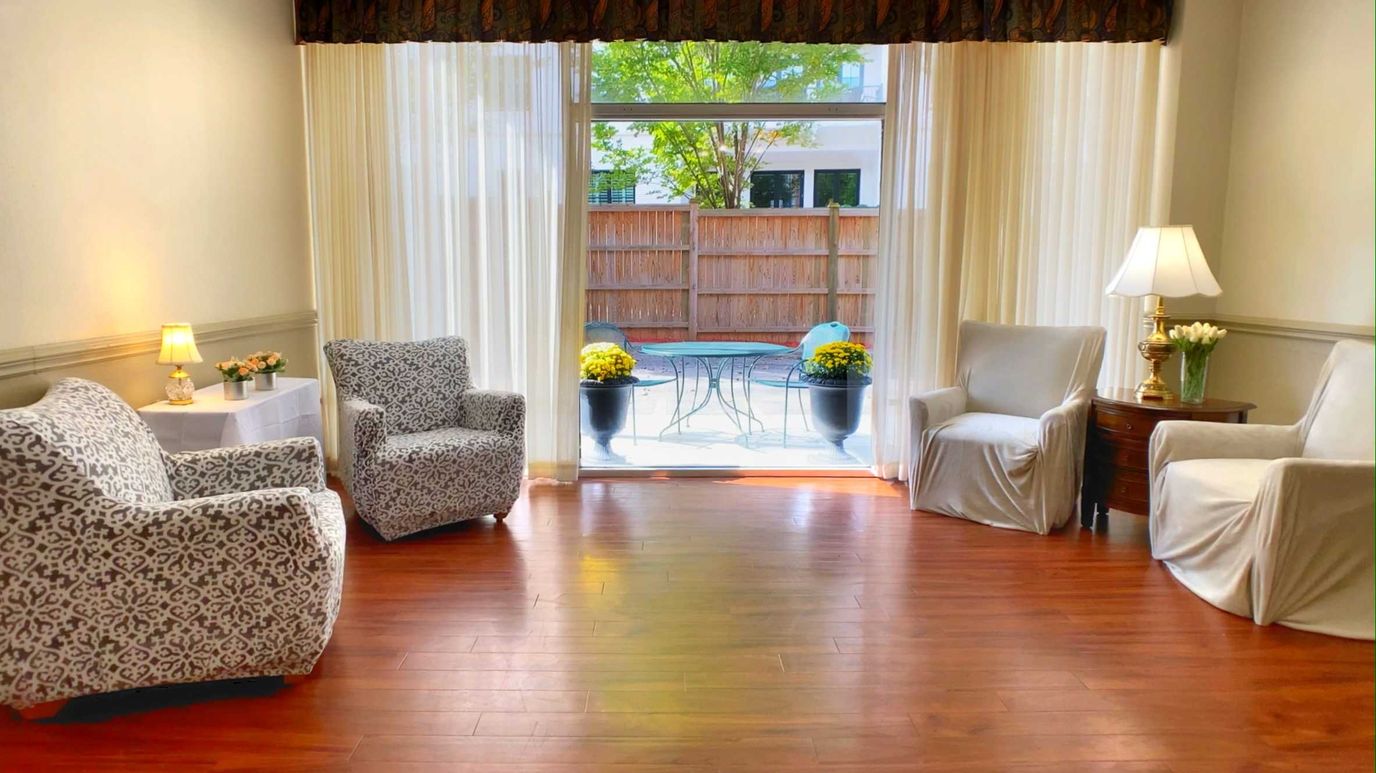
The Raleigh Rehabilitation Center empowers its residents to push their limits and achieve their full potential. The facility offers both short-term and in-patient stays, with an impressive range of services to ensure residents receive the highest quality of care. These services include dedicated physicians, pastoral care providers, social workers, wound care specialists, dieticians, and pharmacists. In addition to these services, hospice and respite care are also available for those who require it.

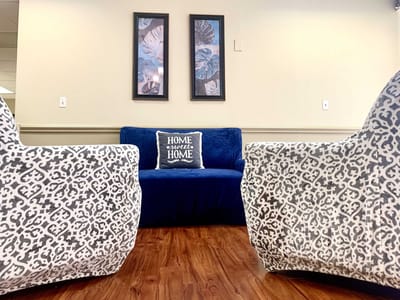
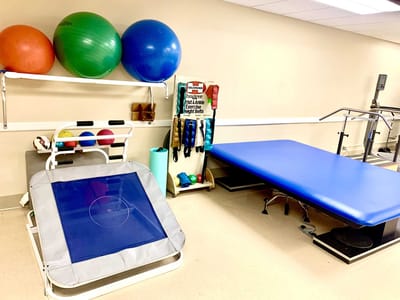
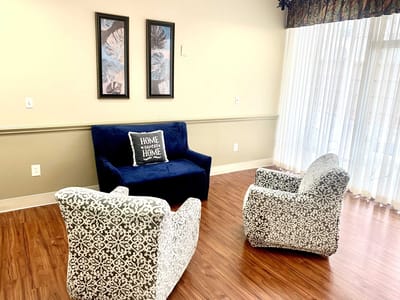
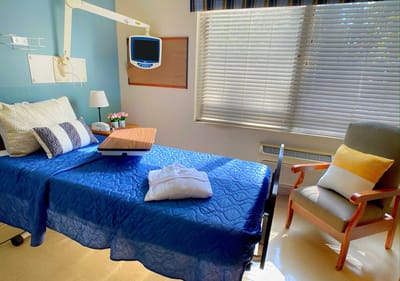
Privacy and comfort are a top priority at the Raleigh Rehabilitation Center. The center provides private suites and semi-private rooms that are cozy and inviting. Residents can also enjoy the resident spa and fully equipped rehabilitation gym to help them relax and stay active. The center’s dining options are exceptional as well, with delicious and nutritious meals catering to all dietary requirements. The chefs prepare each meal with care to ensure that residents can savor every bite.

(919) 828-6251

Managed by Jackie

Administrator

Jackie serves as the administrator at Raleigh Rehabilitation Center, leading the team in making significant improvements over recent years. She and her staff are dedicated to providing excellent care, especially noted by families for their responsiveness and compassion during challenging times such as the COVID-19 lockdown.

Quality ratings

Measured by Centers for Medicare & Medicaid Services (CMS)

Overall rating Info The Overall CMS Rating combines results from health inspections, staffing levels and quality measures. Health inspections carry the most weight. Staffing and quality scores can increase or decrease the final rating based on performance compared to state and national standards.
3/5
North Carolina average: 2.8/5
Health Inspection Info Based on the results of the facility's three most recent standard inspections and any complaint investigations. CMS reviews the number, scope, and severity of deficiencies, with more recent findings weighted more heavily.
3/5
North Carolina average: 2.8/5
Staffing Info Measures average nursing staff hours per resident per day, including Registered Nurses (RNs) and total nursing staff. Ratings are adjusted based on the level of care residents require and are compared to state and national benchmarks.
2/5
North Carolina average: 2.7/5
Quality Measures Info Based on clinical and physical health indicators reported to CMS, such as hospital readmissions, falls, pressure ulcers, and improvements in mobility. These measures reflect how well residents' health needs are being managed.
4/5
North Carolina average: 3.2/5

Nursing care per resident

Info This shows how many total hours of nursing staff time are available per resident each day. Higher numbers usually mean more staff support.
3h 32m per day

This home provides 11% less nursing time per resident than the North Carolina average.

North Carolina average: 3h 59m per day

Staffing hours breakdown

Info Hours of care per resident per day, broken down by staff type. Data from CMS Medicare.
Staff type Facility State avg National avg
Registered Nurse (RN) Info Registered nurse hours per resident per day. 22m per day 35m per day 41m per day
Nurse Aide Info Nurse aide hours per resident per day. 2h 5m per day 2h 19m per day 2h 21m per day
Total Nursing (Weekend) Info Total number of nurse staff hours per resident per day on weekends. 3h 7m per day 3h 20m per day 3h 26m per day
Physical Therapist Info Physical therapist staff hours per resident per day. 9m per day 5m per day 4m per day
RN (Weekend) Info Registered nurse hours per resident per day on weekends. 24m per day 23m per day 29m per day

Capacity and availability

Medium-capacity home

Offers a balance of services and community atmosphere.

Total beds 157

This home usually has availability

Lower occupancy suggests more openings may be available.

Lower demand than the North Carolina average
Occupancy rate 80.8%
Residents per day (avg) 140
Occupancy rate
80.8%
Residents per day (avg)
140

Who this home usually serves

TYPE OF STAY

Mix of rehab and long-term care

This home supports both short-term rehab and long-term care, with residents staying for a wide range of durations.

Breakdown by payment type

Medicare

33% of new residents, usually for short-term rehab.

Typical stay 1 - 2 months

Private pay

55% of new residents, often for short stays.

Typical stay 1 - 2 months

Medicaid

12% of new residents, often for long-term daily care.

Typical stay 1 - 2 years

Finances and operations

Privately-owned community
Operated by a business corporation.
Home revenue
$18.9M
Operating loss
-$226.5K
Privately-owned community Operated by a business corporation.
Home revenue
$18,921,965.00
Operating loss
$-226,523.00
Payroll costs Info The portion of the home's budget spent on staff, including nurses, caregivers, and other employees who support care and operations.
$6.2M
32.8% of revenue
Other operating costs Info All remaining costs needed to run the home, such as food, utilities, building maintenance, supplies and administrative expenses.
$13.0M
Total costs $19.1M
Walk Score
Walk Score: 48 / 100
Somewhat walkable. A few nearby services may be reachable on foot, but most trips require transportation.

About this community

Additional licensing details

Accreditations: CMS 5-Star Center Recognition

Care Services

Accepts Medicaid
Accepts Medicare
Nursing Services
Rehabilitation Services
Respite Care
Skilled Nursing
Licensed Nurses/CNAs
24-Hour Staffing
Short-Term Rehab

All Levels of Care

Short-Term Stay
In-Patient Residential Stay
Outpatient Rehabilitation Services

Amenities & Lifestyle

Private/Semi Private Rooms
Admissions 7 Days per Week
Landscaped Grounds
Therapy up to 7 Days per Week
Activities
Rehabilitation Gym
Dining Areas
Laundry Services
Courtyard
Library
Indoor/Outdoor Common Areas
Phone/Cable TV Service

Programs & Activities

Activities
Activities available.
Specific Programs
Short-Term Stay, In-Patient Residential Stay, Specialty Programs, Post COVID-19 Recovery Program, Telemedicine, Outpatient Rehabilitation Services, Respiratory Care Services, Hospice Care, Respite Care
Operating Hours
24/7

Pricing & Financial Information

Dining & Nutrition

Food Description
Fine dining available.

Types of Care at Raleigh Rehabilitation Center

Skilled Nursing
Contact Raleigh Rehabilitation Center

Health Inspection History

Inspections
Total health inspections 5

North Carolina average 4


Last Health inspection on Dec 2024

Total health citations 26

North Carolina average 20.9

Citations per inspection
5.2

North Carolina average 4.99


Health citations are formal notices following inspections when they fail to comply with safety and care standards.

23 of 26 citations resulted from standard inspections; 2 of 26 resulted from complaint investigations; and 1 of 26 came from combined inspections (standard and complaint).

Breakdown of citation severity (last 3 years)
Critical Health citations More info 1
23% better than North Carolina average

North Carolina average: 1.3


Serious Health citations More info 3
233% worse than North Carolina average

North Carolina average: 0.9

1 critical citation More info North Carolina average: 1.3

3 serious citations More info North Carolina average: 0.9

21 moderate citations More info North Carolina average: 17.1

1 minor citation More info North Carolina average: 1.6
Citations history (last 3 years)
Pharmacy moderate citation Info Issues related to medication management, including how drugs are stored, administered, and monitored. Dec 19, 2024
Corrected

Quality of Care moderate citation Info Issues related to how well residents receive appropriate treatment and support for their medical and daily care needs. Dec 19, 2024
Corrected

Care Planning moderate citation Info Issues related to creating and updating personalized care plans for residents based on their needs and conditions. Dec 19, 2024
Corrected

Administration serious citation Info Issues related to how the facility is managed, including policies, procedures, and compliance with regulations. Oct 12, 2023
Corrected

Compare Nursing Homes around Raleigh The information below is reported by the North Carolina Department of Health and Human Services, Division of Health Service Regulation.

5 facilities compared · CMS & NC Dept. of Health data · Updated Mar 2026

College Pines Health and Rehabilitation Center
AL

Assisted Living A licensed, long-term care setting for seniors or individuals with disabilities who need help with daily activities — like bathing, dressing, and medication management — but not 24-hour skilled nursing. Offers housing, meals, and around-the-clock support while aiming to maximize resident independence.

NH

Nursing Home Licensed facility providing 24/7 skilled nursing care for residents with complex, ongoing medical needs. Staffed by RNs, LPNs, and CNAs. Inspected and star-rated annually by CMS. Accepts Medicare (short-term rehab) and Medicaid (long-term care).

Connelly Springs
104
88.6%
+16%
3.98
-2%
0%
2
4
2
92
-
6
-
$15,2M
$5,2M
34.1%
345446
Capital Nursing And Rehabilitation Center
AL

Assisted Living A licensed, long-term care setting for seniors or individuals with disabilities who need help with daily activities — like bathing, dressing, and medication management — but not 24-hour skilled nursing. Offers housing, meals, and around-the-clock support while aiming to maximize resident independence.

HC

Home Care Professional care delivered in the person's own home — from companionship and errands to skilled nursing and therapy. Allows seniors to age in place. Medicare covers skilled home health when medically necessary.

IL

Independent Living Lifestyle-focused communities for older adults offering dining, activities, and transportation with minimal personal care. Best for active, independent seniors who want community without medical support.

NH

Nursing Home Licensed facility providing 24/7 skilled nursing care for residents with complex, ongoing medical needs. Staffed by RNs, LPNs, and CNAs. Inspected and star-rated annually by CMS. Accepts Medicare (short-term rehab) and Medicaid (long-term care).

Raleigh (East Raleigh)
125
75.9%
-1%
3.43
-16%
-14%
0
14
0
100
B-
43
Liberty Commons Nursing And Rehabilitation Center Of Wake County, Llc
$13,6M
$5,4M
39.4%
345202
Hillcrest Raleigh At Crabtree Valley
AL

Assisted Living A licensed, long-term care setting for seniors or individuals with disabilities who need help with daily activities — like bathing, dressing, and medication management — but not 24-hour skilled nursing. Offers housing, meals, and around-the-clock support while aiming to maximize resident independence.

NH

Nursing Home Licensed facility providing 24/7 skilled nursing care for residents with complex, ongoing medical needs. Staffed by RNs, LPNs, and CNAs. Inspected and star-rated annually by CMS. Accepts Medicare (short-term rehab) and Medicaid (long-term care).

Raleigh (North Hills)
134
73.7%
-4%
4.27
+34%
+7%
1
12
1
100
A+
31
Hillcrest Convalescent Center, Inc.
$21,5M
$6,5M
30.2%
345555
Raleigh Rehabilitation Center
AL

Assisted Living A licensed, long-term care setting for seniors or individuals with disabilities who need help with daily activities — like bathing, dressing, and medication management — but not 24-hour skilled nursing. Offers housing, meals, and around-the-clock support while aiming to maximize resident independence.

NH

Nursing Home Licensed facility providing 24/7 skilled nursing care for residents with complex, ongoing medical needs. Staffed by RNs, LPNs, and CNAs. Inspected and star-rated annually by CMS. Accepts Medicare (short-term rehab) and Medicaid (long-term care).

Raleigh
157
80.8%
+6%
3.54
+35%
-11%
3
26
4
140
-
48
Jackson, Christina
$18,9M
$6,2M
32.8%
345049
Hayes Barton Place
-
AL

Assisted Living A licensed, long-term care setting for seniors or individuals with disabilities who need help with daily activities — like bathing, dressing, and medication management — but not 24-hour skilled nursing. Offers housing, meals, and around-the-clock support while aiming to maximize resident independence.

IL

Independent Living Lifestyle-focused communities for older adults offering dining, activities, and transportation with minimal personal care. Best for active, independent seniors who want community without medical support.

MC

Memory Care Secured, specialized care for people living with Alzheimer's or dementia. Staff trained in cognitive impairment, with higher staff-to-resident ratios and an environment designed to reduce confusion and wandering risk.

NH

Nursing Home Licensed facility providing 24/7 skilled nursing care for residents with complex, ongoing medical needs. Staffed by RNs, LPNs, and CNAs. Inspected and star-rated annually by CMS. Accepts Medicare (short-term rehab) and Medicaid (long-term care).

Raleigh (Five Points)
-
-
-
-
-
-
-
-
-
0
0
0
-
-
59
-
-
-
-
-

Places of interest near Raleigh Rehabilitation Center

Address 2.1 miles from city center — 2.77 miles to nearest hospital (Duke Raleigh Hospital, a Campus of Duke University Hospital)

Address 616 Wade Ave, Raleigh, NC 27605

Calculate Travel Distance to Raleigh Rehabilitation Center

Add your location

Address

Staffing Data (Q2 2025)

This data corresponds to Q2 2025 and is based on CMS Payroll-Based Journal.

Total staff 237
Employees 122
Contractors 115
Staff to resident ratio 1.80:1
0% compared with North Carolina average

North Carolina average ratio: 1.85:1

Avg staff/day 75
Average shift 7.9 hours
0% compared with North Carolina average

North Carolina average: 8 hours

Total staff hours (quarter) 53,707
Nursing staff breakdown
Registered Nurse

Manages medical care and health needs.

Total count 29
Average shift length Info Average shift length. Calculated as total hours divided by days worked and average staff per day. 8.2 hours

This role is partially covered by contractors.

Licensed Practical Nurse

Assists with medical care and medications.

Total count 63
Average shift length Info Average shift length. Calculated as total hours divided by days worked and average staff per day. 8 hours

This role is partially covered by contractors.

Certified Nursing Assistant

Helps with daily care and mobility.

Total count 109
Average shift length Info Average shift length. Calculated as total hours divided by days worked and average staff per day. 8.2 hours

This role is partially covered by contractors.

Contractor staffing

Total hours from contractors

14%

7,516 contractor hours this quarter

Certified Nursing Assistant: 53 Licensed Practical Nurse: 40 Registered Nurse: 21 Administrator: 1
Staff by category
Certified Nursing Assistant565310926,81891100%8.2
Licensed Practical Nurse23406312,84191100%8
Registered Nurse821294,23191100%8.2
Respiratory Therapy Technician8081,9748189%6.3
Qualified Social Worker6061,0347684%6.6
Dental Services Staff2029647582%8
Physical Therapy Aide3039467077%7.7
Physical Therapy Assistant5059007987%6.8
RN Director of Nursing3035997178%4.5
Dietitian1015206470%8.1
Occupational Therapist1015176470%8.1
Clinical Nurse Specialist1015126470%8
Administrator1124725965%8
Nurse Practitioner1014485662%8
Speech Language Pathologist1013575156%7
Occupational Therapy Aide1012883640%8
Mental Health Service Worker1012883640%8
109 Certified Nursing Assistant
% of Days 100%
63 Licensed Practical Nurse
% of Days 100%
29 Registered Nurse
% of Days 100%
8 Respiratory Therapy Technician
% of Days 89%
6 Qualified Social Worker
% of Days 84%
2 Dental Services Staff
% of Days 82%
3 Physical Therapy Aide
% of Days 77%
5 Physical Therapy Assistant
% of Days 87%
3 RN Director of Nursing
% of Days 78%
1 Dietitian
% of Days 70%
1 Occupational Therapist
% of Days 70%
1 Clinical Nurse Specialist
% of Days 70%
2 Administrator
% of Days 65%
1 Nurse Practitioner
% of Days 62%
1 Speech Language Pathologist
% of Days 56%
1 Occupational Therapy Aide
% of Days 40%
1 Mental Health Service Worker
% of Days 40%

Facility Characteristics

Source: CMS Long-Term Care Facility Characteristics (Data as of Jan 2026)

Total census
132 residents
Residents by payment source
Medicare
8 residents (6.1%)
Medicaid
95 residents (72%)
Private pay or other
29 residents (22%)
Programs & Services
Residents' Group

Residents meet regularly to discuss policies, care quality, and activities

Active Resident Council

Organized group of residents that meets regularly to discuss facility policies, quality of life, and activities.

Quality of care over time

These measures show how residents usually do over time at this home, based on health outcomes and preventive care.

High-risk clinical events score Info A composite score based on pressure ulcers, falls with injury, weight loss, walking ability decline, and activities of daily living decline. 8.1
29% better than North Carolina average

North Carolina average: 11.5

Functional decline score Info A composite score based on activities of daily living decline, walking ability decline, and incontinence. 15.4
25% better than North Carolina average

North Carolina average: 20.6

Long-stay resident measures
Significantly above average North Carolina avg: 2.9 Info CMS star rating based on long-stay quality measure performance. 5 stars = significantly above average, 1 star = significantly below average.
Need for Help with Daily Activities Increased Info Percent of long-stay residents whose need for help with daily activities has increased 11.7%
34% better than North Carolina average

North Carolina average: 17.5%

Walking Ability Worsened Info Percent of long-stay residents whose ability to move independently worsened 12.5%
46% better than North Carolina average

North Carolina average: 23.3%

Low Risk Residents with Bowel/Bladder Incontinence Info Percent of low risk long-stay residents who lose control of their bowels or bladder 22.1%
In line with North Carolina average

North Carolina average: 21.4%

Falls with Major Injury Info Percent of long-stay residents experiencing one or more falls with major injury 2.1%
44% better than North Carolina average

North Carolina average: 3.6%

High Risk Residents with Pressure Ulcers Info Percent of long-stay high risk residents with pressure ulcers 4.2%
33% better than North Carolina average

North Carolina average: 6.3%

Urinary Tract Infection Info Percent of long-stay residents with a urinary tract infection 0.6%
76% better than North Carolina average

North Carolina average: 2.6%

Lost Too Much Weight Info Percent of long-stay residents who lose too much weight 10.2%
39% worse than North Carolina average

North Carolina average: 7.4%

Depressive Symptoms Info Percent of long-stay residents who have depressive symptoms 5.9%
33% worse than North Carolina average

North Carolina average: 4.4%

Antipsychotic Use Info Percent of long-stay residents who received an antipsychotic medication 14.2%
6% worse than North Carolina average

North Carolina average: 13.4%

Pneumococcal Vaccine Info Percent of long-stay residents assessed and appropriately given the pneumococcal vaccine 98.6%
8% better than North Carolina average

North Carolina average: 91.6%

Influenza Vaccine Info Percent of long-stay residents assessed and appropriately given the seasonal influenza vaccine 100.0%
6% better than North Carolina average

North Carolina average: 94.1%

Hospitalizations per 1,000 days Info Number of hospitalizations per 1,000 long-stay resident days. 1.95
10% worse than North Carolina average

North Carolina average: 1.77

ED visits per 1,000 days Info Number of outpatient emergency department visits per 1,000 long-stay resident days. 1.94
7% worse than North Carolina average

North Carolina average: 1.82

Short-stay resident measures
Average North Carolina avg: 2.7 Info CMS star rating based on short-stay quality measure performance. 5 stars = much above average, 1 star = much below average.
Pneumococcal Vaccine Info Percent of short-stay residents assessed and appropriately given the pneumococcal vaccine 86.3%
8% better than North Carolina average

North Carolina average: 79.9%

Antipsychotic medication increase Info Percent of short-stay residents who newly received an antipsychotic medication 6.3%
320% worse than North Carolina average

North Carolina average: 1.5%

Influenza Vaccine Info Percent of short-stay residents assessed and appropriately given the seasonal influenza vaccine 93.3%
20% better than North Carolina average

North Carolina average: 78.1%

Re-hospitalized after SNF stay Info Percentage of short-stay residents who were re-hospitalized after their nursing home admission. 17.8%
22% better than North Carolina average

North Carolina average: 22.9%

Emergency department visits Info Percentage of short-stay residents who had an outpatient emergency department visit. 11.6%
12% better than North Carolina average

North Carolina average: 13.2%

Falls with major injury Info Percentage of SNF residents who experience falls with major injury during their stay. 0.0%
100% better than North Carolina average

North Carolina average: 0.8%

Ability to care for self at discharge Info Percentage of residents at or above expected ability to care for themselves at discharge. 53.8%
In line with North Carolina average

North Carolina average: 53.7%

Successful return to home or community Info Rate of successful return to home or community from a skilled nursing facility. 59.3%
17% better than North Carolina average

North Carolina average: 50.6%

Penalties and fines

Federal penalties imposed by CMS for regulatory violations, including civil money penalties (fines) and denials of payment for new Medicare/Medicaid admissions.

Source: CMS Penalties Database (Data as of Jan 2026)

Total fines amount $78K
In line with North Carolina average

North Carolina average: $76K

Number of fines 3
28% more fines than North Carolina average

North Carolina average: 2.3

Payment Denials Info Serious action where Medicare and/or Medicaid temporarily stops payments for new residents until issues are fixed. 0
100% fewer payment denials than North Carolina average

North Carolina average: 0.4

Fines amount comparison
This facility $78K
North Carolina average $76K
Penalty History

Penalties are imposed by CMS for violations of federal nursing home regulations.

Civil Money Penalty Info Fines imposed for noncompliance, which can be assessed per day or per instance of violation. Oct 12, 2023
$49K
Civil Money Penalty Info Fines imposed for noncompliance, which can be assessed per day or per instance of violation. Jul 18, 2023
$20K
Civil Money Penalty Info Fines imposed for noncompliance, which can be assessed per day or per instance of violation. Mar 22, 2023
$9K

Last updated: Jan 2026

Guides for Better Senior Living

Care Cost Calculator: See Prices in Your Area

Nursing Home Data Explorer

Don’t Wait Too Long: 7 Red Flag Signs Your Parent Needs Assisted Living Now

The True Cost of Assisted Living in 2025 – And How Families Are Paying For It

Understanding Senior Living Costs: Pricing Models, Discounts & Financial Assistance

Financial Aid for North Carolina Seniors

Get financial aid guidance

Community Alternatives Program for Disabled Adults

NC Medicaid CAP/DA

Age 65+ or disabled, North Carolina resident, Medicaid- eligible, nursing home-level care need.

~$2,829/month (300% FBR, individual).

$2,000 (individual), $3,000 (couple).

High demand; waitlists common in urban areas.

North Carolina Senior Care Options

NC SCO (via NFCSP)

Caregiver of someone 60+ (or with dementia), North Carolina resident.

No strict limit; prioritizes low-income.

Not applicable.

Limited slots; rural/urban balance.

Program of All-Inclusive Care for the Elderly (PACE)

North Carolina PACE (e.g., PACE of the Triad)

Age 55+, NC resident (specific counties), NFLOC, safe with PACE support.

~$2,829/month (Medicaid-eligible); private pay option available.

$2,000 (individual), $3,000 (couple) for Medicaid enrollees.

Available in 10+ counties (e.g., Guilford, Wake); multiple providers (e.g., PACE of the Southern Piedmont).

In-Home Aide Services

North Carolina In-Home Aide Services

Age 60+, NC resident, unable to perform 1+ ADL, at risk of nursing home placement.

No strict cap; prioritizes low-income (~$24,980/year).

Not assessed; need-based.

Family can be aides; varies by county funding.

Medicare Savings Program (MSP)

North Carolina Medicare Savings Program

Age 65+ or disabled, NC resident, Medicare Part A/B.

~$2,510/month (QMB), ~$3,380/month (SLMB), ~$3,598/month (QI)—individual.

$9,430 (individual), $14,130 (couple).

Three tiers; no waitlist; includes Extra Help for Part D.

Low-Income Energy Assistance Program (LIHEAP)

North Carolina LIHEAP

Age 60+ prioritized, NC resident, low-income household.

~$3,970/month (individual, 185% FPL).

Not assessed; income-focused.

Covers oil, gas, electric; emergency aid via Crisis Intervention Program (CIP).

Senior Community Service Employment Program (SCSEP)

North Carolina SCSEP

Age 55+, unemployed, low-income, NC resident.

~$1,983/month (125% FPL).

Not specified; income-focused.

Priority for veterans, rural residents; AARP partnership.

VA Aid and Attendance (A&A) and Housebound Benefits

North Carolina VA Aid and Attendance/Housebound

Age 65+ or disabled veteran/spouse, NC resident, wartime service, need for ADL help (A&A) or homebound.

Net income < ~$1,984/month (veteran with dependent, A&A); pension offsets income.

~$155,356 (net worth limit).

High veteran demand in rural/urban areas.

Urgent Repair Program (URP)

North Carolina Urgent Repair Program

Age 60+ prioritized, NC resident, homeowner, low-income.

~$30,258/year (50% AMI, varies by county).

Not strictly assessed; home value considered.

Forgivable at $2,000/year; statewide via local partners.

State/County Special Assistance (SA)

North Carolina Special Assistance

Age 65+ (or disabled), NC resident, in licensed adult care home, low-income.

~$1,255/month (individual, 100% FPL); varies by facility rate.

$2,000 (individual).

Covers assisted living; counties supplement state funds.

Tour Icon
Planning a tour? Check our touring checklist.
Chat Icon
Thinking of living here? We can help you speak to a current resident