


Total health inspections
4
Tennessee average 3.5
Last Health inspection on Sep 2023
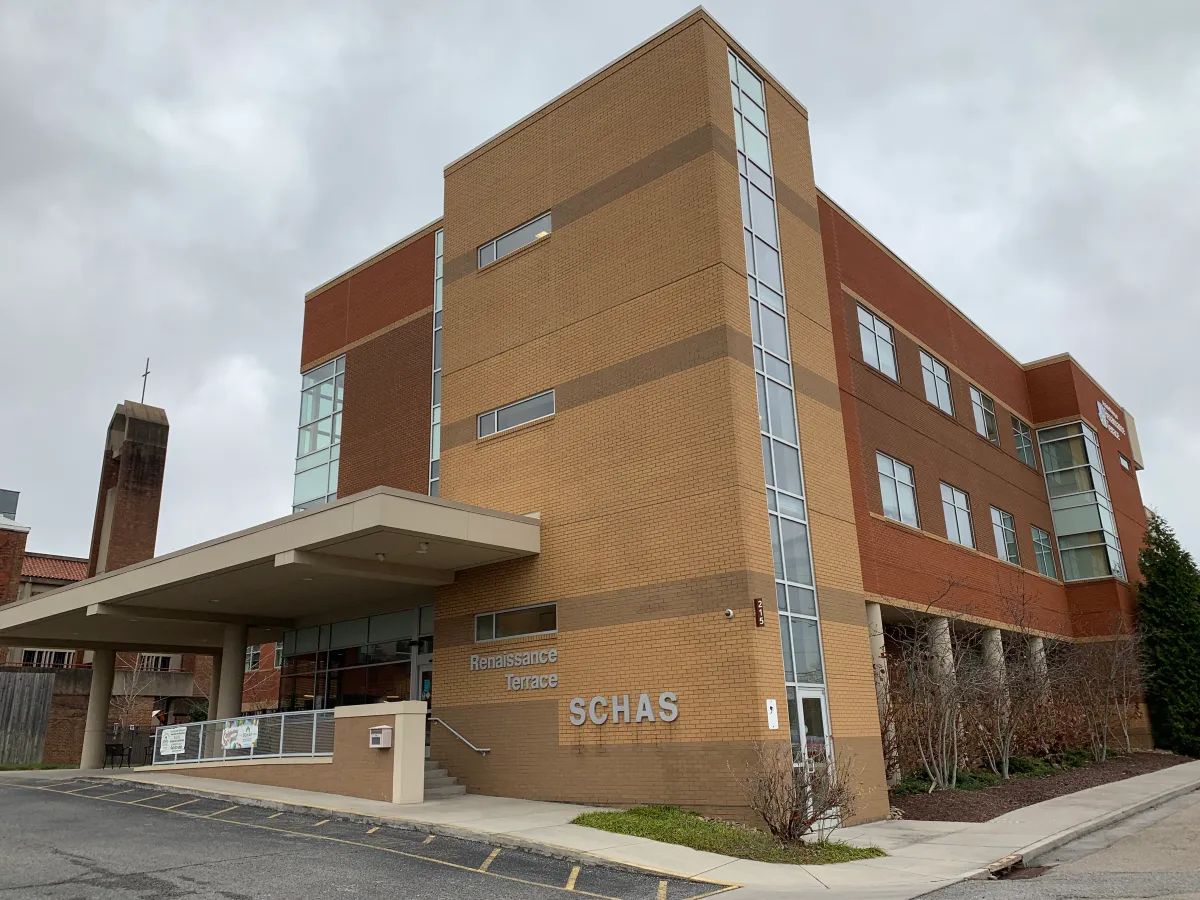
Renaissance Terrace has been part of Knoxville’s senior care landscape for 55 years now, a long run by any standard in this field. The 50-bed nursing home sits on Bearden Pl in a genuinely walkable stretch of the city. A Walk Score of 74 means most errands, a pharmacy trip, a coffee, whatever, don’t require a car at all.
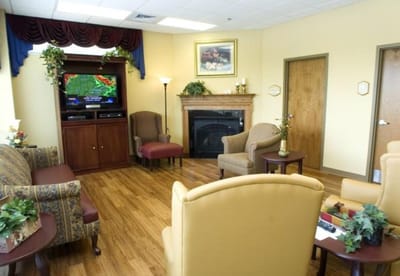
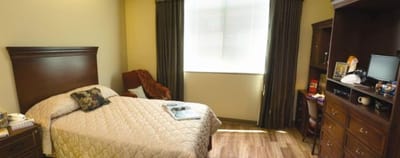
Beyond nursing home care, Renaissance Terrace also covers assisted living, independent living, and memory care, so the building serves a fairly wide range of needs under one roof. It’s a mid-rise with private rooms, which matters if privacy is high on your list. The resident mix here leans toward both ends of the care spectrum: short-term rehab stays after a hospital visit, and long-term residents settling in for the long haul. The average length of stay runs 462 days, well past a year, which tells you long-term care is doing a lot of the work here.
On staffing, nurse aides provide the bulk of hands-on care, clocking in at 2 hours and 7 minutes per resident each day. Add in RN and LPN time, and total nursing care lands around 2 hours and 49 minutes per resident per day. Medicare, Medicaid, and private pay are all accepted, which opens up more than one path for families figuring out how to pay for this.
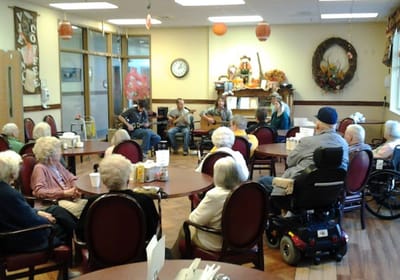
Pets are welcome here, and residents have access to transportation services and a fitness and recreation program, both useful in a location that’s otherwise easy to get around on foot anyway. Senior Citizens Home Assistance Service runs the building, with Katelyn Bray as administrator and Tim Howell as CEO. Taken together, the decades of operation, the long average stay, and the four-care-type range point to a facility built for residents who need somewhere stable to land, not just pass through.
Staffing hours
![]() Daily nursing hours per resident by staff type, reported to CMS. Higher is generally better — compare this facility to state and national averages to see where staffing stands.
Daily nursing hours per resident by staff type, reported to CMS. Higher is generally better — compare this facility to state and national averages to see where staffing stands.
Hours per resident per day vs Tennessee averages
Total nursing care
![]() This home is ranked 169th out of 176 homes in Tennessee for nurse hours. Total adjusted nursing hours per resident per day, combining RN, LPN, and aide time. CMS adjusts this for case-mix so facilities can be fairly compared.
This home is ranked 169th out of 176 homes in Tennessee for nurse hours. Total adjusted nursing hours per resident per day, combining RN, LPN, and aide time. CMS adjusts this for case-mix so facilities can be fairly compared.
2h 49m
22% below state avg5 of 6 metrics below state avg
Renaissance Terrace is legally operated by Senior Citizens Home Assistance Service,, and administered by Katelyn Bray.
Tennessee average 3.5
Last Health inspection on Sep 2023
Tennessee average 15.4
Tennessee average 4.39
Health citations are formal notices following inspections when they fail to comply with safety and care standards.
9 of 27 citations resulted from standard inspections; 1 of 27 resulted from complaint investigations; and 17 of 27 came from combined inspections (standard and complaint).
Tennessee average: 1.1
Tennessee average: 0.6
Reporting period: October 1 – December 31, 2025 (Q4 2025). Source: CMS Payroll-Based Journal report.
Manages medical care and health needs.
Assists with medical care and medications.
Helps with daily care and mobility.
Total hours from contractors
45 contractor hours this quarter
| Certified Nursing Assistant | 24 | 0 | 24 | 8,278 | 92 | 100% | 8.9 |
| Registered Nurse | 8 | 0 | 8 | 1,515 | 92 | 100% | 9 |
| Licensed Practical Nurse | 4 | 0 | 4 | 1,151 | 83 | 90% | 7.9 |
| RN Director of Nursing | 1 | 0 | 1 | 642 | 54 | 59% | 11.9 |
| Dietitian | 1 | 0 | 1 | 487 | 58 | 63% | 8.4 |
| Physical Therapy Assistant | 3 | 0 | 3 | 477 | 63 | 68% | 6.1 |
| Dental Services Staff | 1 | 0 | 1 | 467 | 59 | 64% | 7.9 |
| Administrator | 2 | 0 | 2 | 448 | 56 | 61% | 8 |
| Clinical Nurse Specialist | 1 | 0 | 1 | 356 | 44 | 48% | 8.1 |
| Nurse Practitioner | 1 | 0 | 1 | 228 | 35 | 38% | 6.5 |
| Respiratory Therapy Technician | 2 | 0 | 2 | 117 | 34 | 37% | 3.4 |
| Speech Language Pathologist | 1 | 0 | 1 | 86 | 15 | 16% | 5.7 |
| Physician Assistant | 0 | 1 | 1 | 30 | 14 | 15% | 2.2 |
| Physical Therapy Aide | 1 | 0 | 1 | 16 | 3 | 3% | 5.4 |
| Medical Director | 0 | 1 | 1 | 15 | 10 | 11% | 1.5 |
Federal penalties imposed by CMS for regulatory violations, including civil money penalties (fines) and denials of payment for new Medicare/Medicaid admissions.
Source: CMS Penalties Database (Data as of Jan 2026)
Tennessee average: $86K
Tennessee average: 1.7
Tennessee average: 0.5
No penalties in the past 3 years
No civil money penalties or payment denials were reported in the last 3 years.
These measures show how residents usually do over time at this home, based on health outcomes and preventive care.
Tennessee average: 10.5
Tennessee average: 19.5
Tennessee average: 16.0%
Tennessee average: 21.7%
Tennessee average: 20.7%
Tennessee average: 3.7%
Tennessee average: 5.4%
Tennessee average: 2.1%
Tennessee average: 6.3%
Tennessee average: 11.0%
Tennessee average: 16.5%
Tennessee average: 89.9%
Tennessee average: 94.5%
Tennessee average: 79.7%
Tennessee average: 1.7%
Tennessee average: 79.8%
Quality measures are calculated from Minimum Data Set (MDS) assessments. For most measures, lower percentages indicate better care quality.
31% of new residents, usually for short-term rehab.
58% of new residents, often for short stays.
11% of new residents, often for long-term daily care.
Source: CMS Long-Term Care Facility Characteristics (Data as of Jan 2026)
Residents meet regularly to discuss policies, care quality, and activities
Organized group of residents that meets regularly to discuss facility policies, quality of life, and activities.
Data sourced from CMS Long-Term Care Facility Characteristics quarterly report. Payer mix reflects the current resident census by primary payment source.
Historical financial and operational data for Renaissance Terrace from 2011–2023, based on CMS SNF Cost Reports.
Key figures below are for fiscal year ending in 12/2023.
Based on CMS SNF Cost Report for fiscal year ending in 12/2023.
Pets Allowed
Housing Options: Private Rooms
Building Type: Mid-rise
Transportation Services
Fitness and Recreation
This home supports both short-term rehab and long-term care, with residents staying for a wide range of durations.
Most new residents arrive under private pay (58% of admissions), and a typical private pay stay runs around 3 - 4 months.
Coverage residents most often arrive under.
Coverage residents most often leave under.
![]() 1.3 miles from city center
1.3 miles from city center
![]() Estimated distance in miles from Knoxville's city center to Renaissance Terrace's address, calculated via Google Maps.
Estimated distance in miles from Knoxville's city center to Renaissance Terrace's address, calculated via Google Maps.
Add your location
Info below is compiled from CMS reports & the TN Dept. of Health (TDH), senior community websites & trusted data sources such as Walk Score & BBB.
Communities are listed from highest to lowest based on our ranking methodology.
| Ben Atchley Tennessee State Veterans‘ Home | NH SNF | Knoxville | 140
Facility
140
TN AVG
88
Rank
#47 / 425 |
93.7%
Facility
93.7%
TN AVG
71.5
Rank
#27 / 272 | +31% | 4.83
Facility
4.83
TN AVG
3.63
Rank
#13 / 176 | -10% | +33% | $0
Facility
$0
TN AVG
$90.9k
Rank
#1 / 181 | 5
Facility
5
TN AVG
15.4
Rank
#17 / 180 | 1.7
Facility
1.7
TN AVG
4.4
Rank
#8 / 180 | - | 131 | - |
7
Facility
7
TN AVG
36
Rank
#470 / 520 | State Of Tennessee | $19.5MFiscal year ending 06/2024
Facility
$19.5MFiscal year ending 06/2024
TN AVG
$11.1M
Rank
#12 / 174 | $9.0MFiscal year ending 06/2024
Facility
$9.0MFiscal year ending 06/2024
TN AVG
$5.9M
Rank
#24 / 174 | 46.1%Fiscal year ending 06/2024
Facility
46.1%Fiscal year ending 06/2024
TN AVG
54.1%
Rank
#121 / 174 | 445484 | ||||
| Holston Health And Rehabilitation Center | NH HC HOS PC SNF | Knoxville | 94
Facility
94
TN AVG
88
Rank
#174 / 425 |
81.9%
Facility
81.9%
TN AVG
71.5
Rank
#93 / 272 | +15% | 3.36
Facility
3.36
TN AVG
3.63
Rank
#88 / 176 | -1% | -7% | $0
Facility
$0
TN AVG
$90.9k
Rank
#1 / 181 | 5
Facility
5
TN AVG
15.4
Rank
#17 / 180 | 2.5
Facility
2.5
TN AVG
4.4
Rank
#29 / 180 | - | 77 | - |
2
Facility
2
TN AVG
36
Rank
#507 / 520 | Daniel Mckenzie | $10.2MFiscal year ending 12/2023
Facility
$10.2MFiscal year ending 12/2023
TN AVG
$11.1M
Rank
#77 / 174 | $6.2MFiscal year ending 12/2023
Facility
$6.2MFiscal year ending 12/2023
TN AVG
$5.9M
Rank
#62 / 174 | 61.1%Fiscal year ending 12/2023
Facility
61.1%Fiscal year ending 12/2023
TN AVG
54.1%
Rank
#36 / 174 | 445344 | ||||
| NHC HealthCare, Farragut | NH AL MC SNF | Knoxville | 88
Facility
88
TN AVG
88
Rank
#186 / 425 | - | - | 4.17
Facility
4.17
TN AVG
3.63
Rank
#23 / 176 | +27% | +15% | $0
Facility
$0
TN AVG
$90.9k
Rank
#1 / 181 | 12
Facility
12
TN AVG
15.4
Rank
#72 / 180 | 6.0
Facility
6.0
TN AVG
4.4
Rank
#144 / 180 | - | 91 | - |
24
Facility
24
TN AVG
36
Rank
#358 / 520 | Karla Lane | $16.3MFiscal year ending 12/2023
Facility
$16.3MFiscal year ending 12/2023
TN AVG
$11.1M
Rank
#30 / 174 | $9.6MFiscal year ending 12/2023
Facility
$9.6MFiscal year ending 12/2023
TN AVG
$5.9M
Rank
#19 / 174 | 58.6%Fiscal year ending 12/2023
Facility
58.6%Fiscal year ending 12/2023
TN AVG
54.1%
Rank
#49 / 174 | 445415 | ||||
| Westmoreland Health And Rehabilitation Center | NH HOS PC RC SNF | Westmoreland | 100
Facility
100
TN AVG
88
Rank
#141 / 425 |
81.2%
Facility
81.2%
TN AVG
71.5
Rank
#98 / 272 | +14% | 2.92
Facility
2.92
TN AVG
3.63
Rank
#156 / 176 | -23% | -19% | $0
Facility
$0
TN AVG
$90.9k
Rank
#1 / 181 | 10
Facility
10
TN AVG
15.4
Rank
#57 / 180 | 5.0
Facility
5.0
TN AVG
4.4
Rank
#113 / 180 | - | 81 | - |
19
Facility
19
TN AVG
36
Rank
#386 / 520 | Lashell Spears | $10.2MFiscal year ending 12/2023
Facility
$10.2MFiscal year ending 12/2023
TN AVG
$11.1M
Rank
#76 / 174 | $4.0MFiscal year ending 12/2023
Facility
$4.0MFiscal year ending 12/2023
TN AVG
$5.9M
Rank
#120 / 174 | 38.7%Fiscal year ending 12/2023
Facility
38.7%Fiscal year ending 12/2023
TN AVG
54.1%
Rank
#166 / 174 | 445342 | ||||
| Renaissance Terrace | NH AL IL MC | Knoxville (Fourth & Gill) | 50
Facility
50
TN AVG
88
Rank
#340 / 425 | - | - | 2.82
Facility
2.82
TN AVG
3.63
Rank
#169 / 176 | +75% | -22% | $9.3k
Facility
$9.3k
TN AVG
$90.9k
Rank
#126 / 181 | 27
Facility
27
TN AVG
15.4
Rank
#158 / 180 | 6.8
Facility
6.8
TN AVG
4.4
Rank
#155 / 180 | 1 | 43 | - |
74
Facility
74
TN AVG
36
Rank
#26 / 520 | William Sharpe | $3.7MFiscal year ending 12/2023
Facility
$3.7MFiscal year ending 12/2023
TN AVG
$11.1M
Rank
#172 / 174 | $2.2MFiscal year ending 12/2023
Facility
$2.2MFiscal year ending 12/2023
TN AVG
$5.9M
Rank
#168 / 174 | 59.5%Fiscal year ending 12/2023
Facility
59.5%Fiscal year ending 12/2023
TN AVG
54.1%
Rank
#44 / 174 | 445223 |
Renaissance Terrace is located in Knoxville, Tennessee.
Here are the financial assistance programs available to residents in Tennessee.
Renaissance Terrace is in the Fourth & Gill neighborhood of Knoxville.
Renaissance Terrace is legally operated by Senior Citizens Home Assistance Service,, and administered by Katelyn Bray.
Renaissance Terrace has a walk score of 74. Very walkable. Most errands can be accomplished on foot, and many essentials are within a short walk.
According to TN state health department records, Renaissance Terrace's license number is 00000277.
Renaissance Terrace's occupancy is 29.2%.
Renaissance Terrace has been operating for approximately 56 years, based on available licensing and registration records.
Yes, Renaissance Terrace allows residents to bring their pets.
Care Cost Calculator: See Prices in Your Area
Nursing Home Data Explorer
Don’t Wait Too Long: 7 Red Flag Signs Your Parent Needs Assisted Living Now
The True Cost of Assisted Living in 2025 – And How Families Are Paying For It
Understanding Senior Living Costs: Pricing Models, Discounts & Financial Assistance


