


Total staff
221
Employees
143
Contractors
78
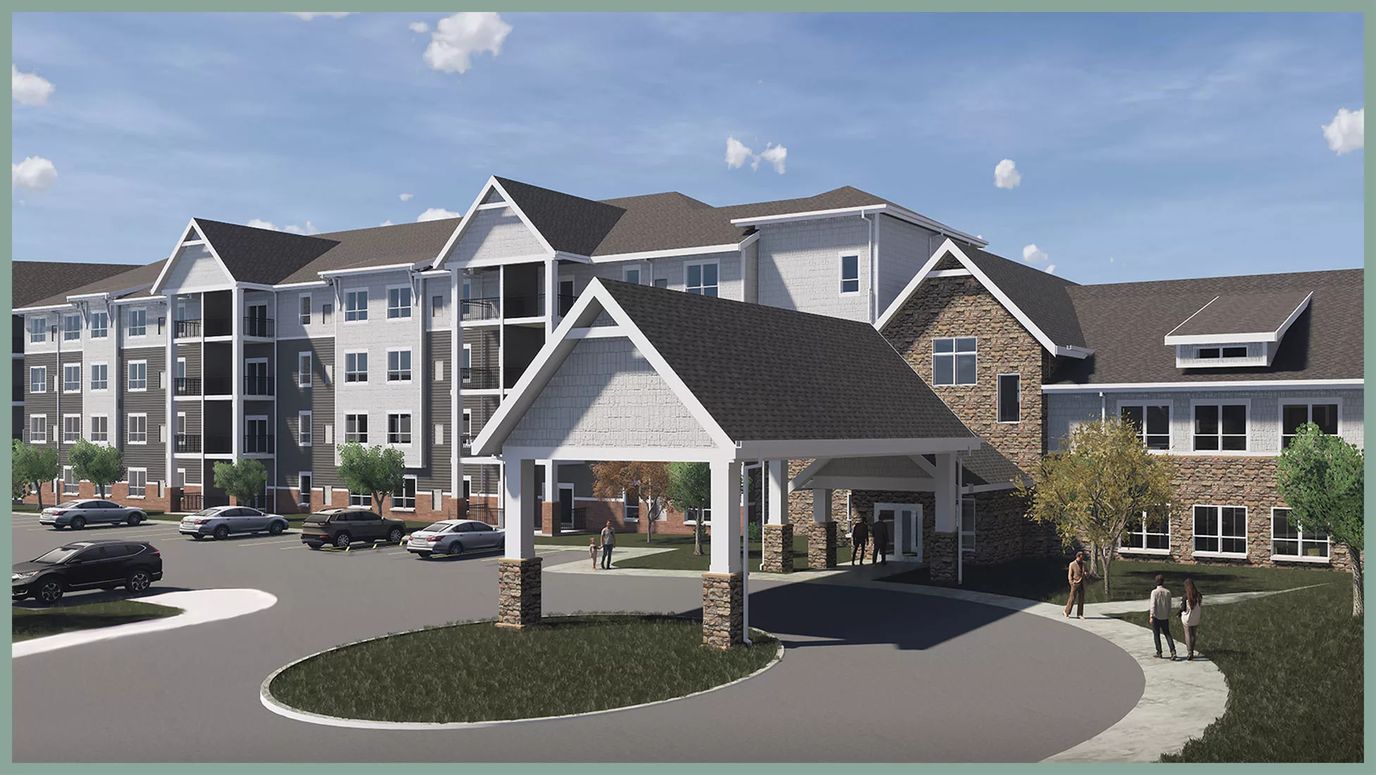
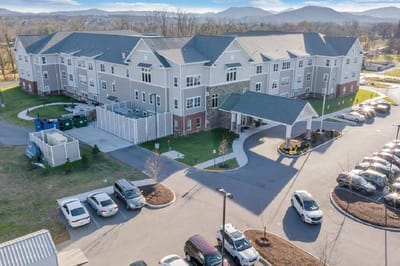
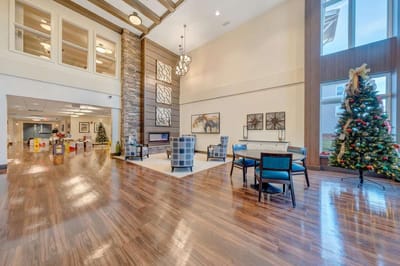

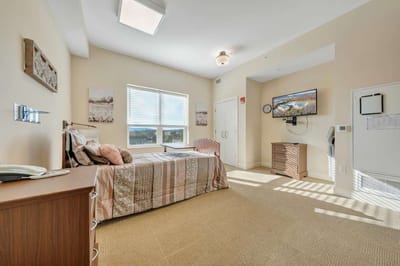
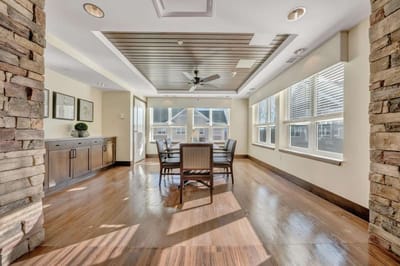
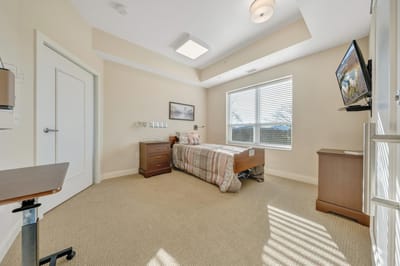
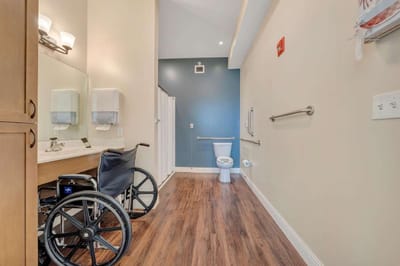
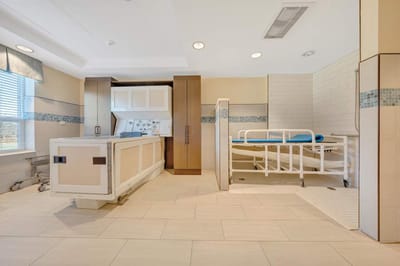


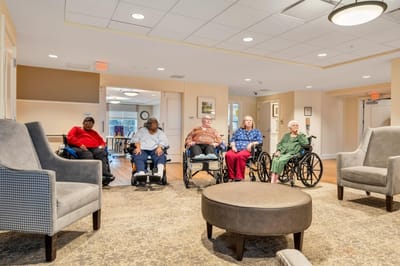
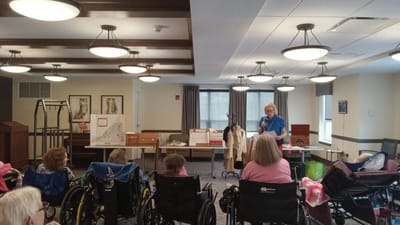


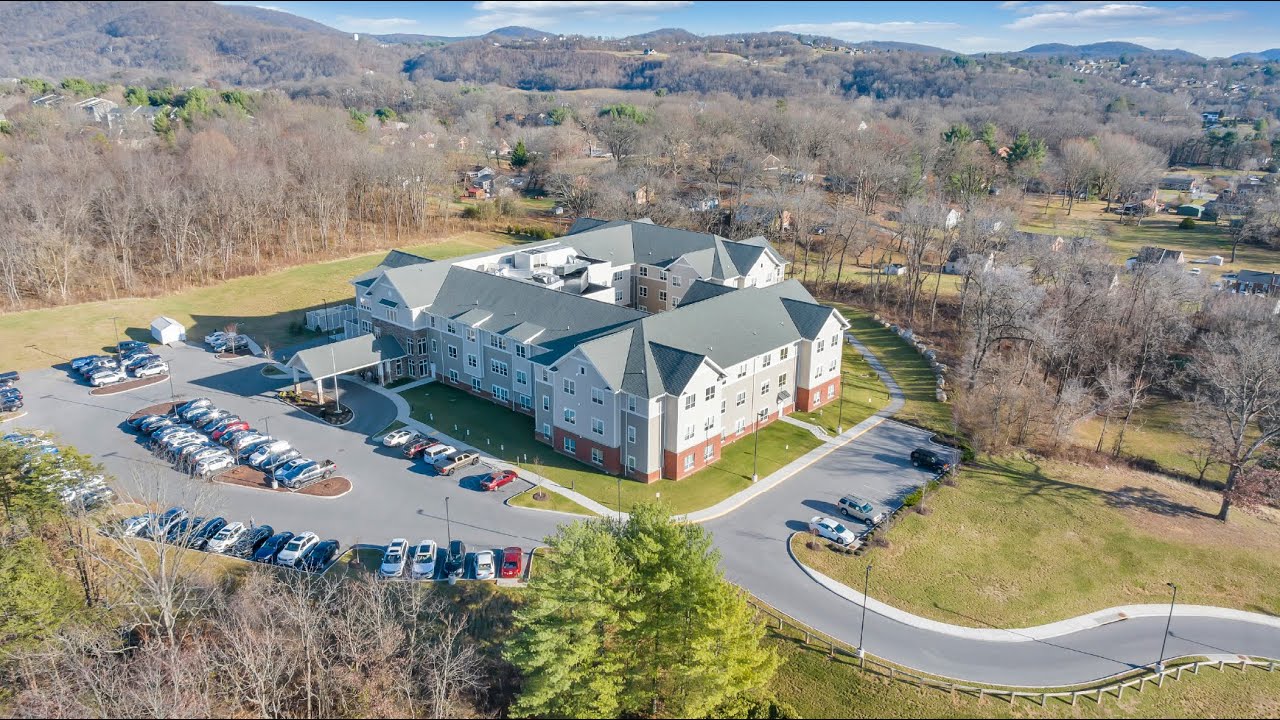
Located on Mecca Street in Roanoke, Virginia, Richfield Living – Roanoke Campus is a nursing home and assisted living community a few miles from the downtown area. Families can choose from Medicare, Medicaid, and private pay to cover care. The community offers both long-term nursing care and short-term rehabilitation. There’s a doctor on staff and 24-hour staffing to support residents around the clock.
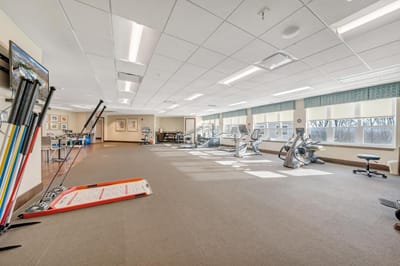
With 116 beds, Richfield is one of the larger nursing homes in the Roanoke area. It has an occupancy rate of about 71%. The average stay is around 71 days, which is a mix of residents recovering from a hospital stay or surgery and those receiving ongoing care. Rehabilitation and respite care are part of the daily offering. Total nurse staffing averages roughly 3 hours and 14 minutes per resident each day. The care team is composed of a registered nurse, a licensed practical nurse, and nurse aide support.
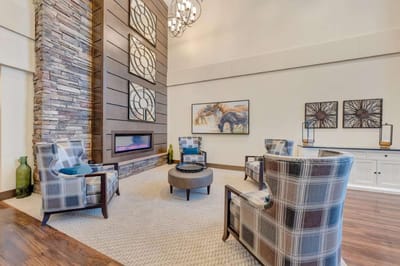
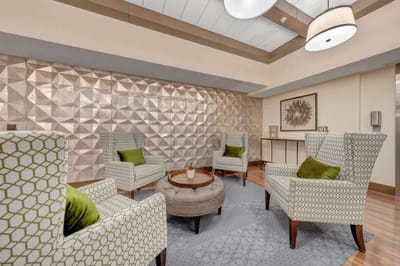
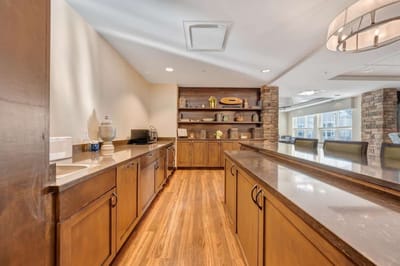
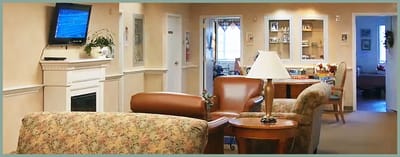
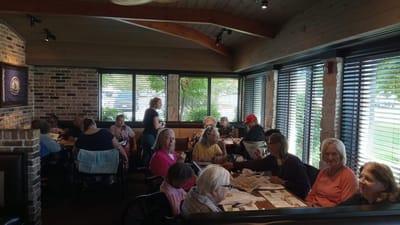
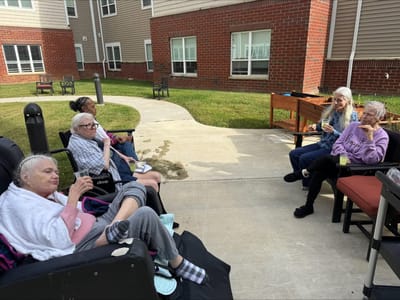
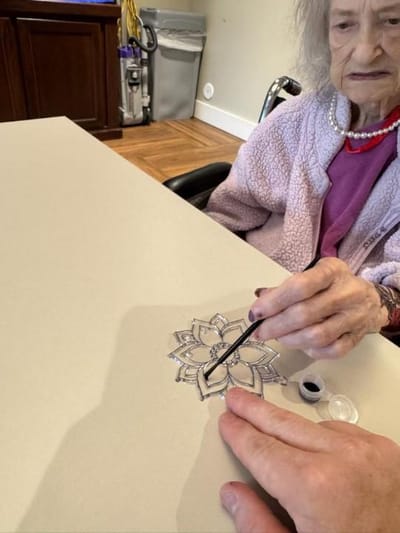
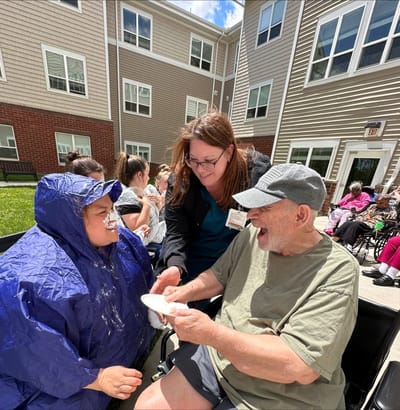
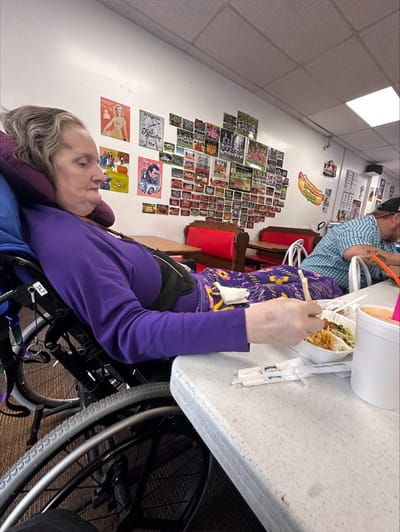
Daily life includes restaurant-style dining, housekeeping, and organized activities. There’s also a gym, on-site transportation, and a wellness program. Nutrition plans are supervised by a registered dietitian, which reassures residents managing specific health or dietary needs. An Active Resident Council meets regularly so residents have a direct voice in the home’s policies and programming.
The surrounding neighborhood is somewhat walkable, so residents and visiting family will likely rely on a car for most errands and outings. Families touring the community should ask how the rehabilitation and respite programs are staffed daily.
| Staff type | Hours / Day / Resident | vs state avg |
|---|---|---|
|
Registered Nurse (RN)
| 11m per day | ▼ 73% State avg: 41m per day · National avg: 41m per day |
|
LPN / LVN
| 1h 18m per day | ▲ 30% State avg: 1h 0m per day · National avg: 52m per day |
|
Nurse Aide
| 2h 13m per day | ▲ 4% State avg: 2h 8m per day · National avg: 2h 21m per day |
|
Weekend Total Nursing
| 3h 26m per day | ▲ 3% State avg: 3h 19m per day · National avg: 3h 26m per day |
|
Physical Therapist
| 8m per day | ▲ 68% State avg: 5m per day · National avg: 4m per day |
|
Weekend RN
| 8m per day | ▼ 72% State avg: 28m per day · National avg: 29m per day |
Reporting period: October 1 – December 31, 2025 (Q4 2025). Source: CMS Payroll-Based Journal report.
Manages medical care and health needs.
Assists with medical care and medications.
Helps with daily care and mobility.
Total hours from contractors
5,880 contractor hours this quarter
| Certified Nursing Assistant | 63 | 49 | 112 | 21,306 | 92 | 100% | 9.5 |
| Licensed Practical Nurse | 24 | 19 | 43 | 10,305 | 92 | 100% | 10 |
| Qualified Activities Professional | 17 | 0 | 17 | 4,866 | 92 | 100% | 9.2 |
| RN Director of Nursing | 10 | 0 | 10 | 2,143 | 86 | 93% | 7.8 |
| Dietitian | 3 | 0 | 3 | 1,442 | 86 | 93% | 7.4 |
| Respiratory Therapy Technician | 4 | 0 | 4 | 1,340 | 70 | 76% | 7.2 |
| Registered Nurse | 1 | 10 | 11 | 1,021 | 81 | 88% | 7.8 |
| Physical Therapy Assistant | 3 | 0 | 3 | 976 | 66 | 72% | 7.5 |
| Speech Language Pathologist | 3 | 0 | 3 | 776 | 61 | 66% | 7.2 |
| Administrator | 1 | 0 | 1 | 559 | 66 | 72% | 8.5 |
| Nurse Practitioner | 2 | 0 | 2 | 427 | 57 | 62% | 7.5 |
| Physical Therapy Aide | 1 | 0 | 1 | 354 | 49 | 53% | 7.2 |
| Clinical Nurse Specialist | 3 | 0 | 3 | 351 | 53 | 58% | 6.5 |
| Mental Health Service Worker | 2 | 0 | 2 | 291 | 39 | 42% | 7.5 |
| Qualified Social Worker | 2 | 0 | 2 | 234 | 31 | 34% | 7.5 |
| Respiratory Therapist | 3 | 0 | 3 | 153 | 10 | 11% | 6.4 |
| Other Activities Staff | 1 | 0 | 1 | 24 | 3 | 3% | 8 |
Federal penalties imposed by CMS for regulatory violations, including civil money penalties (fines) and denials of payment for new Medicare/Medicaid admissions.
Source: CMS Penalties Database
No penalties in the past 3 years
No civil money penalties or payment denials were reported in the last 3 years.
These measures show how residents usually do over time at this home, based on health outcomes and preventive care.
Virginia average: 10.1
Virginia average: 19.7
Virginia average: 16.8%
Virginia average: 19.7%
Virginia average: 22.6%
Virginia average: 3.6%
Virginia average: 5.4%
Virginia average: 1.5%
Virginia average: 5.9%
Virginia average: 14.9%
Virginia average: 12.9%
Virginia average: 91.3%
Virginia average: 94.0%
Virginia average: 1.46
Virginia average: 1.41
Virginia average: 74.9%
Virginia average: 1.2%
Virginia average: 73.6%
Virginia average: 22.0%
Virginia average: 11.7%
Virginia average: 0.8%
Virginia average: 53.7%
Virginia average: 50.6%
Quality measures are calculated from Minimum Data Set (MDS) assessments. For most measures, lower percentages indicate better care quality.
42% of new residents, usually for short-term rehab.
32% of new residents, often for short stays.
26% of new residents, often for long-term daily care.
Source: CMS Long-Term Care Facility Characteristics (Data as of Jan 2026)
Residents meet regularly to discuss policies, care quality, and activities
Organized group of residents that meets regularly to discuss facility policies, quality of life, and activities.
Data sourced from CMS Long-Term Care Facility Characteristics quarterly report. Payer mix reflects the current resident census by primary payment source.
Historical financial and operational data for Richfield Living – Roanoke Campus from 2023, based on CMS SNF Cost Reports.
Key figures below are for fiscal year ending in 09/2023.
Based on CMS SNF Cost Report for fiscal year ending in 09/2023.
Most residents typically stay for a few weeks or months before returning home or moving on.
New residents most often arrive under Medicare (42% of admissions), and a typical Medicare stay runs around 30 days.
Coverage residents most often arrive under.
Coverage residents most often leave under.
![]() 3.6 miles from city center
3.6 miles from city center
![]() Estimated distance in miles from Roanoke's city center to Richfield Living – Roanoke Campus's address, calculated via Google Maps.
Estimated distance in miles from Roanoke's city center to Richfield Living – Roanoke Campus's address, calculated via Google Maps.
Add your location
Info below is compiled from CMS reports & the VA Depts. of Social Services & Health, senior community websites & trusted data sources such as Walk Score & BBB.
Communities are listed from highest to lowest based on our ranking methodology.
| Our Lady of the Valley | AL MC NH RC SNF | Roanoke (Gainsboro) | 127
Facility
127
VA AVG
96
Rank
#76 / 365 |
87.4%
Facility
87.4%
VA AVG
70.5
Rank
#63 / 297 | +24% | 3.79
Facility
3.79
VA AVG
3.74
Rank
#40 / 71 | -42% | +1% | $0
Facility
$0
VA AVG
$54.3k
Rank
#1 / 75 | 14
Facility
14
VA AVG
38.4
Rank
#13 / 70 | 4.7
Facility
4.7
VA AVG
8.9
Rank
#16 / 70 | - | 111 | A+ |
68
Facility
68
VA AVG
44
Rank
#73 / 446 | David Rawlings | $14.8MFiscal year ending 06/2024
Facility
$14.8MFiscal year ending 06/2024
VA AVG
$18.3M
Rank
#46 / 71 | $8.2MFiscal year ending 06/2024
Facility
$8.2MFiscal year ending 06/2024
VA AVG
$6.9M
Rank
#44 / 71 | 55.5%Fiscal year ending 06/2024
Facility
55.5%Fiscal year ending 06/2024
VA AVG
39.7%
Rank
#29 / 71 | 495357 | ||||
| Brandon Oaks Nursing and Rehabilitation Center | AL HC IL MC NH SNF | Roanoke (Westland) | 43
Facility
43
VA AVG
96
Rank
#313 / 365 |
53.5%
Facility
53.5%
VA AVG
70.5
Rank
#240 / 297 | -24% | 5.33
Facility
5.33
VA AVG
3.74
Rank
#14 / 71 | +28% | +42% | $0
Facility
$0
VA AVG
$54.3k
Rank
#1 / 75 | 12
Facility
12
VA AVG
38.4
Rank
#8 / 70 | 4.0
Facility
4.0
VA AVG
8.9
Rank
#9 / 70 | - | 23 | - |
33
Facility
33
VA AVG
44
Rank
#281 / 446 | Heather Neff | $7.2MFiscal year ending 12/2023
Facility
$7.2MFiscal year ending 12/2023
VA AVG
$18.3M
Rank
#27 / 71 | $7.0MFiscal year ending 12/2023
Facility
$7.0MFiscal year ending 12/2023
VA AVG
$6.9M
Rank
#49 / 71 | 96.3%Fiscal year ending 12/2023
Facility
96.3%Fiscal year ending 12/2023
VA AVG
39.7%
Rank
#68 / 71 | 495373 | ||||
| Friendship Retirement Community | AL IL MC NH RC SNF | Roanoke (Hollins) | 253
Facility
253
VA AVG
96
Rank
#5 / 365 |
91.2%
Facility
91.2%
VA AVG
70.5
Rank
#42 / 297 | +29% | 4.46
Facility
4.46
VA AVG
3.74
Rank
#31 / 71 | +4% | +19% | $0
Facility
$0
VA AVG
$54.3k
Rank
#1 / 75 | 18
Facility
18
VA AVG
38.4
Rank
#25 / 70 | 4.5
Facility
4.5
VA AVG
8.9
Rank
#15 / 70 | - | 231 | A+ |
48
Facility
48
VA AVG
44
Rank
#185 / 446 | Friendship Foundation Inc | $29.8MFiscal year ending 06/2024
Facility
$29.8MFiscal year ending 06/2024
VA AVG
$18.3M
Rank
#18 / 71 | $15.3MFiscal year ending 06/2024
Facility
$15.3MFiscal year ending 06/2024
VA AVG
$6.9M
Rank
#18 / 71 | 51.5%Fiscal year ending 06/2024
Facility
51.5%Fiscal year ending 06/2024
VA AVG
39.7%
Rank
#42 / 71 | 495092 | ||||
| Richfield Living – Roanoke Campus | AL NH | Roanoke (Arrington Court) | 116
Facility
116
VA AVG
96
Rank
#99 / 365 |
89.9%
Facility
89.9%
VA AVG
70.5
Rank
#44 / 297 | +28% | 3.24
Facility
3.24
VA AVG
3.74
Rank
#57 / 71 | -48% | -14% | $0
Facility
$0
VA AVG
$54.3k
Rank
#1 / 75 | 16
Facility
16
VA AVG
38.4
Rank
#20 / 70 | 8.0
Facility
8.0
VA AVG
8.9
Rank
#39 / 70 | - | 104 | - |
32
Facility
32
VA AVG
44
Rank
#288 / 446 | - | $11.0MFiscal year ending 09/2023
Facility
$11.0MFiscal year ending 09/2023
VA AVG
$18.3M
Rank
#54 / 71 | $5.9MFiscal year ending 09/2023
Facility
$5.9MFiscal year ending 09/2023
VA AVG
$6.9M
Rank
#58 / 71 | 53.7%Fiscal year ending 09/2023
Facility
53.7%Fiscal year ending 09/2023
VA AVG
39.7%
Rank
#34 / 71 | 495427 |
Richfield Living – Roanoke Campus is located in Roanoke, Virginia.
Here are the financial assistance programs available to residents in Virginia.
Richfield Living – Roanoke Campus is in the Arrington Court neighborhood.
Richfield Living – Roanoke Campus has a walk score of 32. Somewhat walkable. A few nearby services may be reachable on foot, but most trips require transportation.
Richfield Living – Roanoke Campus's occupancy is 70.6%.
No, Richfield Living – Roanoke Campus has a no-pet policy.
Richfield Living – Roanoke Campus is registered as a for-profit.
Yes — there are 75 photos of Richfield Living – Roanoke Campus in the photo gallery on this page.
Richfield Living – Roanoke Campus is located at 1047 Mecca St Ne, Roanoke, VA 24012.
Care Cost Calculator: See Prices in Your Area
Nursing Home Data Explorer
Don’t Wait Too Long: 7 Red Flag Signs Your Parent Needs Assisted Living Now
The True Cost of Assisted Living in 2025 – And How Families Are Paying For It
Understanding Senior Living Costs: Pricing Models, Discounts & Financial Assistance


