Friendship Retirement Community
Nursing Home, Assisted Living, Independent Living, Memory Care & Respite Care · Roanoke, VA
CMS overall rating Info CMS (the Centers for Medicare & Medicaid Services) is the federal agency that rates nursing home quality. Its Overall Rating runs from 1 to 5 stars, combining health inspections, staffing, and quality measures, with inspections weighted most heavily.

Friendship Retirement Community

Nursing Home, Assisted Living, Independent Living, Memory Care & Respite Care · Roanoke, VA
CMS overall rating Info CMS (the Centers for Medicare & Medicaid Services) is the federal agency that rates nursing home quality. Its Overall Rating runs from 1 to 5 stars, combining health inspections, staffing, and quality measures, with inspections weighted most heavily.
Calculator: See prices in your area
Friendship Retirement Community accepts Medicare, Medicaid, and private pay.

Overview of Friendship Retirement Community

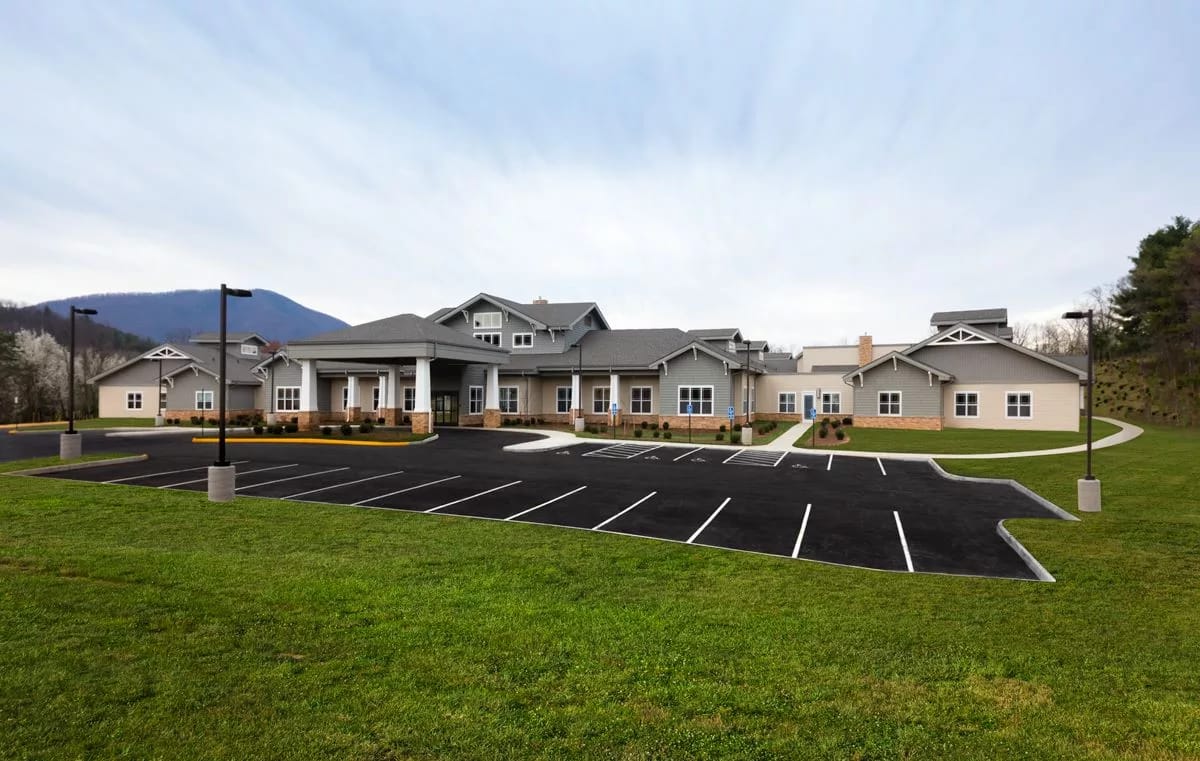
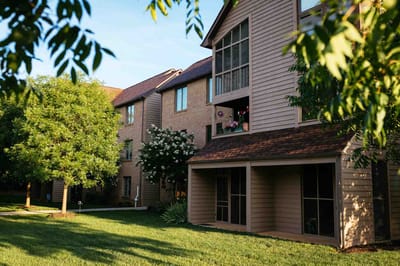
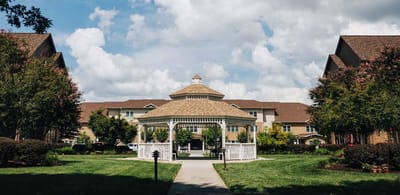
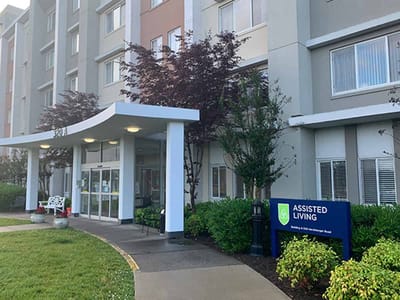
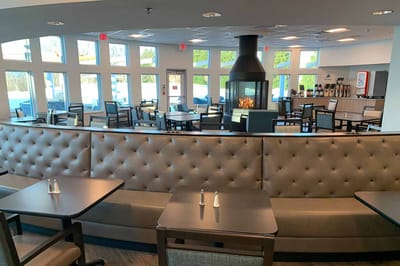
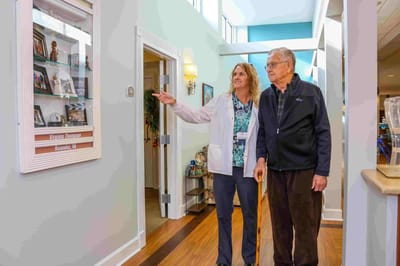
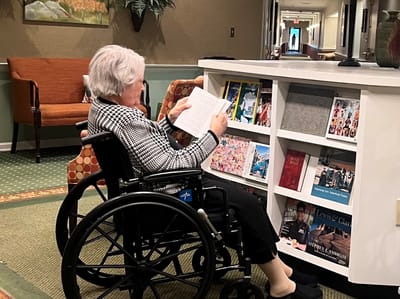
Friendship Retirement Community undoubtedly provides the highest quality of care for seniors of Roanoke; they are one of the city’s most trusted retirement communities because of the essential service offered: friendship. As its name suggests, management makes it a point that seniors are encouraged to find the opportunity to discover long-lasting companies that help make the aging experience a little less daunting.

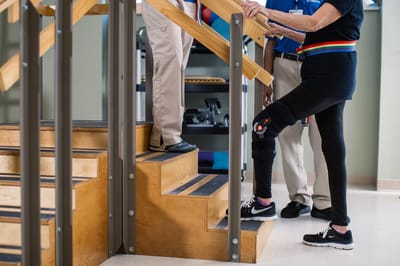
Offering senior independent living, assisted living, memory care, and nursing care services, the staff is committed to delivering resort-style services with respect and dignity. Many will find an enhanced day-to-day living experience beneficial to health and wellness, recovery journey, and individual growth; life enrichment programs, social activities, specialized therapy programs, and ADLs support these.

Quality ratings

Measured by Centers for Medicare & Medicaid Services (CMS)

Overall rating Info The Overall CMS Rating combines results from health inspections, staffing levels and quality measures. Health inspections carry the most weight. Staffing and quality scores can increase or decrease the final rating based on performance compared to state and national standards.
▲ 33.0% Above VA avg. ▲ 33.0% Above VA avg.VA average: 3.0Click the badge to see the full State ranking.Click here to see the full State ranking.
Health Inspection Info Based on the results of the facility's three most recent standard inspections and any complaint investigations. CMS reviews the number, scope, and severity of deficiencies, with more recent findings weighted more heavily.
▲ 44.1% Above VA avg. ▲ 44.1% Above VA avg.VA average: 2.8Click the badge to see the full State ranking.Click here to see the full State ranking.
Staffing Info Measures average nursing staff hours per resident per day, including Registered Nurses (RNs) and total nursing staff. Ratings are adjusted based on the level of care residents require and are compared to state and national benchmarks.
▲ 21.5% Above VA avg. ▲ 21.5% Above VA avg.VA average: 2.5Click the badge to see the full State ranking.Click here to see the full State ranking.
Quality Measures Info Based on clinical and physical health indicators reported to CMS, such as hospital readmissions, falls, pressure ulcers, and improvements in mobility. These measures reflect how well residents' health needs are being managed.
▲ 3.9% Above VA avg. ▲ 3.9% Above VA avg.VA average: 3.8Click the badge to see the full State ranking.Click here to see the full State ranking.

Staffing hours breakdown

Info Daily nursing hours per resident by staff type, reported to CMS. Higher is generally better — compare this facility to state and national averages to see where staffing stands.

Hours per resident per day — compared to Virginia state averages

Total nursing care / resident Info This home is ranked 33rd out of 89 homes in Virginia for nurse hours. Total adjusted nursing hours per resident per day, combining RN, LPN, and aide time. CMS adjusts this for case-mix so facilities can be fairly compared.
4h 28m per day
Rank #33 / 89Nurse hours — State benchmarkedThis home is ranked 33rd out of 89 homes in Virginia. Shows adjusted nurse hours per resident per day benchmarked to the Virginia average, with a ranking across 89 Virginia facilities. More hours mean more direct care. The national average is about 3.5 hrs; below 3.0 is a red flag.Rankings are based only on facilities in Virginia that report data for that category. Facilities without available data are excluded from the ranking.Click the rank badge to see the full State ranking.Click here to see the full State ranking.
This facility Virginia avg (3h 45m per day)
vs Virginia avg
+19%

4 of 6 metrics below state avg

Standout metric LPN / LVN is +19% above state avg
Staff typeHours / Day / Residentvs state avg
Registered Nurse (RN) Info RNs hold the highest nursing license and can assess residents, interpret test results, and direct care plans. More RN hours per day often signals stronger clinical oversight and faster response to health changes. 28m per day ▼ 30% State avg: 40m per day · National avg: 41m per day
LPN / LVN Info Licensed Practical Nurses (LPNs) or Licensed Vocational Nurses (LVNs) deliver routine hands-on care — medication administration, wound dressing, and monitoring vital signs. They work under RN supervision and make up a large share of daily bedside care. 1h 11m per day ▲ 19% State avg: 1h 0m per day · National avg: 52m per day
Nurse Aide Info Certified Nurse Aides (CNAs) provide the most direct day-to-day assistance: bathing, dressing, feeding, and mobility. Nurse aide hours are typically the largest staffing category and directly affect residents' quality of life. 2h 5m per day ■ Avg State avg: 2h 6m per day · National avg: 2h 20m per day
Weekend Total Nursing Info Combined nursing hours (RN + LPN + Nurse Aide) per resident per day on weekends. Staffing often drops on weekends — this figure reveals whether the facility maintains adequate coverage outside of weekday hours. 3h 4m per day ▼ 9% State avg: 3h 21m per day · National avg: 3h 27m per day
Physical Therapist Info Hours per resident per day provided by licensed Physical Therapists (PTs) or PT Assistants. PT services help residents recover mobility after injury or illness and are especially important for post-acute (short-stay) rehabilitation. 4m per day ▼ 25% State avg: 5m per day · National avg: 4m per day
Weekend RN Info Registered nurse hours specifically on weekends. Facilities sometimes reduce RN presence on Saturdays and Sundays — a low weekend RN figure compared to weekday hours can indicate reduced clinical oversight when most administrative staff are absent. 19m per day ▼ 29% State avg: 27m per day · National avg: 29m per day

Capacity and availability

This home usually has limited availability

Higher occupancy than the Virginia average: 85.7%
Occupancy rate
93.1% Rank #27 / 314Occupancy rate — State benchmarkedThis home is ranked 27th out of 314 homes in Virginia. Shows this facility's occupancy rate versus the Virginia average, with its Statewide rank out of 314. Higher occupancy signals strong local demand and financial stability.Rankings are based only on facilities in Virginia that report data for that category. Facilities without available data are excluded from the ranking.Click the rank badge to see the full State ranking.Click here to see the full State ranking.
Avg. Length of Stay
112 days
Bed community size
253-bed community Rank #5 / 371Bed count — State benchmarkedThis home is ranked 5th out of 371 homes in Virginia. Shows this facility's certified or reported bed count compared to other Virginia facilities. Larger communities may offer more amenities, programs, and on-site services for residents and families.Rankings are based only on facilities in Virginia that report data for that category. Facilities without available data are excluded from the ranking.Click the rank badge to see the full State ranking.Click here to see the full State ranking.
A large-scale community that may provide a wide range of amenities, services, and structured programs.
Walk Score
Walk Score: 48 / 100 Rank #186 / 449Walk Score — State benchmarkedThis home is ranked 186th out of 449 homes in Virginia. Shows how walkable this facility's neighborhood is compared to the average Walk Score across Virginia facilities. Higher scores benefit residents, families, and staff.Rankings are based only on facilities in Virginia that report data for that category. Facilities without available data are excluded from the ranking.Click the rank badge to see the full State ranking.Click here to see the full State ranking.
Somewhat walkable. A few nearby services may be reachable on foot, but most trips require transportation.
BBB Rating
BBB Rating: A+ (Accredited)
An independent rating from the Better Business Bureau based on factors such as complaint history, transparency, and business practices.
How BBB ratings work

About this community

Awards

Best Rehab/Post-op Facility
Best Physical Therapy Practice

Safety & Compliance

Secured Perimeter
Emergency SystemsYes

Staffing

Key information about the people who lead and staff this community.

Leadership

ContactMr. C. Michael Shannon, Chief Financial Officer

Therapy & Rehabilitation

2 services
Rehabilitation Services
Respite Care

Additional Services

1 service
Home Care

Additional Policies & Features

HousekeepingYes
Linen ServiceYes
Utilities IncludedYes

Amenities & Lifestyle

Fitness Center
Gym
Library
Salon
Barber
Spa
Chapel
Dining Room
Restaurant
Bistro
Cafe
Courtyard
Garden
Patio
Movie Theater
Transportation
Concierge
24-Hour Security
Wifi
Housekeeping
Laundry
Specific ProgramsNorth Campus, Adult Medical Day Care, Richfield Living, Salem Terrace, Health & Memory Care, Health & Rehab South, Richfield, Health & Rehab, Skilled Nursing & Inpatient Rehab, Outpatient Care, Physical/Occupational/Speech Therapy, Physicians Clinic, Counseling Services
Religious Services
Volunteer Program

Pricing & Financial Information

Starting Price$1,709 per month

Contact Friendship Retirement Community

Health Inspection History

Inspections since 2021
Total health inspections 4

Virginia average 4.2


Last Health inspection on Oct 2024

Total health citations
18 Rank #29 / 90Health citations — State benchmarkedThis home is ranked 29th out of 90 homes in Virginia. Shows this facility's total health deficiency citations benchmarked to the Virginia State average, with a ranking across all 90 VA facilities. Lower citation counts earn a better rank.Rankings are based only on facilities in Virginia that report data for that category. Facilities without available data are excluded from the ranking.Click the rank badge to see the full State ranking.Click here to see the full State ranking.

Virginia average 38.4

Citations per inspection
4.5 Rank #18 / 90Citations per inspection — State benchmarkedThis home is ranked 18th out of 90 homes in Virginia. Shows average deficiency citations per CMS inspection for this facility versus the Virginia mean across 90 facilities with citation data. Lower is better.Rankings are based only on facilities in Virginia that report data for that category. Facilities without available data are excluded from the ranking.Click the rank badge to see the full State ranking.Click here to see the full State ranking.

Virginia average 8.93


Health citations are formal notices following inspections when they fail to comply with safety and care standards.

17 of 18 citations resulted from standard inspections; and 1 of 18 resulted from complaint investigations.

Breakdown of citation severity (last 5 years)
Critical health citations
0
100% better than Virginia average

Virginia average: 0.4


Serious health citations
0
100% better than Virginia average

Virginia average: 1

0 critical citations Virginia average: 0.4

0 serious citations Virginia average: 1

18 moderate citations Virginia average: 36.3

0 minor citations Virginia average: 0.8
Citations history (last 5 years)
Administration moderate citation Oct 29, 2024
Corrected

Quality of Care moderate citation Oct 29, 2024
Corrected

Quality of Care moderate citation Oct 29, 2024
Corrected

Care Planning moderate citation Oct 29, 2024
Corrected

Staffing Data

Reporting period: October 1 – December 31, 2025 (Q4 2025). Source: CMS Payroll-Based Journal report.

Total staff 429
Employees 310
Contractors 119
Staff to resident ratio 1.92 : 1
15% more staff per resident than Virginia average
Virginia average ratio: 1.67 : 1 Virginia average ratio: 1.67 : 1See full Virginia ranking
Avg staff/day 134
Average shift 7.7 hours
0% compared with Virginia average
Virginia average: 8 hours Virginia average shift: 8 hoursSee full Virginia ranking
Total staff hours (quarter) 94,738

Nursing staff breakdown

Q4 2025 · Oct 1 – Dec 31 More info This data comes from the CMS Payroll-Based Journal report covering October 1 – December 31, 2025.
Registered Nurse

Manages medical care and health needs.

RN Staff Info 43 total: 21 full-time employees and 22 contractors. 43
Average shift length Info Average shift length. Calculated as total hours divided by days worked and average staff per day. 7.3 hours
Licensed Practical Nurse

Assists with medical care and medications.

LPN Staff Info 85 total: 48 full-time employees and 37 contractors. 85
Average shift length Info Average shift length. Calculated as total hours divided by days worked and average staff per day. 8.4 hours
Certified Nursing Assistant

Helps with daily care and mobility.

CNA Staff Info 201 total: 143 full-time employees and 58 contractors. 201
Average shift length Info Average shift length. Calculated as total hours divided by days worked and average staff per day. 8 hours

Contractor staffing

Q4 2025 · Oct 1 – Dec 31 More info This data comes from the CMS Payroll-Based Journal report covering October 1 – December 31, 2025.

Total hours from contractors

7.8%

7,435 contractor hours this quarter

Certified Nursing Assistant: 58 Licensed Practical Nurse: 37 Registered Nurse: 22 Medical Director: 1 Occupational Therapy Assistant: 1

Staff by category

Q4 2025 · Oct 1 – Dec 31 More info This data comes from the CMS Payroll-Based Journal report covering October 1 – December 31, 2025.
Certified Nursing Assistant1435820141,18092100%8
Licensed Practical Nurse48378520,24592100%8.4
Registered Nurse2122435,13792100%7.3
RN Director of Nursing120124,94192100%7.5
Clinical Nurse Specialist140144,22992100%4.9
Nurse Aide in Training140143,0899098%8.4
Speech Language Pathologist110112,9489098%7.4
Other Dietary Services Staff5052,1479098%7.8
Physical Therapy Aide9092,1238693%7.3
Mental Health Service Worker4041,9286470%8
Respiratory Therapy Technician110111,3467885%5.6
Administrator2029686672%8
Occupational Therapy Aide3039686470%8
Qualified Social Worker4049206773%7.1
Physical Therapy Assistant3039077683%7.3
Nurse Practitioner1014966267%8
Dietitian1014806065%8
Feeding Assistant2022601314%10
Qualified Activities Professional1011986672%3
Occupational Therapy Assistant011941314%7.2
Other Physician101721213%6
Medical Director011651314%5
201 Certified Nursing Assistant
% of Days 100%
85 Licensed Practical Nurse
% of Days 100%
43 Registered Nurse
% of Days 100%
12 RN Director of Nursing
% of Days 100%
14 Clinical Nurse Specialist
% of Days 100%
14 Nurse Aide in Training
% of Days 98%
11 Speech Language Pathologist
% of Days 98%
5 Other Dietary Services Staff
% of Days 98%
9 Physical Therapy Aide
% of Days 93%
4 Mental Health Service Worker
% of Days 70%
11 Respiratory Therapy Technician
% of Days 85%
2 Administrator
% of Days 72%
3 Occupational Therapy Aide
% of Days 70%
4 Qualified Social Worker
% of Days 73%
3 Physical Therapy Assistant
% of Days 83%
1 Nurse Practitioner
% of Days 67%
1 Dietitian
% of Days 65%
2 Feeding Assistant
% of Days 14%
1 Qualified Activities Professional
% of Days 72%
1 Occupational Therapy Assistant
% of Days 14%
1 Other Physician
% of Days 13%
1 Medical Director
% of Days 14%

Penalties and fines

Federal penalties imposed by CMS for regulatory violations, including civil money penalties (fines) and denials of payment for new Medicare/Medicaid admissions.

Source: CMS Penalties Database

No penalties in the past 3 years

No civil money penalties or payment denials were reported in the last 3 years.

Quality of care over time

These measures show how residents usually do over time at this home, based on health outcomes and preventive care.

High-risk clinical events score Info A composite score based on pressure ulcers, falls with injury, weight loss, walking ability decline, and activities of daily living decline. 11.1
9% worse than Virginia average

Virginia average: 10.1

Functional decline score Info A composite score based on activities of daily living decline, walking ability decline, and incontinence. 20.6
In line with Virginia average

Virginia average: 19.7

Long-stay resident measures
Need for Help with Daily Activities Increased Info Percent of long-stay residents whose need for help with daily activities has increased 16.5%
In line with Virginia average

Virginia average: 16.8%

Walking Ability Worsened Info Percent of long-stay residents whose ability to move independently worsened 20.7%
5% worse than Virginia average

Virginia average: 19.7%

Low Risk Residents with Bowel/Bladder Incontinence Info Percent of low risk long-stay residents who lose control of their bowels or bladder 24.5%
8% worse than Virginia average

Virginia average: 22.6%

Falls with Major Injury Info Percent of long-stay residents experiencing one or more falls with major injury 5.4%
50% worse than Virginia average

Virginia average: 3.6%

High Risk Residents with Pressure Ulcers Info Percent of long-stay high risk residents with pressure ulcers 6.1%
14% worse than Virginia average

Virginia average: 5.4%

Urinary Tract Infection Info Percent of long-stay residents with a urinary tract infection 1.2%
22% better than Virginia average

Virginia average: 1.5%

Lost Too Much Weight Info Percent of long-stay residents who lose too much weight 6.8%
16% worse than Virginia average

Virginia average: 5.9%

Depressive Symptoms Info Percent of long-stay residents who have depressive symptoms 2.1%
86% better than Virginia average

Virginia average: 14.9%

Antipsychotic Use Info Percent of long-stay residents who received an antipsychotic medication 21.6%
68% worse than Virginia average

Virginia average: 12.9%

Pneumococcal Vaccine Info Percent of long-stay residents assessed and appropriately given the pneumococcal vaccine 91.5%
In line with Virginia average

Virginia average: 91.3%

Influenza Vaccine Info Percent of long-stay residents assessed and appropriately given the seasonal influenza vaccine 93.0%
In line with Virginia average

Virginia average: 94.0%

Short-stay resident measures
Pneumococcal Vaccine Info Percent of short-stay residents assessed and appropriately given the pneumococcal vaccine 91.2%
22% better than Virginia average

Virginia average: 74.9%

Antipsychotic medication increase Info Percent of short-stay residents who newly received an antipsychotic medication 0.6%
47% better than Virginia average

Virginia average: 1.2%

Influenza Vaccine Info Percent of short-stay residents assessed and appropriately given the seasonal influenza vaccine 86.2%
17% better than Virginia average

Virginia average: 73.6%

Breakdown by payment type

Medicare

34% of new residents, usually for short-term rehab.

Typical stay 28 days

Private pay

53% of new residents, often for short stays.

Typical stay 1 - 2 months

Medicaid

13% of new residents, often for long-term daily care.

Typical stay 1 - 2 years

Facility Characteristics

Source: CMS Long-Term Care Facility Characteristics (Data as of Jan 2026)

Total residents 224
Medicare
30
13.4% of residents
Medicaid
157
70.1% of residents
Private pay or other
37
16.5% of residents
Programs & Services
Residents Group

Residents meet regularly to discuss policies, care quality, and activities

Active Resident Council

Organized group of residents that meets regularly to discuss facility policies, quality of life, and activities.

Finances and operations

Based on CMS SNF Cost Report for fiscal year ending in 06/2024.

Nonprofit
Nonprofit Corporation
Net patient revenue Info Net patient revenue — what the home actually collects for resident care, after contractual allowances, bad debt and discounts are subtracted from its gross charges (CMS cost report, Worksheet G-3). It covers resident care only; money the home earns from other sources is shown separately as "Other income."
$29.8M
Net patient income Info Net patient income: net patient revenue minus the home's total operating expenses. A positive figure means it earns more from resident care than it spends to deliver it; a negative figure means the opposite. It excludes non-operating "other income."
$3.1M
Nonprofit Nonprofit Corporation
Net patient revenue Info Net patient revenue — what the home actually collects for resident care, after contractual allowances, bad debt and discounts are subtracted from its gross charges (CMS cost report, Worksheet G-3). It covers resident care only; money the home earns from other sources is shown separately as "Other income."
$29.8M Rank #20 / 89Revenue — State benchmarkedThis home is ranked 20th out of 89 homes in Virginia. Shows this facility's annual revenue compared to the Virginia average. Higher revenue generally means more resources for staffing and capital — read alongside Payroll %.Rankings are based only on facilities in Virginia that report data for that category. Facilities without available data are excluded from the ranking.Click the rank badge to see the full State ranking.Click here to see the full State ranking.
Net patient income Info Net patient income: net patient revenue minus the home's total operating expenses. A positive figure means it earns more from resident care than it spends to deliver it; a negative figure means the opposite. It excludes non-operating "other income."
$3.1M
Other income Info Money the home earns outside of resident care — such as investments, grants, rentals and other non-operating sources (CMS cost report, Worksheet G-3). It is tracked separately from net patient revenue: it is not part of that figure, and it is not included in net patient income.
$1.9M
Payroll costs Info Staff salaries plus wage-related costs — benefits such as payroll taxes, health insurance and retirement — from the home's own accounting records (CMS cost report, Worksheet A). Contract or agency labor is counted separately, under other operating costs. Rank #22 / 89Payroll — State benchmarkedThis home is ranked 22nd out of 89 homes in Virginia. Shows total annual staff payroll benchmarked to the Virginia average. Higher payroll investment relative to peers often signals better staffing and less reliance on cheaper contract labor.Rankings are based only on facilities in Virginia that report data for that category. Facilities without available data are excluded from the ranking.Click the rank badge to see the full State ranking.Click here to see the full State ranking.
$15.3M 51.5% of net patient revenue Info Payroll as a share of revenue: staff salaries and wage-related benefits divided by net patient revenue. A higher figure means more of each revenue dollar goes to staff pay. Rank #55 / 89Payroll % — State benchmarkedThis home is ranked 55th out of 89 homes in Virginia. Shows payroll as a percentage of revenue versus the Virginia average. Well-run Virginia facilities typically land around 51–60% — the top third Statewide. Below 25% may signal understaffing or heavy agency use — read with Staffing ratings.Rankings are based only on facilities in Virginia that report data for that category. Facilities without available data are excluded from the ranking.Click the rank badge to see the full State ranking.Click here to see the full State ranking.
Other operating costs Info Everything it costs to run the home apart from payroll — food, utilities, supplies, maintenance, contract labor and administration. Calculated as total operating expense minus payroll (staff salaries and wage-related benefits).
$11.3M
Total costs Info The home's total operating expense for the year — all the costs of running it, salaries included (CMS cost report, Worksheet G-3).
$26.7M

What does this home offer?

Pets allowed icon
Pets allowed icon

Pets Allowed

Housing options icon

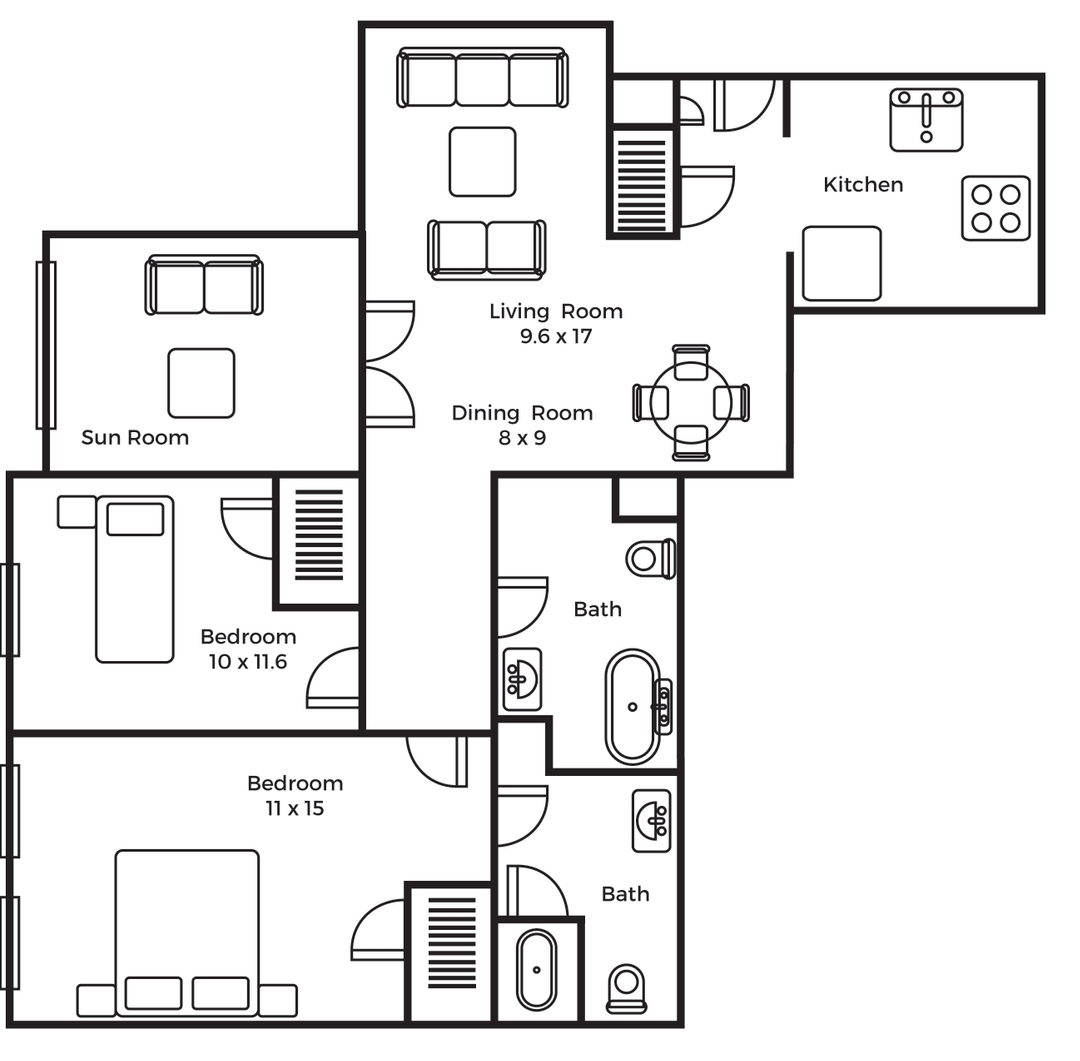
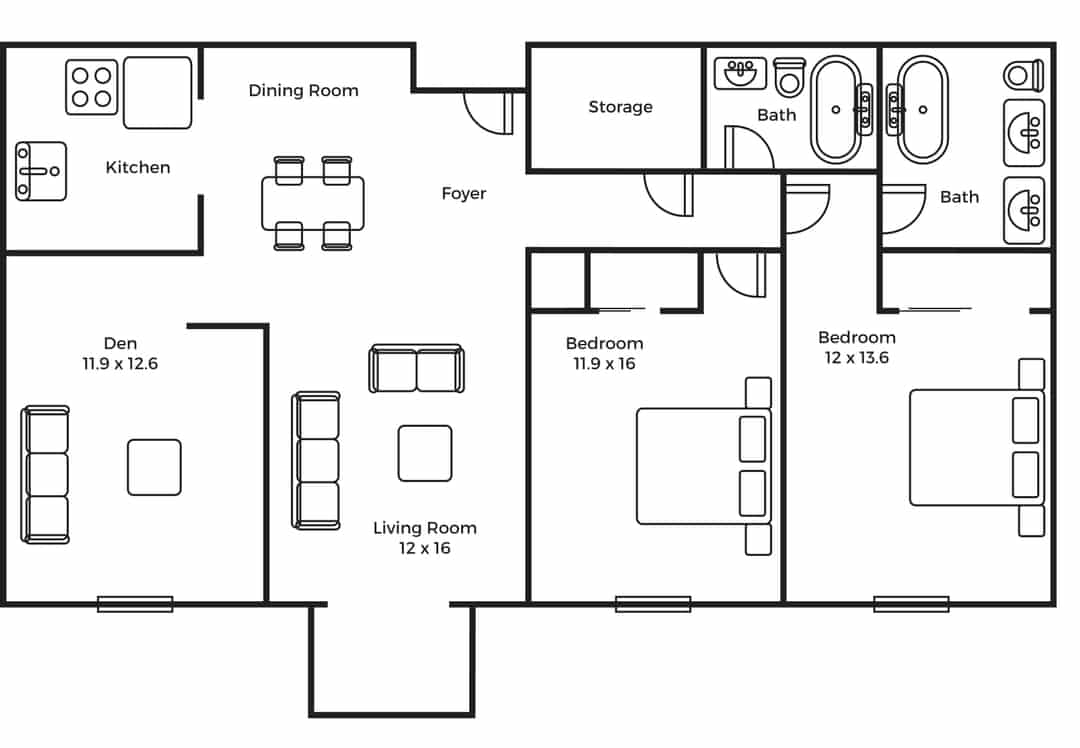
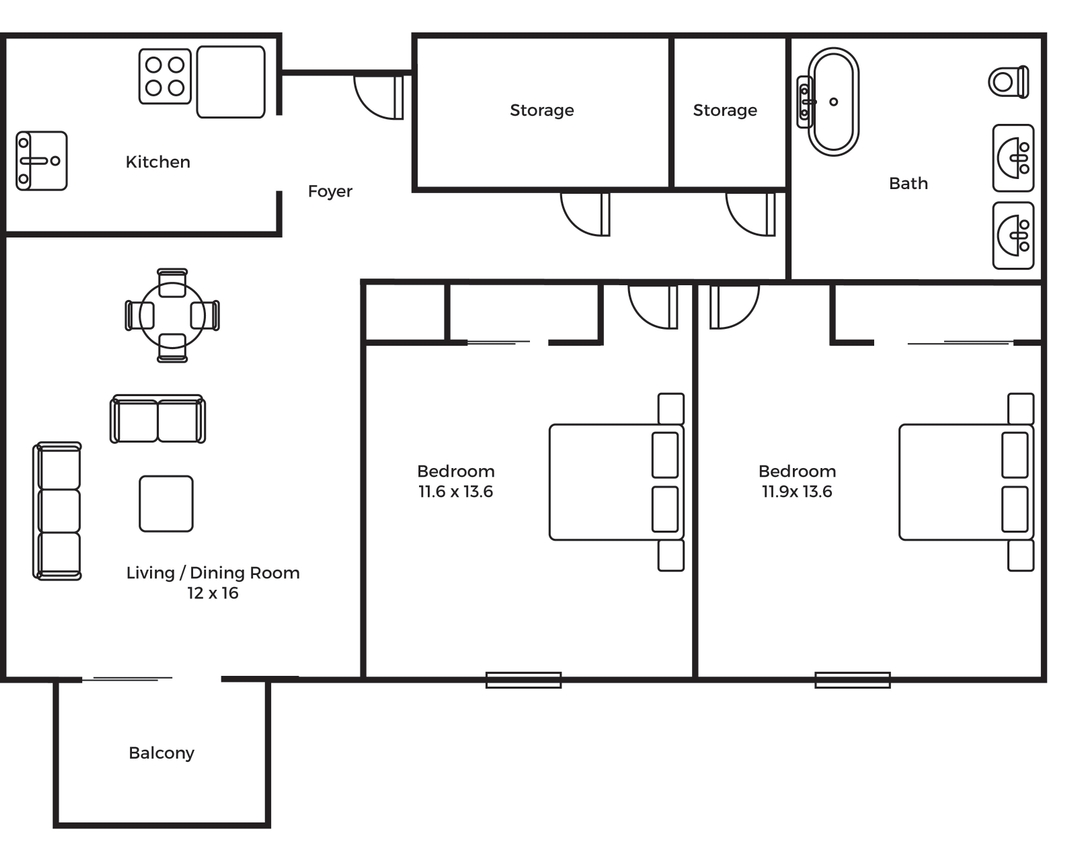
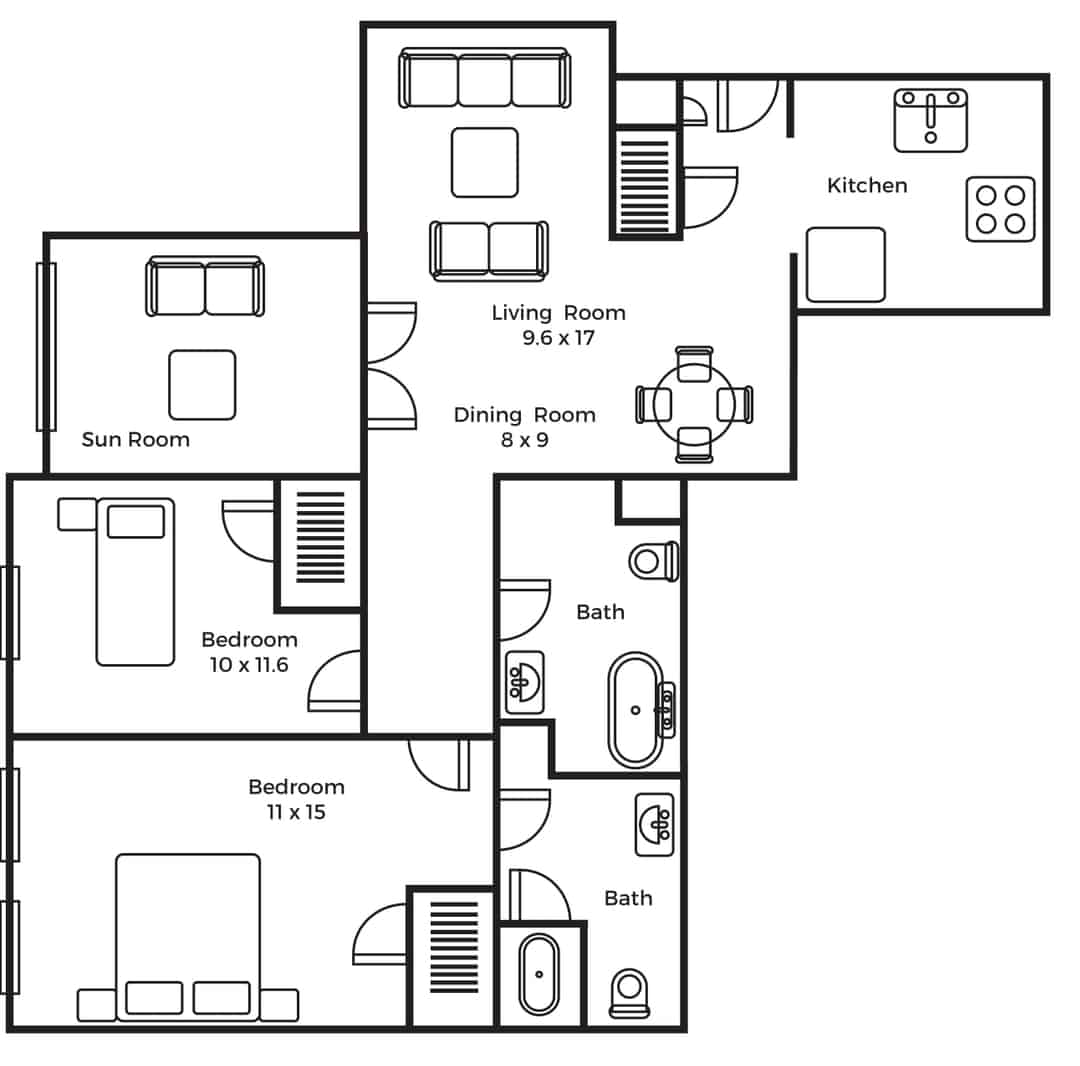
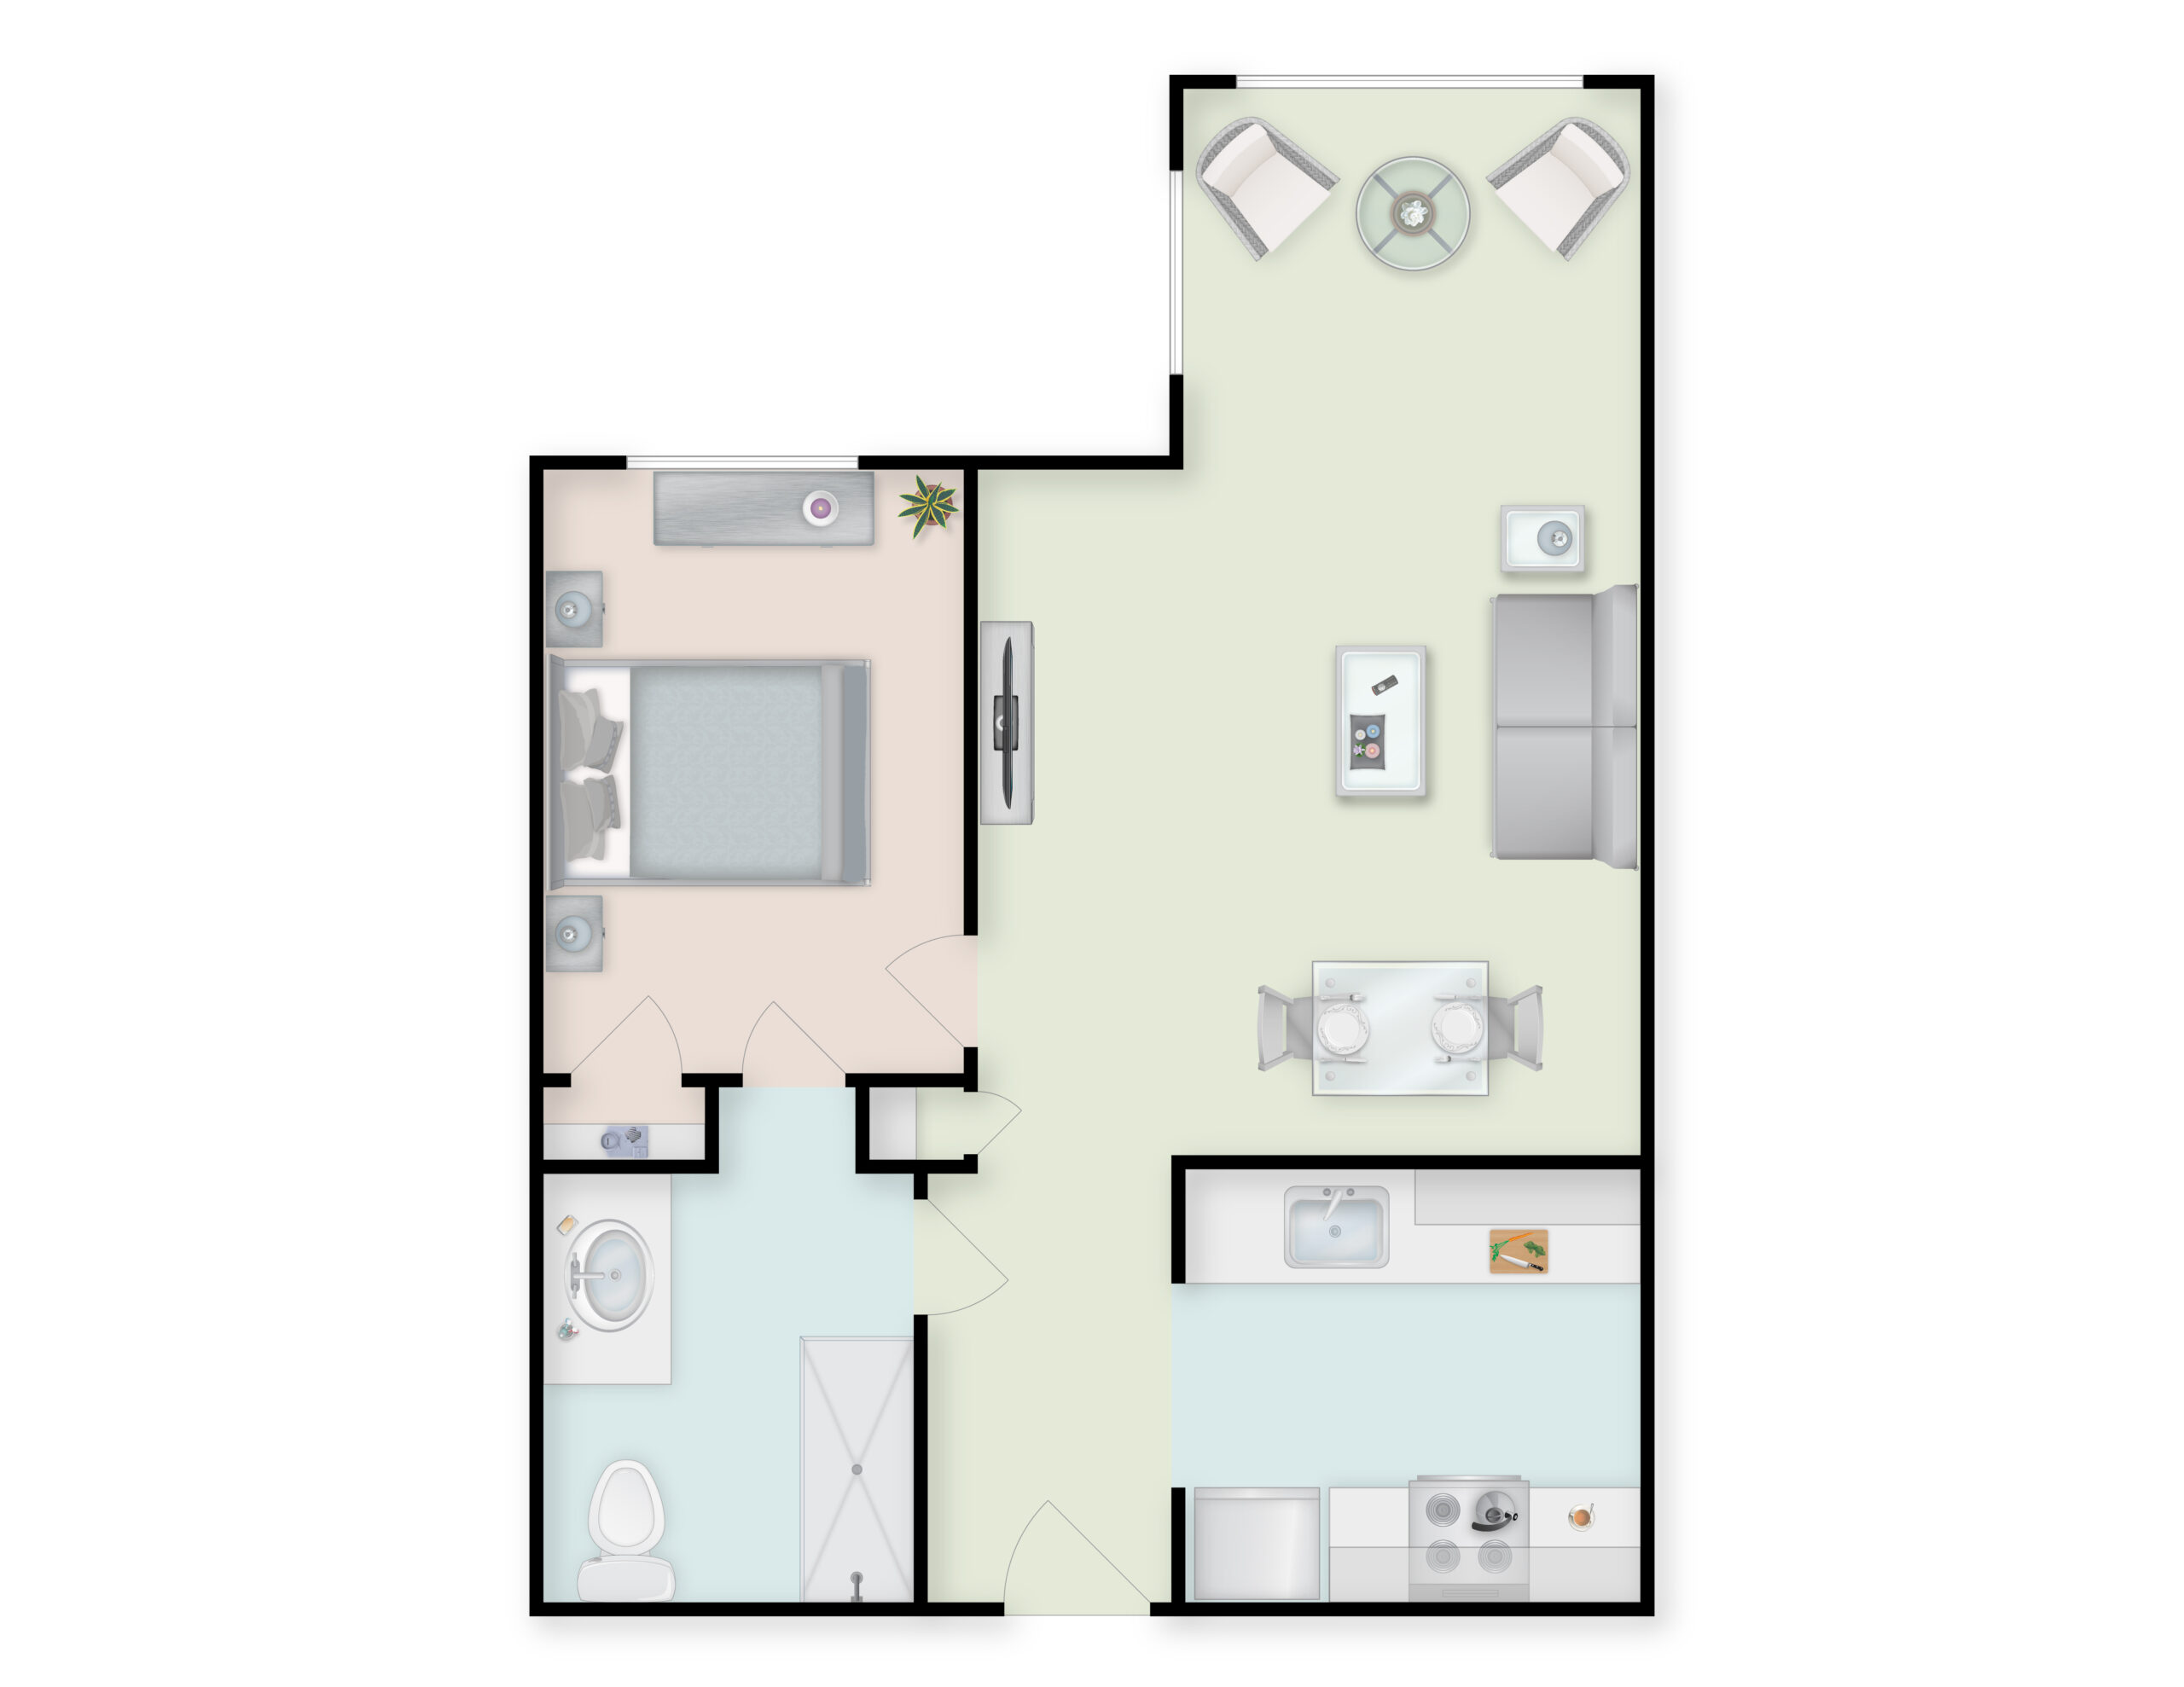
Housing Options: 2 Bed

Building type icon
Building type icon

Building Type: Mid-rise

Transportation services icon

Transportation Services

Fitness and recreation icon

Fitness and Recreation

Who this home usually serves

TYPE OF STAY

Mix of rehab and long-term care

This home supports both short-term rehab and long-term care, with residents staying for a wide range of durations.

Most new residents arrive under private pay (53% of admissions), and a typical private pay stay runs around 1 - 2 months.

Admissions
713 total

Coverage residents most often arrive under.

Medicare 34%
Private pay 53%
Medicaid 13%
Discharges
773 total

Coverage residents most often leave under.

Medicare 35%
Private pay 50%
Medicaid 15%

Living Spaces & Floor Plans for Friendship Retirement Community

Places of interest near Friendship Retirement Community

Address 4.3 miles from city center Info Estimated distance in miles from Roanoke's city center to Friendship Retirement Community's address, calculated via Google Maps.

Calculate Travel Distance to Friendship Retirement Community

Add your location

Address

Compare Nursing Homes around Roanoke

The information below is reported by the Virginia Department of Social Services and Department of Health.

5 facilities compared · CMS & VA Dept. of Health data

Our Lady of the Valley
NH
AL
MC
NC
RC
Roanoke (Gainsboro)
127
Facility 127
VA AVG 95
Rank #78 / 371
87.4%
Facility 87.4%
VA AVG 85.7%
Rank #65 / 314
+2%
3.79
Facility 3.79
VA AVG 3.74
Rank #47 / 89
-42%+1%
$0
Facility $0
VA AVG $54.3k
Rank #1 / 93
14
Facility 14
VA AVG 38.4
Rank #15 / 90
4.7
Facility 4.7
VA AVG 8.9
Rank #19 / 90
-111A+
68
Facility 68
VA AVG 44
Rank #74 / 449
David Rawlings
$14.8M
Facility $14.8M
VA AVG $18.3M
Rank #58 / 89
$8.2M
Facility $8.2M
VA AVG $6.9M
Rank #53 / 89
55.5%
Facility 55.5%
VA AVG 39.7%
Rank #37 / 89
495357
Friendship Retirement Community
NH
AL
IL
MC
RC
Roanoke (Hollins)
253
Facility 253
VA AVG 95
Rank #5 / 371
93.1%
Facility 93.1%
VA AVG 85.7%
Rank #27 / 314
+9%
4.46
Facility 4.46
VA AVG 3.74
Rank #33 / 89
+4%+19%
$0
Facility $0
VA AVG $54.3k
Rank #1 / 93
18
Facility 18
VA AVG 38.4
Rank #29 / 90
4.5
Facility 4.5
VA AVG 8.9
Rank #18 / 90
-231A+
48
Facility 48
VA AVG 44
Rank #186 / 449
Friendship Foundation Inc
$29.8M
Facility $29.8M
VA AVG $18.3M
Rank #20 / 89
$15.3M
Facility $15.3M
VA AVG $6.9M
Rank #22 / 89
51.5%
Facility 51.5%
VA AVG 39.7%
Rank #55 / 89
495092
Pheasant Ridge Nursing and Rehab Center
NH
MC
Roanoke (Southern Hills)
101
Facility 101
VA AVG 95
Rank #140 / 371
--
3.56
Facility 3.56
VA AVG 3.74
Rank #52 / 89
+4%-5%
$0
Facility $0
VA AVG $54.3k
Rank #1 / 93
25
Facility 25
VA AVG 38.4
Rank #43 / 90
6.3
Facility 6.3
VA AVG 8.9
Rank #33 / 90
119A+
15
Facility 15
VA AVG 44
Rank #385 / 449
Victor Bell
$10.9M
Facility $10.9M
VA AVG $18.3M
Rank #63 / 89
$5.1M
Facility $5.1M
VA AVG $6.9M
Rank #87 / 89
47.1%
Facility 47.1%
VA AVG 39.7%
Rank #71 / 89
495325
South Roanoke Nursing Home
NH
AL
Roanoke (Edgehill)
98
Facility 98
VA AVG 95
Rank #158 / 371
85.7%
Facility 85.7%
VA AVG 85.7%
Rank #75 / 314
0%
3.36
Facility 3.36
VA AVG 3.74
Rank #56 / 89
+6%-10%
$0
Facility $0
VA AVG $54.3k
Rank #1 / 93
39
Facility 39
VA AVG 38.4
Rank #54 / 90
13.0
Facility 13.0
VA AVG 8.9
Rank #69 / 90
-88A+
45
Facility 45
VA AVG 44
Rank #208 / 449
American Healthcare LLC
$9.5M
Facility $9.5M
VA AVG $18.3M
Rank #83 / 89
$5.1M
Facility $5.1M
VA AVG $6.9M
Rank #77 / 89
53.6%
Facility 53.6%
VA AVG 39.7%
Rank #18 / 89
495002
Old Southwest Rehabilitation and Nursing
NH
HC
MC
PC
RC
Roanoke (Old Southwest)
130
Facility 130
VA AVG 95
Rank #69 / 371
25.4%
Facility 25.4%
VA AVG 85.7%
Rank #307 / 314
-70%
3.82
Facility 3.82
VA AVG 3.74
Rank #47 / 89
-27%+2%
$143.8k
Facility $143.8k
VA AVG $54.3k
Rank #93 / 93
131
Facility 131
VA AVG 38.4
Rank #89 / 90
18.7
Facility 18.7
VA AVG 8.9
Rank #88 / 90
433A+
57
Facility 57
VA AVG 44
Rank #133 / 449
Andrew Shuler
$8.8M
Facility $8.8M
VA AVG $18.3M
Rank #85 / 89
$4.2M
Facility $4.2M
VA AVG $6.9M
Rank #79 / 89
47.8%
Facility 47.8%
VA AVG 39.7%
Rank #23 / 89
495156

Financial Assistance for
Nursing Home in Virginia

Friendship Retirement Community is located in Roanoke, Virginia.
Here are the financial assistance programs available to residents in Virginia.

Get Financial aid guidance

Commonwealth Coordinated Care Plus (CCC Plus)

VA Medicaid CCC Plus

Age 65+ or disabled
General Virginia resident, Medicaid-eligible, nursing home-level care need.
Income Limits (2025) ~$2,829/month 300% FBR, individual
Asset Limits $2,000 (individual), $3,000 (couple).
VA

Managed care model; high demand in urban areas.

Benefits
Personal care (5-7 hours/day) Respite (240 hours/year) Adult day care ($65/day) Home modifications ($1,500 avg.)

Virginia Respite Care Grant Program

VA Respite Grant

Age Caregiver of someone 60+
General Virginia resident.
Income Limits ~$2,500/month individual, varies
Asset Limits $40,000 individual
VA

Limited grants; rural/urban balance.

Benefits
In-home respite (up to 30 days/year) Adult day care (~$65/day) Facility respite (up to 5 days)

Adult Services Program

Virginia Adult Services (AS)

Age 60+ (or disabled 18+)
General VA resident, need significant care (2+ ADLs), not Medicaid-eligible.
Income Limits (2025) Varies by locality; typically < ~$2,510/month 200% FPL
Asset Limits Limited assets (excludes home, car); varies by DSS.
VA

Serves ~5,000 annually; focuses on low-income independence.

Benefits
Personal care (4-6 hours/week) Adult day care (~$60/day) Chore services Assessments Respite (~5 days/year)

Auxiliary Grant Program

Virginia Auxiliary Grant (AG)

Age 65+ (or disabled 18+)
General VA resident, living in approved ALF/foster care, SSI-eligible or low-income.
Income Limits (2025) ~$1,041/month (individual, SSI level + $20 disregard); higher with medical deductions.
Asset Limits $2,000 individual
VA

Serves 4,000; personal needs allowance ($90/month).

Benefits
Cash (~$1,400-$1,700/month in 2025, varies by region) for ALF/foster care costs; basic care included

Medicare Savings Program (MSP)

Virginia Medicare Savings Program

Age 65+ or disabled
General VA resident, Medicare Part A/B.
Income Limits (2025) ~$2,510/month (QMB), ~$3,380/month (SLMB), ~$3,598/month (QI)—individual.
Asset Limits $9,430 (individual), $14,130 (couple).
VA

Includes Extra Help for Part D; no waitlist.

Benefits
Covers Part B premiums ($174.70/month) Deductibles ($240/year) Copays (~20%)

Energy Assistance Program (EAP)

Virginia Energy Assistance Program

Age 60+ prioritized
General VA resident, low-income household.
Income Limits (2025) ~$3,970/month 185% FPL
Asset Limits Not assessed.
VA

Fuel, Crisis, Cooling components; serves ~100,000 households.

Benefits
Heating/cooling aid ($300-$1,000/season) Crisis aid ($500 max) Equipment repair (~$250)

VA Aid and Attendance (A&A) and Housebound Benefits

Virginia VA Aid and Attendance/Housebound

Age 65+ or disabled veteran/spouse
General VA resident, wartime service, ADL help (A&A) or homebound.
Income Limits (2025) Net income < ~$1,984/month (veteran with dependent, A&A); pension offsets income.
Asset Limits ~$155,356 net worth
VA

High veteran population; supports rural/urban needs.

Benefits
Cash (~$1,433-$2,642/month veteran, ~$951-$1,318 spouse) for care costs

Property Tax Relief for the Elderly and Disabled

Virginia Property Tax Relief

Age 65+ or disabled
General VA resident, homeowner, income/asset limits vary by locality.
Income Limits (2025) ~$50,000-$75,000/year household, e.g., Fairfax: $72,000; Richmond: $50,000
Asset Limits Varies e.g., Fairfax: $400,000 net worth; Richmond: $100,000
VA

Offered in 90% of localities; saves ~$500-$2,000/year.

Benefits
Tax exemption/deferral (~$500-$2,000/year depending on locality)

Senior Farmers’ Market Nutrition Program (SFMNP)

Virginia SFMNP

Age 60+
General VA resident, low-income.
Income Limits (2025) ~$2,322/month 185% FPL
Asset Limits Not assessed.
VA

Vouchers (~$50-$75/season); serves ~15,000 via AAAs.

Benefits
Vouchers (~$50-$75/season) for produce at farmers’ markets

Frequently Asked Questions about Friendship Retirement Community

What neighborhood is Friendship Retirement Community in?

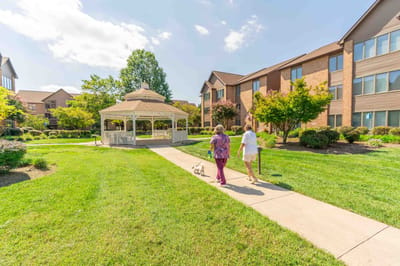
Friendship Retirement Community is in the Hollins neighborhood of Roanoke.

Is Friendship Retirement Community in a walkable area?

Friendship Retirement Community has a walk score of 48. Somewhat walkable. A few nearby services may be reachable on foot, but most trips require transportation.

What is the occupancy rate at Friendship Retirement Community?

Friendship Retirement Community's occupancy is 93.1%.

Does Friendship Retirement Community have different floorplan options?

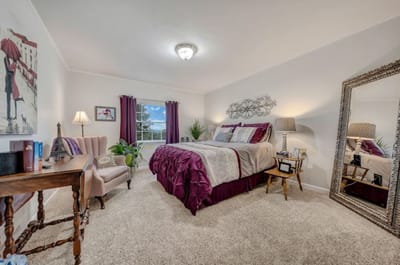
Yes — see the floorplan options available at Friendship Retirement Community on this page.

Does Friendship Retirement Community operate as a for-profit or non-profit?

Friendship Retirement Community is registered as a non-profit in VA.

Are there photos of Friendship Retirement Community?

Yes — there are 36 photos of Friendship Retirement Community in the photo gallery on this page.

What is the address of Friendship Retirement Community?

Friendship Retirement Community is located at 367 Hershberger Rd, Roanoke, VA 24012.

Guides for Better Senior Living

Care Cost Calculator: See Prices in Your Area

Nursing Home Data Explorer

Don’t Wait Too Long: 7 Red Flag Signs Your Parent Needs Assisted Living Now

The True Cost of Assisted Living in 2025 – And How Families Are Paying For It

Understanding Senior Living Costs: Pricing Models, Discounts & Financial Assistance