Explore Open Rooms

1 Contact details
2 What type of senior care service are you looking for?
3 What budget do you have in mind for senior care?
4 How soon do you need to find care?
5 Additional details

Thank you for your interest!

Our team will be in touch shortly to help with next steps.

Nursing Home in Gilbert

CMS overall rating Info The Overall CMS Rating combines results from health inspections, staffing levels and quality measures. Health inspections carry the most weight. Staffing and quality scores can increase or decrease the final rating based on performance compared to state and national standards.

Santé of Scottsdale

5358 E Baseline Rd, Mesa, AZ 85206 View map
Overview of Santé of Scottsdale

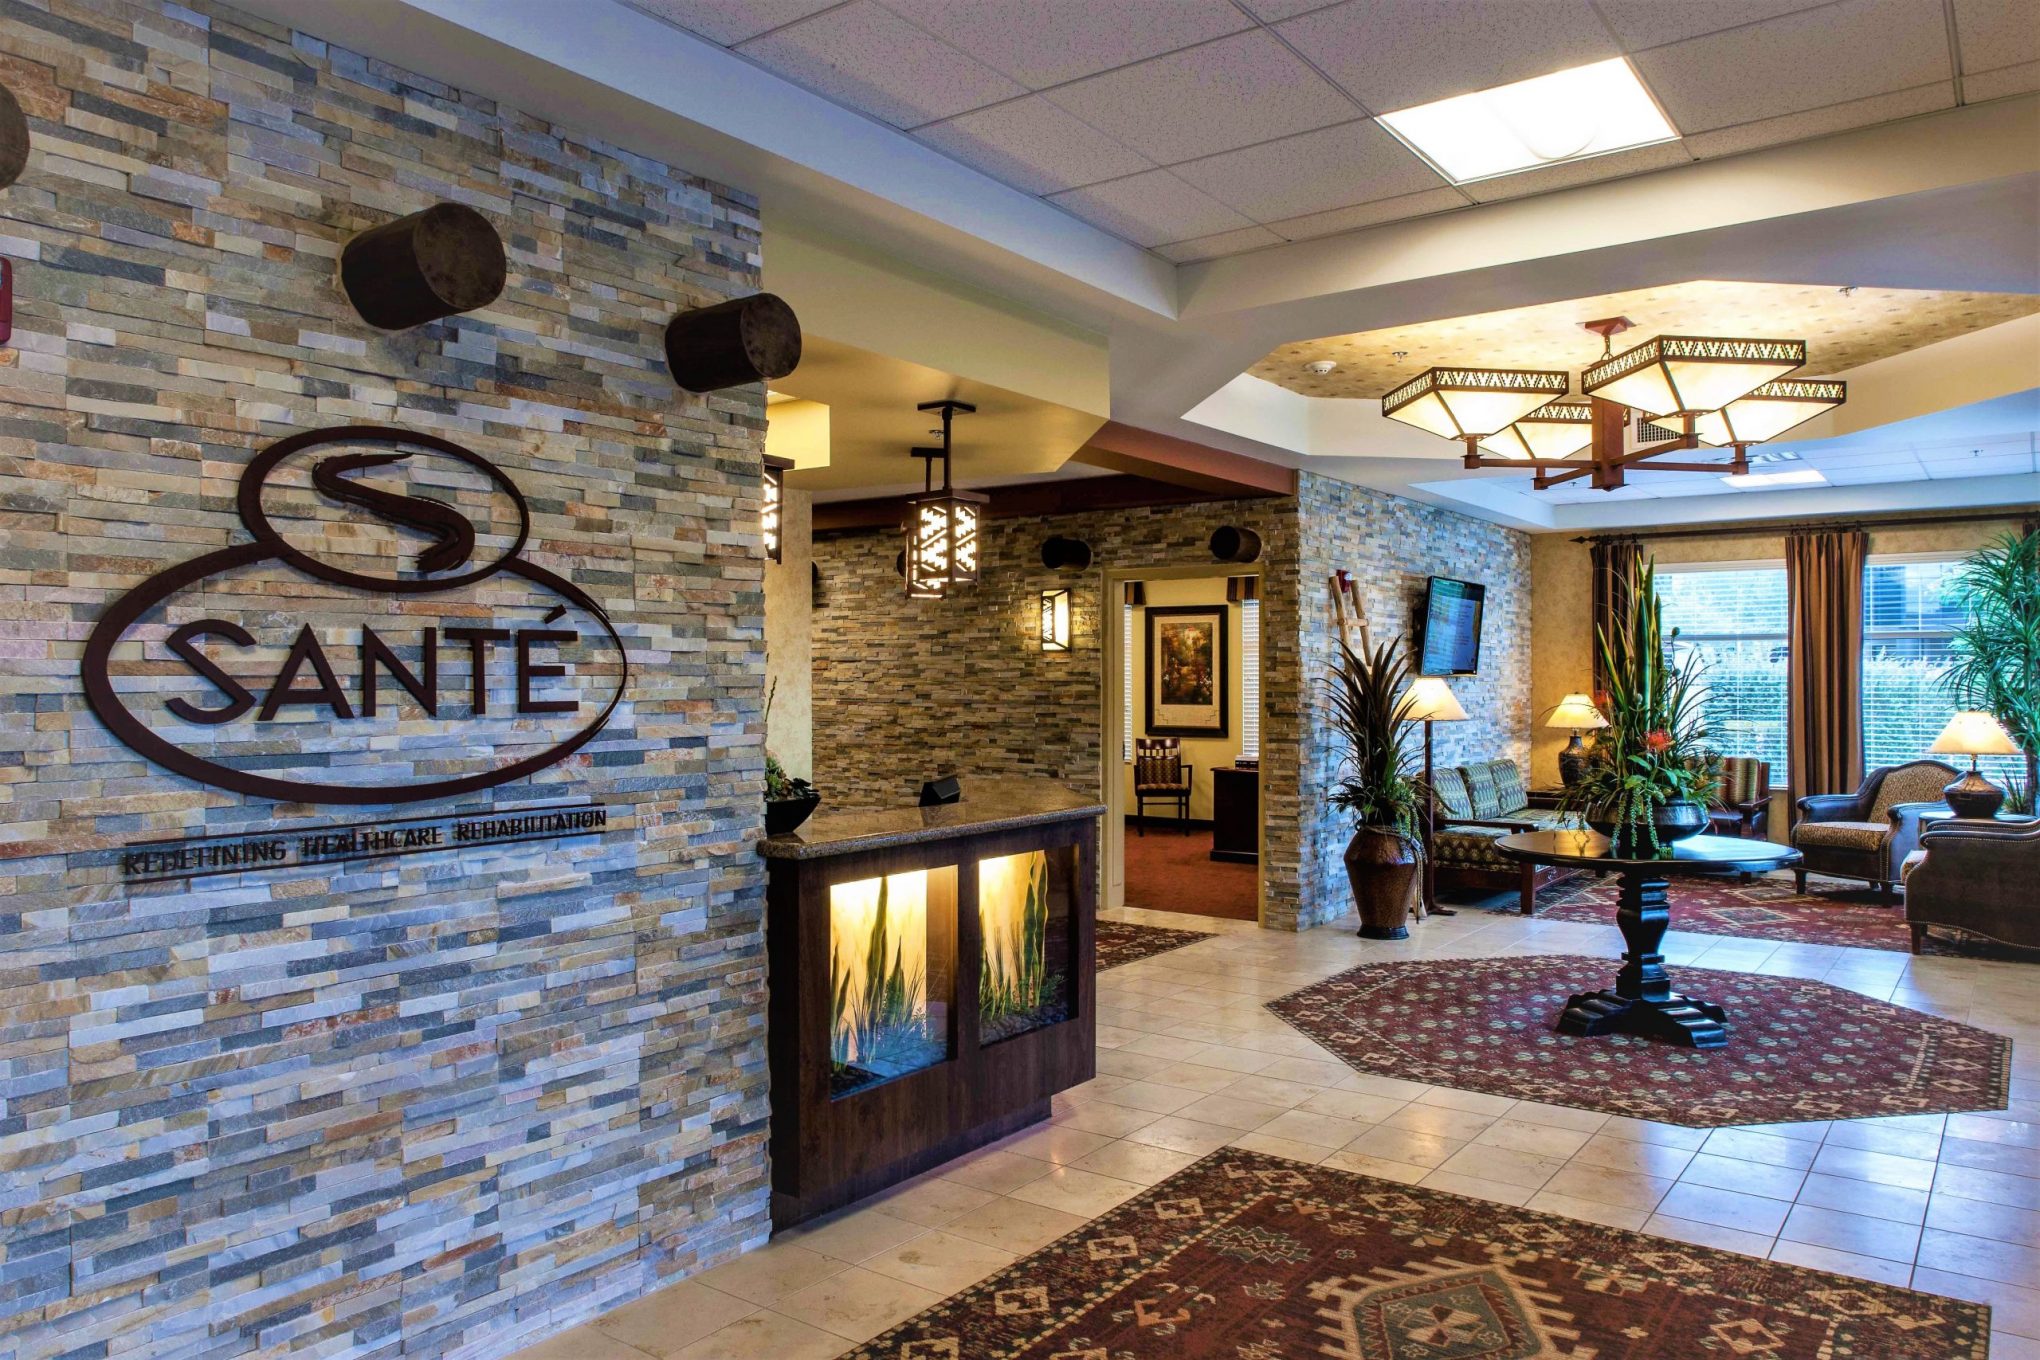
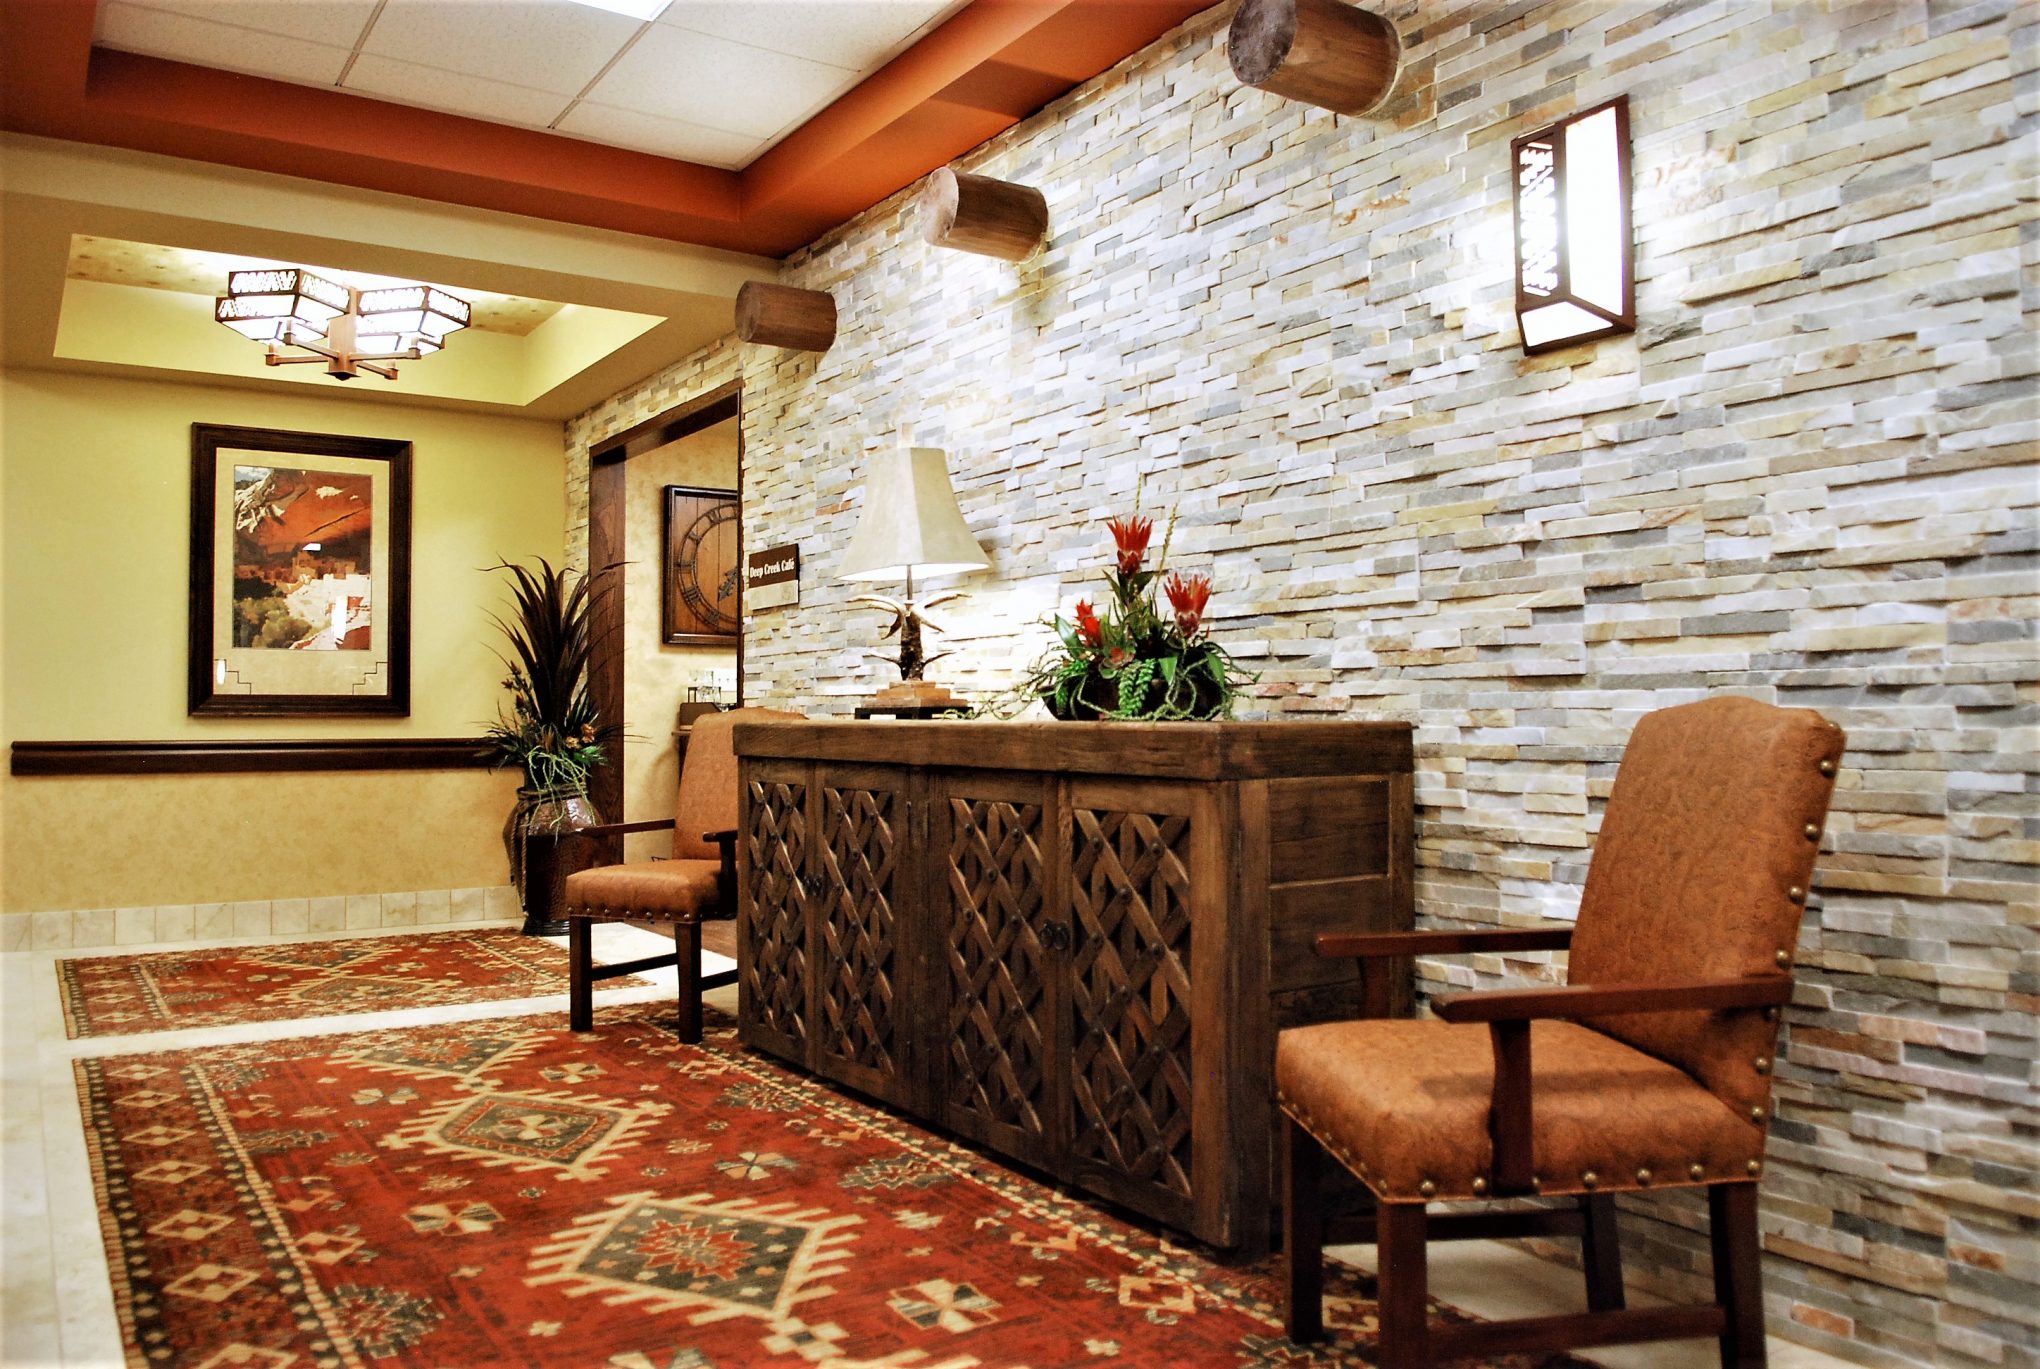
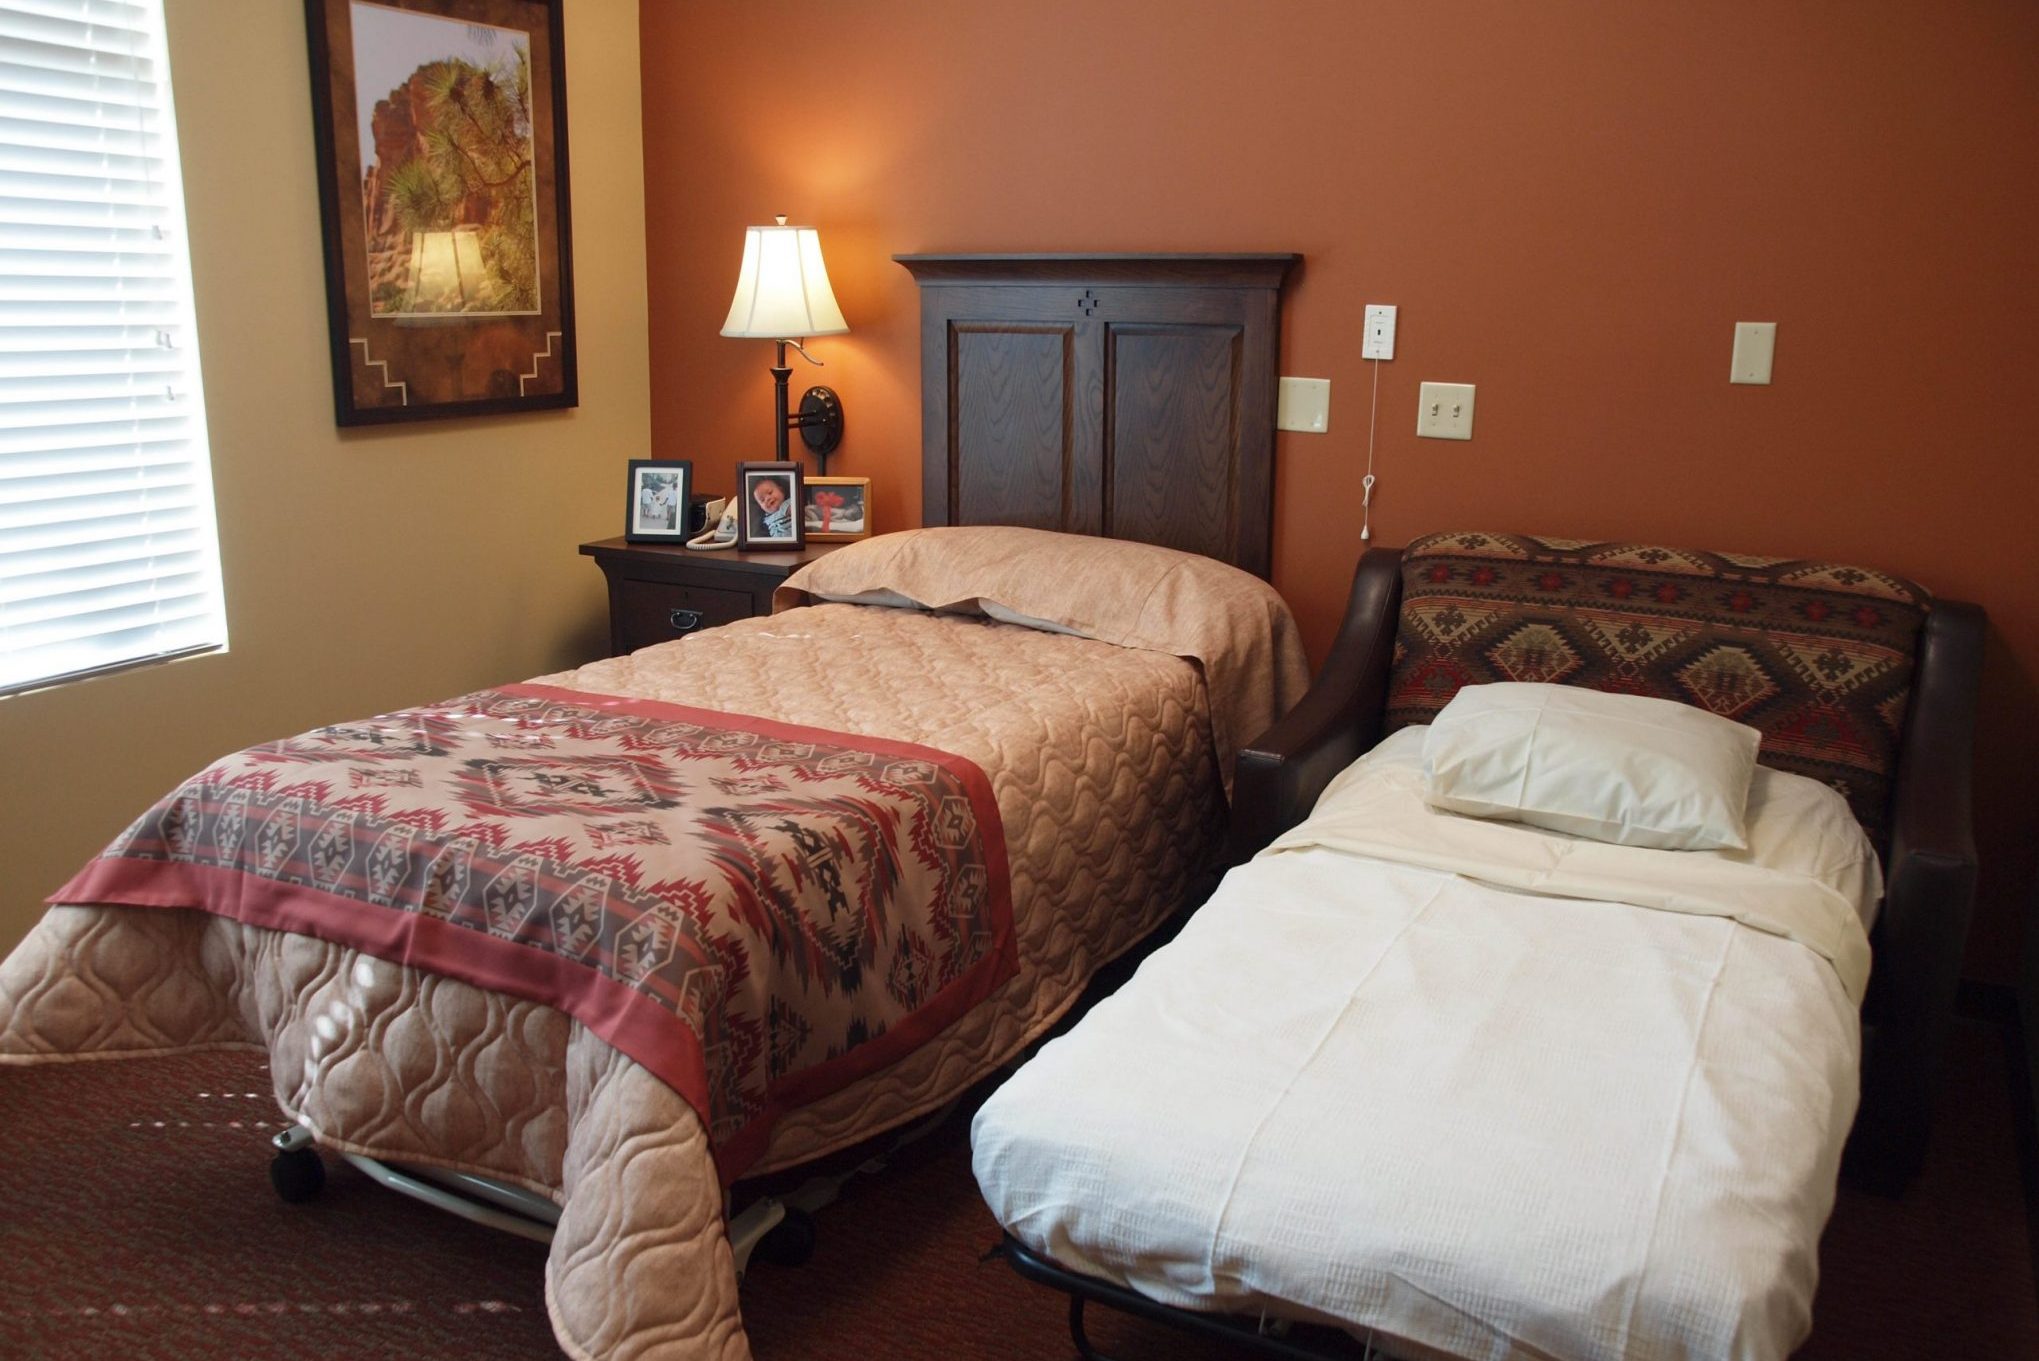
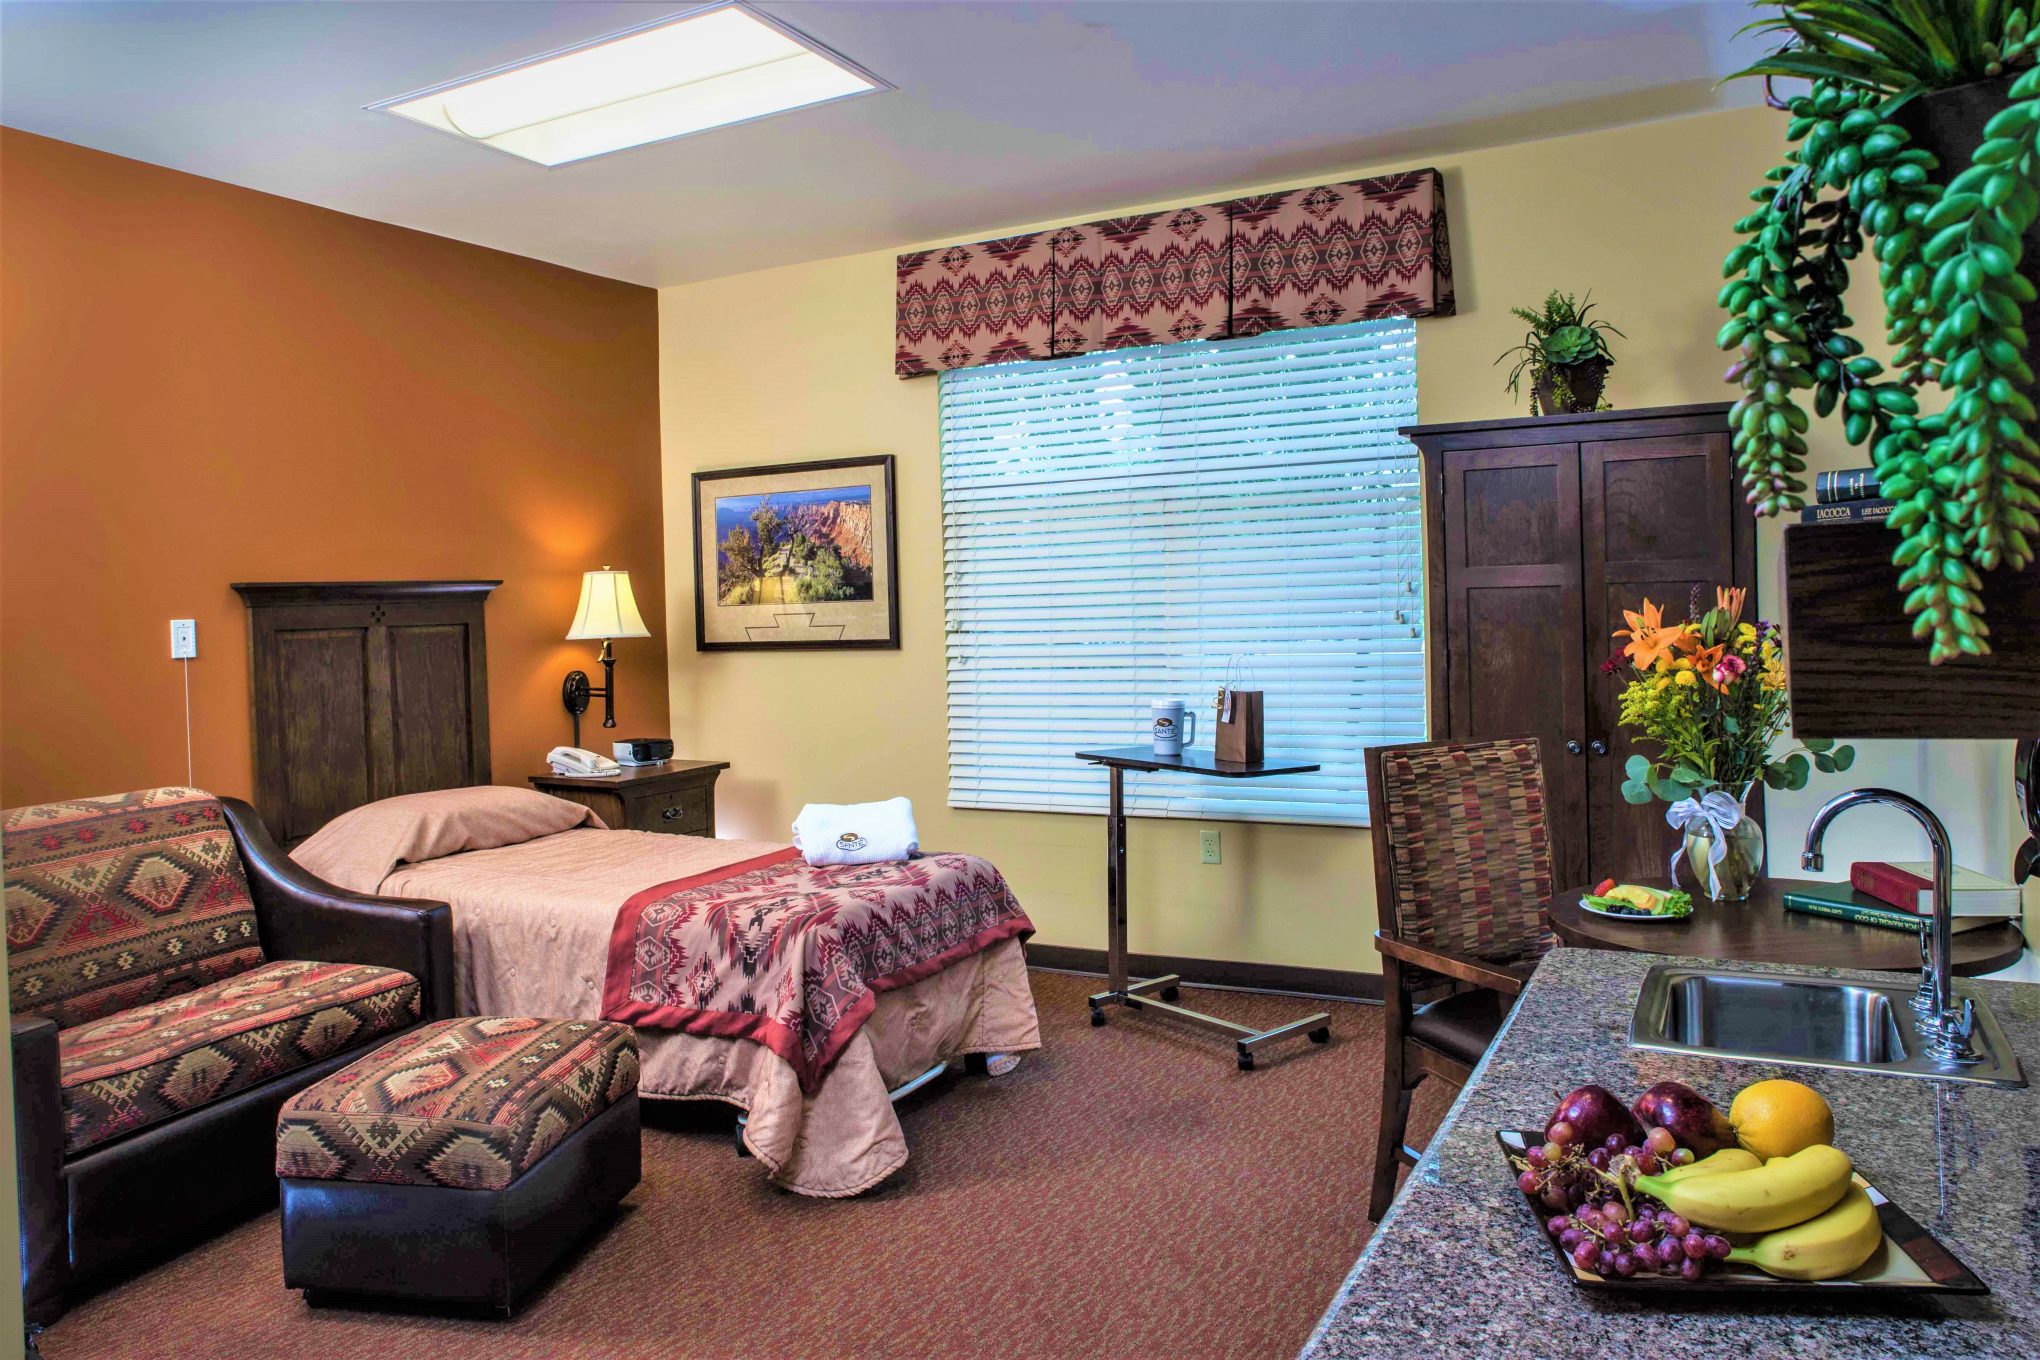
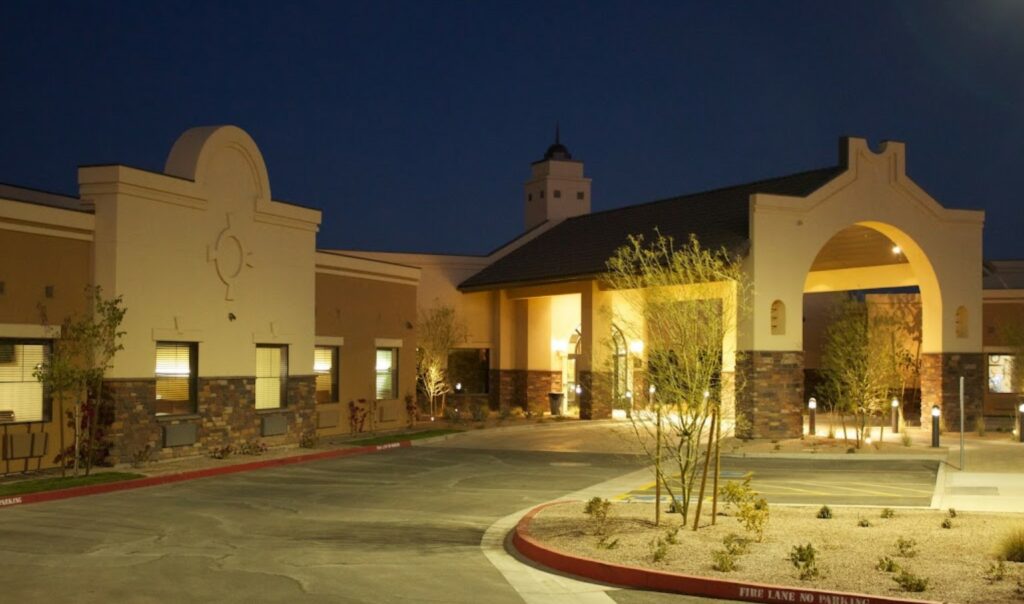
Just a stone’s throw away from Scottsdale, Santé of Mesa aims to reinvent the meaning of skilled nursing and rehabilitation for seniors through the exceptional care delivered by their patient-friendly staff to offer the best care possible for their residents; they are guaranteed to rejuvenate and recover in a safe and comfortable environment. Santé of Mesa does its best to ensure everyone can thrive in a home that gets to know its residents and empowers them to embrace a new chapter in their lives.

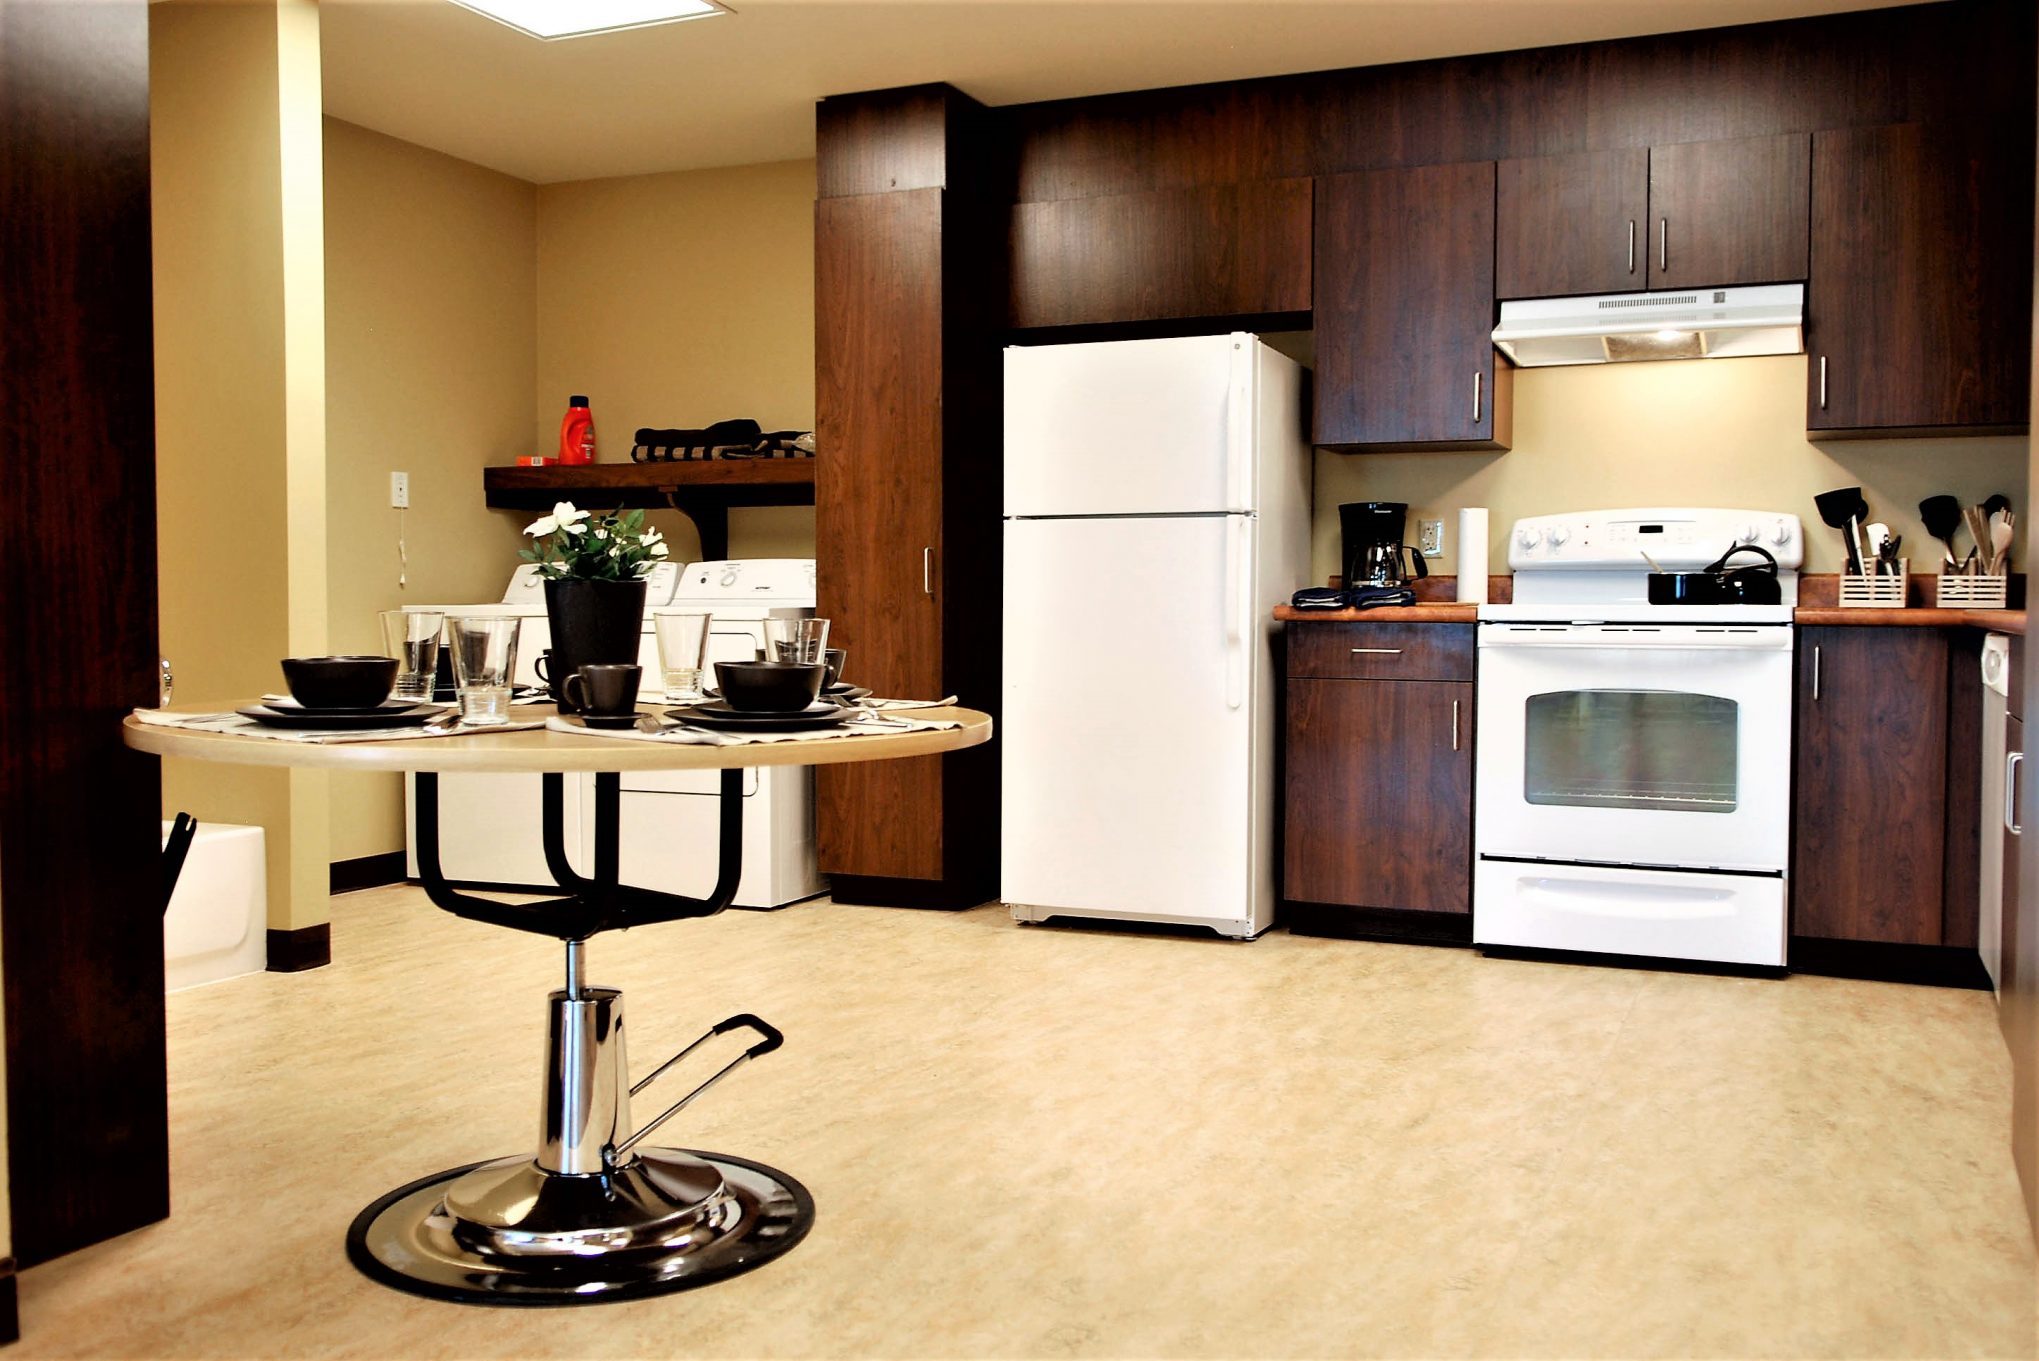
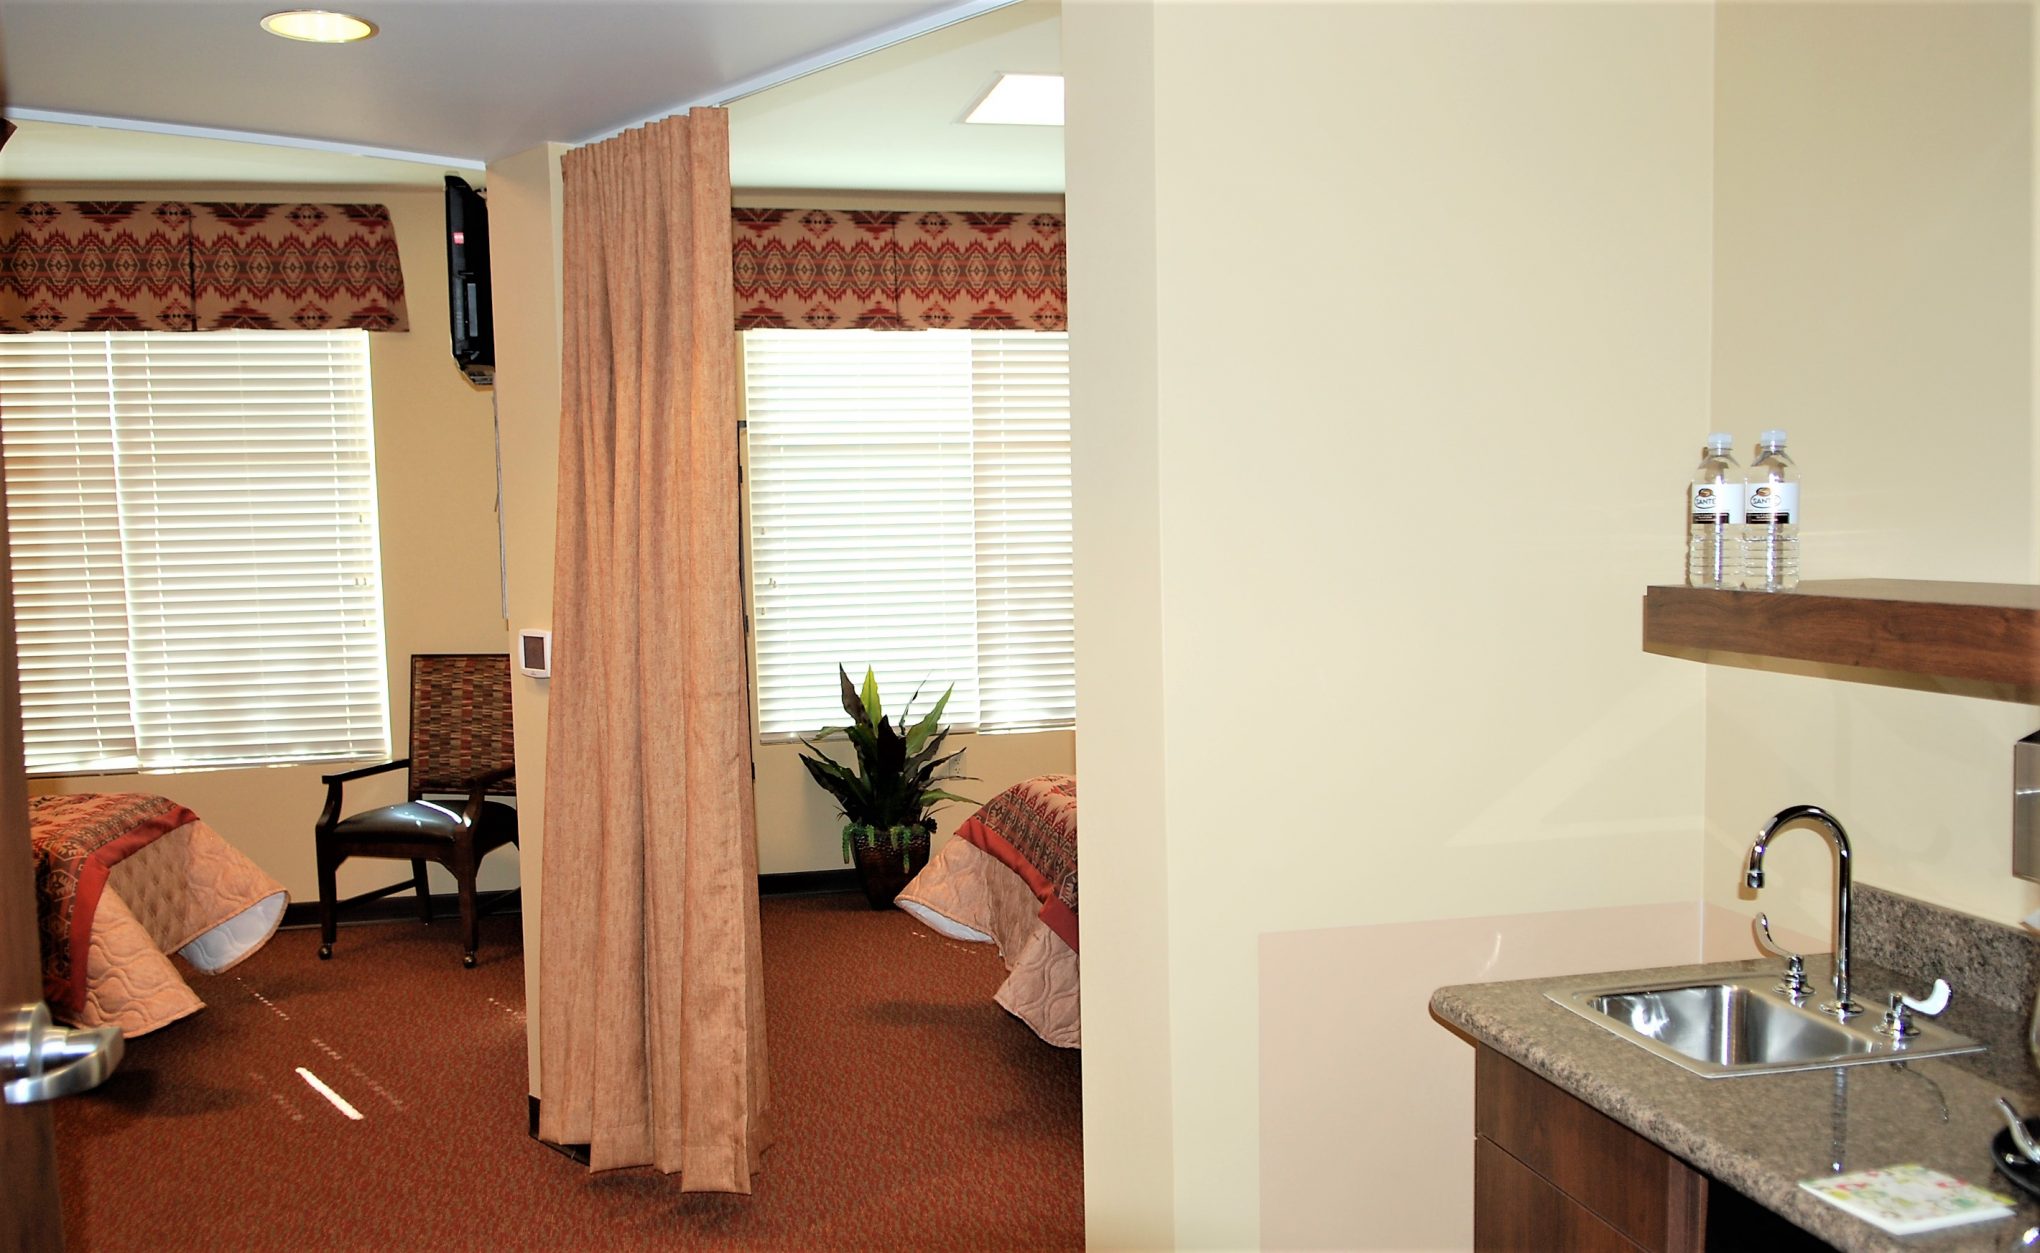
Specializing in long-term care, short-term rehabilitation, and memory care services, a list of services helps boost a speedy recovery. Wound care, joint replacement, physical therapy, non-ventilator-dependent, pain management, tube feeding, and surgical recovery are some of the interdisciplinary services offered.

(480) 588-5386

Quality ratings

Measured by Centers for Medicare & Medicaid Services (CMS)

Overall rating Info The Overall CMS Rating combines results from health inspections, staffing levels and quality measures. Health inspections carry the most weight. Staffing and quality scores can increase or decrease the final rating based on performance compared to state and national standards.
5/5
Arizona average: 3.5/5
Health Inspection Info Based on the results of the facility's three most recent standard inspections and any complaint investigations. CMS reviews the number, scope, and severity of deficiencies, with more recent findings weighted more heavily.
4/5
Arizona average: 2.8/5
Staffing Info Measures average nursing staff hours per resident per day, including Registered Nurses (RNs) and total nursing staff. Ratings are adjusted based on the level of care residents require and are compared to state and national benchmarks.
4/5
Arizona average: 3.5/5
Quality Measures Info Based on clinical and physical health indicators reported to CMS, such as hospital readmissions, falls, pressure ulcers, and improvements in mobility. These measures reflect how well residents' health needs are being managed.
5/5
Arizona average: 4.6/5

Nursing care per resident

Info This shows how many total hours of nursing staff time are available per resident each day. Higher numbers usually mean more staff support.
4h 41m per day

This home provides 12% more nursing time per resident than the Arizona average.

Arizona average: 4h 11m per day

Staffing hours breakdown

Info Hours of care per resident per day, broken down by staff type. Data from CMS Medicare.
Staff type Facility State avg National avg
Registered Nurse (RN) Info Registered nurse hours per resident per day. 1h 1m per day 43m per day 41m per day
Nurse Aide Info Nurse aide hours per resident per day. 2h 50m per day 2h 22m per day 2h 21m per day
Total Nursing (Weekend) Info Total number of nurse staff hours per resident per day on weekends. 4h 35m per day 3h 38m per day 3h 26m per day
Physical Therapist Info Physical therapist staff hours per resident per day. 17m per day 6m per day 4m per day
RN (Weekend) Info Registered nurse hours per resident per day on weekends. 56m per day 31m per day 29m per day

Capacity and availability

Smaller home

May offer a more intimate, personalized care environment.

Total beds 70

This home usually has limited availability

Occupancy is moderate, suggesting balanced demand.

Similar demand to the Arizona average
Occupancy rate 88%
Residents per day (avg) 65
Occupancy rate
88%
Residents per day (avg)
65

Who this home usually serves

TYPE OF STAY

Mix of rehab and long-term care

This home supports both short-term rehab and long-term care, with residents staying for a wide range of durations.

Breakdown by payment type

Medicare

43% of new residents, usually for short-term rehab.

Typical stay 23 days

Private pay

57% of new residents, often for short stays.

Typical stay 20 days

Finances and operations

Privately-owned community
Operated by a partnership between two or more business owners.
Home revenue
$27.6M
Operating loss
-$1.0M
Privately-owned community Operated by a partnership between two or more business owners.
Home revenue
$27,557,910.00
Operating loss
$-1,046,292.00
Payroll costs Info The portion of the home's budget spent on staff, including nurses, caregivers, and other employees who support care and operations.
$7.0M
25.5% of revenue
Other operating costs Info All remaining costs needed to run the home, such as food, utilities, building maintenance, supplies and administrative expenses.
$21.6M
Total costs $28.6M
Bed community size
70-bed community
A moderately sized community that may balance personal attention with shared amenities and social activities.
Years in operation
14 years in operation
A community with a solid operating history and experience delivering ongoing care.
Walk Score
Walk Score: 29 / 100
Somewhat walkable. A few nearby services may be reachable on foot, but most trips require transportation.

About this community

License Details

Facility TypeNursing Care Institution
StatusActive
IssuanceApril 22, 2011
ExpirationMarch 31, 2026

Additional Licensing Details

License NumberNCI-2697
CMS Certification Number35280
QualificationHealth Care

Ownership & Operating Entity

Santé of Scottsdale is legally operated by Sante Of Mesa, and administrated by Jonique Housley-castaneda.

Types of Care at Santé of Scottsdale

Skilled Nursing
Contact Santé of Scottsdale

Performance summary

Key indicators of commitment to quality care and safety.

Ratings

Quality Rating
A Highest rating

Based on state quality rating data.

Inspection History

In Arizona, the Department of Health Services, Bureau of Long Term Care Licensing performs regular onsite inspections and investigates complaints for all licensed residential and nursing facilities.

12 visits/inspections

8 complaint inspections

Arizona average: 6 complaint visits

Arizona average: 5 inspections

8 complaints

Formal expressions of dissatisfaction or concern made by residents, or their families regarding various aspects of the care, services, and environment provided.

Arizona average: 6 complaints

Latest inspection

Date October 16, 2024
Complaint
Results No deficiencies

8 deficiencies

Deficiencies indicate regulatory issues. A higher number implies the facility had several areas requiring improvement.

Arizona average: 9 deficiencies

Inspection Report Summary for Santé of Scottsdale

The most recent inspection on October 16, 2024, found no deficiencies during a complaint investigation. Earlier inspections showed a mixed pattern, with some surveys citing deficiencies related to nurse staffing, medication administration, dialysis services, care planning, abuse reporting, and ombudsman notification. Complaint investigations were mostly unsubstantiated, with no fines, immediate jeopardy findings, or enforcement actions listed in the available reports. Prior reports noted isolated issues with COVID-19 reporting to the CDC NHSN. The facility’s record shows some recurring themes but no clear worsening or improvement trend over time.

Health Inspection History

Inspections
Total health inspections 6

Arizona average 6.3


Last Health inspection on Jul 2025

Total health citations 19

Arizona average 23.2

Citations per inspection
3.17

Arizona average 3.82


Health citations are formal notices following inspections when they fail to comply with safety and care standards.

16 of 19 citations resulted from standard inspections; and 3 of 19 resulted from complaint investigations.

Breakdown of citation severity (last 3 years)
Critical Health citations More info 0
100% better than Arizona average

Arizona average: 0.1


Serious Health citations More info 1
67% worse than Arizona average

Arizona average: 0.6

0 critical citations More info Arizona average: 0.1

1 serious citation More info Arizona average: 0.6

18 moderate citations More info Arizona average: 22.3

0 minor citations More info Arizona average: 0.2
Citations history (last 3 years)
Resident Rights moderate citation Info Issues related to resident's rights, including dignity, privacy, and the ability to make decisions about their care. Jul 02, 2025
Corrected

Nursing Services moderate citation Info Issues related to the availability and quality of nursing staff and the care they provide. Sep 06, 2024
Corrected

Pharmacy moderate citation Info Issues related to medication management, including how drugs are stored, administered, and monitored. Sep 06, 2024
Corrected

Resident Rights moderate citation Info Issues related to resident's rights, including dignity, privacy, and the ability to make decisions about their care. Sep 06, 2024
Corrected

Compare Nursing Homes around Gilbert The information below is reported by the Arizona Department of Health Services, Bureau of Long Term Care Licensing.

4 facilities compared · CMS & AZ Dept. of Health data · Updated Apr 2026

Filter by care type
Wellsprings Therapy Center of Gilbert
AL

Assisted Living A licensed, long-term care setting for seniors or individuals with disabilities who need help with daily activities — like bathing, dressing, and medication management — but not 24-hour skilled nursing. Offers housing, meals, and around-the-clock support while aiming to maximize resident independence.

NH

Nursing Home Licensed facility providing 24/7 skilled nursing care for residents with complex, ongoing medical needs. Staffed by RNs, LPNs, and CNAs. Inspected and star-rated annually by CMS. Accepts Medicare (short-term rehab) and Medicaid (long-term care).

Gilbert
32
77.0%
+6%
3.85
-35%
-5%
0
4
4.0
0
27
-
27
Narducci, Nick
$6.4M
$2.8M
44%
35285
The Center at Val Vista
AL

Assisted Living A licensed, long-term care setting for seniors or individuals with disabilities who need help with daily activities — like bathing, dressing, and medication management — but not 24-hour skilled nursing. Offers housing, meals, and around-the-clock support while aiming to maximize resident independence.

NH

Nursing Home Licensed facility providing 24/7 skilled nursing care for residents with complex, ongoing medical needs. Staffed by RNs, LPNs, and CNAs. Inspected and star-rated annually by CMS. Accepts Medicare (short-term rehab) and Medicaid (long-term care).

Gilbert
93
71.5%
-2%
3.64
-62%
-10%
0
6
2.0
0
59
-
1
Murdock, Monte
$22.6M
$6.4M
28.2%
35291
Santé of Scottsdale
NH

Nursing Home Licensed facility providing 24/7 skilled nursing care for residents with complex, ongoing medical needs. Staffed by RNs, LPNs, and CNAs. Inspected and star-rated annually by CMS. Accepts Medicare (short-term rehab) and Medicaid (long-term care).

Mesa
70
88.0%
+21%
4.68
0%
+15%
1
19
3.2
1
65
-
29
Munch Tooke, Llc
$27.4M
$7.0M
25.6%
35280
Citadel Post Acute
AL

Assisted Living A licensed, long-term care setting for seniors or individuals with disabilities who need help with daily activities — like bathing, dressing, and medication management — but not 24-hour skilled nursing. Offers housing, meals, and around-the-clock support while aiming to maximize resident independence.

NH

Nursing Home Licensed facility providing 24/7 skilled nursing care for residents with complex, ongoing medical needs. Staffed by RNs, LPNs, and CNAs. Inspected and star-rated annually by CMS. Accepts Medicare (short-term rehab) and Medicaid (long-term care).

Mesa
128
88.5%
+22%
3.62
-21%
-11%
0
5
1.7
0
112
F
27
Speth, Terry
$14.6M
$8.7M
59.7%
35103

Places of interest near Santé of Scottsdale

Address 7.1 miles from city center — 2.53 miles to nearest hospital (Banner Baywood Medical Center | Mesa, AZ | Baywood Ave.)

Address 5358 E Baseline Rd, Mesa, AZ 85206

Calculate Travel Distance to Santé of Scottsdale

Add your location

Address

Staffing Data (Q2 2025)

This data corresponds to Q2 2025 and is based on CMS Payroll-Based Journal.

Total staff 179
Employees 127
Contractors 52
Staff to resident ratio 2.75:1
51% better than Arizona average

Arizona average ratio: 1.83:1

Avg staff/day 48
Average shift 9.1 hours
7% better than Arizona average

Arizona average: 8.5 hours

Total staff hours (quarter) 39,707
Nursing staff breakdown
Registered Nurse

Manages medical care and health needs.

Total count 18
Average shift length Info Average shift length. Calculated as total hours divided by days worked and average staff per day. 10.3 hours

This role is partially covered by contractors.

Licensed Practical Nurse

Assists with medical care and medications.

Total count 26
Average shift length Info Average shift length. Calculated as total hours divided by days worked and average staff per day. 11.4 hours

This role is partially covered by contractors.

Certified Nursing Assistant

Helps with daily care and mobility.

Total count 83
Average shift length Info Average shift length. Calculated as total hours divided by days worked and average staff per day. 10.3 hours

This role is partially covered by contractors.

Contractor staffing

Total hours from contractors

2.4%

957 contractor hours this quarter

Certified Nursing Assistant: 37 Registered Nurse: 7 Licensed Practical Nurse: 2 Occupational Therapy Aide: 2 Other Physician: 1 Medical Director: 1 Occupational Therapy Assistant: 1 Nurse Aide in Training: 1
Staff by category
Certified Nursing Assistant46378315,63491100%10.3
Licensed Practical Nurse242267,50891100%11.4
Registered Nurse117184,68991100%10.3
RN Director of Nursing4041,9046673%8.7
Speech Language Pathologist8081,8768897%7.8
Physical Therapy Aide9091,8578897%7.2
Respiratory Therapy Technician100101,5098897%6.6
Physical Therapy Assistant8081,3818998%6.5
Qualified Social Worker2028237380%8.7
Clinical Nurse Specialist2028078593%6.2
Administrator1015206571%8
Nurse Practitioner1015206571%8
Dental Services Staff1014605763%8.1
Medical Director011782629%3
Occupational Therapy Aide022673943%1.7
Occupational Therapy Assistant011498189%0.6
Other Physician01118910%2
Nurse Aide in Training011811%8
83 Certified Nursing Assistant
% of Days 100%
26 Licensed Practical Nurse
% of Days 100%
18 Registered Nurse
% of Days 100%
4 RN Director of Nursing
% of Days 73%
8 Speech Language Pathologist
% of Days 97%
9 Physical Therapy Aide
% of Days 97%
10 Respiratory Therapy Technician
% of Days 97%
8 Physical Therapy Assistant
% of Days 98%
2 Qualified Social Worker
% of Days 80%
2 Clinical Nurse Specialist
% of Days 93%
1 Administrator
% of Days 71%
1 Nurse Practitioner
% of Days 71%
1 Dental Services Staff
% of Days 63%
1 Medical Director
% of Days 29%
2 Occupational Therapy Aide
% of Days 43%
1 Occupational Therapy Assistant
% of Days 89%
1 Other Physician
% of Days 10%
1 Nurse Aide in Training
% of Days 1%

Facility Characteristics

Source: CMS Long-Term Care Facility Characteristics (Data as of Jan 2026)

Total census
65 residents
Residents by payment source
Medicare
65 residents (100%)

Quality of care over time

These measures show how residents usually do over time at this home, based on health outcomes and preventive care.

High-risk clinical events score Info A composite score based on pressure ulcers, falls with injury, weight loss, walking ability decline, and activities of daily living decline. 1.5
81% better than Arizona average

Arizona average: 7.6

Long-stay resident measures
Falls with Major Injury Info Percent of long-stay residents experiencing one or more falls with major injury 0.0%
100% better than Arizona average

Arizona average: 2.1%

High Risk Residents with Pressure Ulcers Info Percent of long-stay high risk residents with pressure ulcers 0.0%
100% better than Arizona average

Arizona average: 5.1%

Urinary Tract Infection Info Percent of long-stay residents with a urinary tract infection 0.0%
100% better than Arizona average

Arizona average: 1.3%

Lost Too Much Weight Info Percent of long-stay residents who lose too much weight 4.4%
20% better than Arizona average

Arizona average: 5.4%

Antipsychotic Use Info Percent of long-stay residents who received an antipsychotic medication 17.4%
70% worse than Arizona average

Arizona average: 10.3%

Pneumococcal Vaccine Info Percent of long-stay residents assessed and appropriately given the pneumococcal vaccine 100.0%
In line with Arizona average

Arizona average: 97.2%

Short-stay resident measures
Significantly above average Arizona avg: 4.3 Info CMS star rating based on short-stay quality measure performance. 5 stars = much above average, 1 star = much below average.
Pneumococcal Vaccine Info Percent of short-stay residents assessed and appropriately given the pneumococcal vaccine 99.0%
8% better than Arizona average

Arizona average: 91.5%

Antipsychotic medication increase Info Percent of short-stay residents who newly received an antipsychotic medication 0.2%
79% better than Arizona average

Arizona average: 1.0%

Influenza Vaccine Info Percent of short-stay residents assessed and appropriately given the seasonal influenza vaccine 94.8%
9% better than Arizona average

Arizona average: 87.3%

Re-hospitalized after SNF stay Info Percentage of short-stay residents who were re-hospitalized after their nursing home admission. 23.2%
6% better than Arizona average

Arizona average: 24.6%

Emergency department visits Info Percentage of short-stay residents who had an outpatient emergency department visit. 11.6%
8% worse than Arizona average

Arizona average: 10.7%

Falls with major injury Info Percentage of SNF residents who experience falls with major injury during their stay. 0.5%
34% better than Arizona average

Arizona average: 0.8%

Ability to care for self at discharge Info Percentage of residents at or above expected ability to care for themselves at discharge. 58.6%
9% better than Arizona average

Arizona average: 53.7%

Successful return to home or community Info Rate of successful return to home or community from a skilled nursing facility. 69.3%
37% better than Arizona average

Arizona average: 50.6%

Penalties and fines

Federal penalties imposed by CMS for regulatory violations, including civil money penalties (fines) and denials of payment for new Medicare/Medicaid admissions.

Source: CMS Penalties Database (Data as of Jan 2026)

Total fines amount $3K
90% lower than Arizona average

Arizona average: $30K

Number of fines 1
40% fewer fines than Arizona average

Arizona average: 1.7

Payment Denials Info Serious action where Medicare and/or Medicaid temporarily stops payments for new residents until issues are fixed. 0
100% fewer payment denials than Arizona average

Arizona average: 0.1

Fines amount comparison
This facility $3K
Arizona average $30K
Penalty History

Penalties are imposed by CMS for violations of federal nursing home regulations.

Civil Money Penalty Info Fines imposed for noncompliance, which can be assessed per day or per instance of violation. Sep 5, 2023
$3K

Last updated: Jan 2026

Guides for Better Senior Living

Care Cost Calculator: See Prices in Your Area

Nursing Home Data Explorer

Don’t Wait Too Long: 7 Red Flag Signs Your Parent Needs Assisted Living Now

The True Cost of Assisted Living in 2025 – And How Families Are Paying For It

Understanding Senior Living Costs: Pricing Models, Discounts & Financial Assistance

Financial Aid for Arizona Seniors

Get financial aid guidance

Arizona Long Term Care System

ALTCS

Age 65+ or disabled, Arizona resident, Medicaid-eligible, nursing home-level care need.

~$2,829/month (300% FBR, individual).

$2,000 (individual), $3,000 (couple).

Covers tribal members; rural outreach.

Non-Medical Home and Community Based Services

AZ DES Non-Medical HCBS

Age 60+, Arizona resident, at risk of institutionalization.

~$2,000/month (individual, varies).

$10,000 (individual).

Limited funding; waitlists common.

Senior Community Service Employment Program (SCSEP)

AZ SCSEP

Age 55+, Arizona resident, unemployed, low-income.

~$1,519/month (125% of poverty level, individual).

Not specified; income-driven.

Wages at highest of federal/state/local minimum ($14.35/hour in 2025).

Weatherization Assistance Program (WAP)

AZ WAP

Age 60+ priority, Arizona resident, own/rent home, low-income.

~$2,510/month (200% of poverty level, individual).

Not applicable; income-focused.

High demand in rural desert areas; limited annual funds.

Section 202 Supportive Housing for the Elderly

AZ Section 202

Age 62+, Arizona resident, very low income, able to live independently with support.

~$1,645/month (50% of area median income, individual, varies by county).

$10,000 (individual, excludes home if owned).

Limited units; high demand in metro areas like Phoenix.

Arizona CARES Program

AZ CARES

Caregivers of Arizona residents 60+ needing help with 3+ daily activities; no caregiver age limit.

No strict limit; cost-sharing above ~$2,500/month threshold.

Not applicable; need-based.

Focus on rural access; complements ALTCS respite.

AZ DES Non-Medical Home and Community Based Services (HCBS)

AZ DES Non-Medical HCBS

Age 60+ or disabled, Arizona resident, need assistance with daily activities, not eligible for Medicaid/ALTCS.

Above Medicaid threshold but low-income (~$1,500-$2,500/month, varies by region).

Not specified; income-driven eligibility.

Targets those ineligible for ALTCS; prioritizes rural and tribal areas.

Tour Icon
Planning a tour? Check our touring checklist.
Chat Icon
Thinking of living here? We can help you speak to a current resident