Silver Heights Skilled Nursing and Rehabilitation
Nursing Home · Colorado, CO
CMS overall rating Info The Overall CMS Rating is scored from 1 to 5 stars and combines results from health inspections, staffing levels, and quality measures. Health inspections carry the most weight. Staffing and quality scores can increase or decrease the final rating based on performance compared to state and national standards.

Silver Heights Skilled Nursing and Rehabilitation

Nursing Home · Colorado, CO
CMS overall rating Info The Overall CMS Rating is scored from 1 to 5 stars and combines results from health inspections, staffing levels, and quality measures. Health inspections carry the most weight. Staffing and quality scores can increase or decrease the final rating based on performance compared to state and national standards.
Calculator: See prices in your area
Silver Heights Skilled Nursing and Rehabilitation accepts Medicaid and Medicare.

Overview of Silver Heights Skilled Nursing and Rehabilitation

Silver Heights Skilled Nursing and Rehabilitation provides patient-centered care with comprehensive services. The facility is certified by Medicare and Medicaid to provide 24-hour nursing care. It specializes in rehabilitation services to help residents achieve their highest level of function and independence.
(303) 688-3174

Quality ratings

Measured by Centers for Medicare & Medicaid Services (CMS)

Overall rating Info The Overall CMS Rating combines results from health inspections, staffing levels and quality measures. Health inspections carry the most weight. Staffing and quality scores can increase or decrease the final rating based on performance compared to state and national standards.
▼ 5.4% Below CO avg. ▼ 5.4% Below CO avg.Click the badge to see the full State ranking.Click here to see the full State ranking.
Health Inspection Info Based on the results of the facility's three most recent standard inspections and any complaint investigations. CMS reviews the number, scope, and severity of deficiencies, with more recent findings weighted more heavily.
▼ 28.6% Below CO avg. ▼ 28.6% Below CO avg.Click the badge to see the full State ranking.Click here to see the full State ranking.
Staffing Info Measures average nursing staff hours per resident per day, including Registered Nurses (RNs) and total nursing staff. Ratings are adjusted based on the level of care residents require and are compared to state and national benchmarks.
▼ 4.5% Below CO avg. ▼ 4.5% Below CO avg.Click the badge to see the full State ranking.Click here to see the full State ranking.
Quality Measures Info Based on clinical and physical health indicators reported to CMS, such as hospital readmissions, falls, pressure ulcers, and improvements in mobility. These measures reflect how well residents' health needs are being managed.
▲ 21.4% Above CO avg. ▲ 21.4% Above CO avg.Click the badge to see the full State ranking.Click here to see the full State ranking.

Staffing hours breakdown

Info Daily nursing hours per resident by staff type, reported to CMS. Higher is generally better — compare this facility to state and national averages to see where staffing stands.

Hours per resident per day — compared to Colorado state averages

Total nursing care / resident Info This home is ranked 76th out of 177 homes in Colorado. Total adjusted nursing hours per resident per day, combining RN, LPN, and aide time. CMS adjusts this for case-mix so facilities can be fairly compared.
3h 46m per day
Rank #76 / 177Nurse hours — State benchmarkedThis home is ranked 76th out of 177 homes in Colorado. Shows adjusted nurse hours per resident per day benchmarked to the Colorado average, with a ranking across 177 Colorado SNFs. More hours mean more direct care. The national average is about 3.5 hrs; below 3.0 is a red flag.Click the rank badge to see the full State ranking.Click here to see the full State ranking.
This facility Colorado avg (3h 51m per day)
vs Colorado avg
-2%

3 of 6 metrics below state avg

Staff typeHours / Day / Residentvs state avg
Registered Nurse (RN) Info RNs hold the highest nursing license and can assess residents, interpret test results, and direct care plans. More RN hours per day often signals stronger clinical oversight and faster response to health changes. 49m per day ■ Avg State avg: 50m per day · National avg: 41m per day
LPN / LVN Info Licensed Practical Nurses (LPNs) or Licensed Vocational Nurses (LVNs) deliver routine hands-on care — medication administration, wound dressing, and monitoring vital signs. They work under RN supervision and make up a large share of daily bedside care. 40m per day ■ Avg State avg: 41m per day · National avg: 52m per day
Nurse Aide Info Certified Nurse Aides (CNAs) provide the most direct day-to-day assistance: bathing, dressing, feeding, and mobility. Nurse aide hours are typically the largest staffing category and directly affect residents' quality of life. 1h 49m per day ▼ 17% State avg: 2h 12m per day · National avg: 2h 20m per day
Weekend Total Nursing Info Combined nursing hours (RN + LPN + Nurse Aide) per resident per day on weekends. Staffing often drops on weekends — this figure reveals whether the facility maintains adequate coverage outside of weekday hours. 2h 43m per day ▼ 17% State avg: 3h 16m per day · National avg: 3h 26m per day
Physical Therapist Info Hours per resident per day provided by licensed Physical Therapists (PTs) or PT Assistants. PT services help residents recover mobility after injury or illness and are especially important for post-acute (short-stay) rehabilitation. 5m per day ■ Avg State avg: 5m per day · National avg: 4m per day
Weekend RN Info Registered nurse hours specifically on weekends. Facilities sometimes reduce RN presence on Saturdays and Sundays — a low weekend RN figure compared to weekday hours can indicate reduced clinical oversight when most administrative staff are absent. 33m per day ▼ 8% State avg: 36m per day · National avg: 28m per day

Capacity and availability

This home usually has availability

Occupancy lower than 85% suggests more openings may be available.

Lower occupancy than the Colorado average: 76.5%
Occupancy rate 61.2% Rank #143 / 185Occupancy rate — State benchmarkedThis home is ranked 143rd out of 185 homes in Colorado. Shows this facility's occupancy rate versus the Colorado average, with its Statewide rank out of 185. Higher occupancy signals strong local demand and financial stability.Click the rank badge to see the full State ranking.Click here to see the full State ranking.
Occupancy rate
61.2% Rank #143 / 185Occupancy rate — State benchmarkedThis home is ranked 143rd out of 185 homes in Colorado. Shows this facility's occupancy rate versus the Colorado average, with its Statewide rank out of 185. Higher occupancy signals strong local demand and financial stability.Click the rank badge to see the full State ranking.Click here to see the full State ranking.
Bed community size
91-bed community Rank #204 / 542Bed count — State benchmarkedThis home is ranked 204th out of 542 homes in Colorado. Shows this facility's certified or reported bed count compared to other Colorado SNFs. Larger communities may offer more amenities, programs, and on-site services for residents and families.Click the rank badge to see the full State ranking.Click here to see the full State ranking.
A larger shared setting that may offer more common spaces and organized community services.
Walk Score
Walk Score: 80 / 100 Rank #108 / 875Walk Score — State benchmarkedThis home is ranked 108th out of 875 homes in Colorado. Shows how walkable this facility's neighborhood is compared to the average Walk Score across Colorado SNFs. Higher scores benefit residents, families, and staff.Click the rank badge to see the full State ranking.Click here to see the full State ranking.
Very walkable. Most errands can be accomplished on foot, and many essentials are within a short walk.

About this community

License Details

Facility TypeSnf/nf Dual Certification
StatusActive
CMS Certification Number065285

Ownership & Operating Entity

Silver Heights Skilled Nursing and Rehabilitation is administrated by Kathryn Evans.

Owner NameHome Street Operations, LLC

Payment & Insurance

2 services
Accept Medicaid
Accept Medicare

Therapy & Rehabilitation

2 services
Rehabilitation Services
Respite Care

Staffing & Medical

1 service
24-Hour Staffing

Additional Policies & Features

Pets Allowed

Amenities & Lifestyle

Specific ProgramsActivities of Daily Living (ADL) Training, Pulmonary Care, Sensory Program (Pain, Dementia, PTSD), Dialysis Support, IV Therapy, Tube Feeding, Respite Services (VA and Hospice), Transportation, Pet Friendly, Beautician Services and Community Re-Entry Programs, Hospice Services, Gait Training, Bed Mobility, Dysphagia Treatment, Aphasia/Cognitive Impairment Treatment, Rehab Dining, Home Therapy Assessment, PT, OT, and SLP Therapy, Individual and group counseling including addiction
Operating Hours10AM-8PM

Dining & Nutrition

Food DescriptionRehab dining and beautician services are available.

Contact Silver Heights Skilled Nursing and Rehabilitation

Inspection History

In Colorado, the Department of Public Health and Environment, Health Facilities Division is the regulatory body that performs unannounced surveys and publishes facility inspection findings.

Read the full inspection reports for this facility, including detailed findings and corrective actions.

Show Inspection Reports

Health Inspection History

Inspections since 2022
Total health inspections 6

Colorado average 4.8


Last Health inspection on Apr 2025

Total health citations
33 Rank #135 / 182Health citations — State benchmarkedThis home is ranked 135th out of 182 homes in Colorado. Shows this facility's total health deficiency citations benchmarked to the Colorado State average, with a ranking across all 182 CO SNFs. Lower citation counts earn a better rank.Click the rank badge to see the full State ranking.Click here to see the full State ranking.

Colorado average 24.8

Citations per inspection
5.5 Rank #109 / 182Citations per inspection — State benchmarkedThis home is ranked 109th out of 182 homes in Colorado. Shows average deficiency citations per CMS inspection for this facility versus the Colorado mean across 182 SNFs with citation data. Lower is better.Click the rank badge to see the full State ranking.Click here to see the full State ranking.

Colorado average 5.2


Health citations are formal notices following inspections when they fail to comply with safety and care standards.

22 of 33 citations resulted from standard inspections; 8 of 33 resulted from complaint investigations; and 3 of 33 came from combined inspections (standard and complaint).

Breakdown of citation severity (last 4 years)
Critical Health citations
0
100% better than Colorado average

Colorado average: 0.4


Serious Health citations
0
100% better than Colorado average

Colorado average: 2.1

0 critical citations Colorado average: 0.4

0 serious citations Colorado average: 2.1

33 moderate citations Colorado average: 22.2

0 minor citations Colorado average: 0.2
Citations history (last 4 years)
Abuse/Neglect moderate citation Apr 03, 2025
Corrected

Infection Control moderate citation Apr 03, 2025
Corrected

Infection Control moderate citation Apr 03, 2025
Corrected

Pharmacy moderate citation Apr 03, 2025
Corrected

Staffing Data

Reporting period: October 1 – December 31, 2025 (Q4 2025). Source: CMS Payroll-Based Journal report.

Total staff 107
Employees 46
Contractors 61
Staff to resident ratio 1.95:1
0% compared with Colorado average
Colorado average ratio: 1.88:1 Colorado average ratio: 1.88:1See full Colorado ranking
Avg staff/day 22
Average shift 9 hours
8% better than Colorado average
Colorado average: 8.3 hours Colorado average shift: 8.3 hoursSee full Colorado ranking
Total staff hours (quarter) 18,285

Nursing staff breakdown

Q4 2025 · Oct 1 – Dec 31 More info This data comes from the CMS Payroll-Based Journal report covering October 1 – December 31, 2025.
Registered Nurse

Manages medical care and health needs.

RN Staff 34
Average shift length Info Average shift length. Calculated as total hours divided by days worked and average staff per day. 9.2 hours

This role is partially covered by contractors.

Licensed Practical Nurse

Assists with medical care and medications.

LPN Staff 9
Average shift length Info Average shift length. Calculated as total hours divided by days worked and average staff per day. 10.3 hours

This role is partially covered by contractors.

Certified Nursing Assistant

Helps with daily care and mobility.

CNA Staff 48
Average shift length Info Average shift length. Calculated as total hours divided by days worked and average staff per day. 9.3 hours

This role is partially covered by contractors.

Contractor staffing

Q4 2025 · Oct 1 – Dec 31 More info This data comes from the CMS Payroll-Based Journal report covering October 1 – December 31, 2025.

Total hours from contractors

14.9%

2,721 contractor hours this quarter

Certified Nursing Assistant: 28 Registered Nurse: 28 Licensed Practical Nurse: 5

Staff by category

Q4 2025 · Oct 1 – Dec 31 More info This data comes from the CMS Payroll-Based Journal report covering October 1 – December 31, 2025.
Certified Nursing Assistant2028488,29992100%9.3
Registered Nurse628342,57692100%9.2
Licensed Practical Nurse4591,9989199%10.3
Clinical Nurse Specialist2029446571%8
Physical Therapy Assistant2025996065%8.2
Administrator2025206571%8
Nurse Practitioner1015126470%8
Dental Services Staff1015046368%8
Dietitian1014886166%8
Qualified Social Worker1014806065%8
Respiratory Therapy Technician2024325661%7.7
Other Dietary Services Staff1014035257%7.8
Physical Therapy Aide2023774347%8.2
Qualified Activities Professional1011531921%8
48 Certified Nursing Assistant
% of Days 100%
34 Registered Nurse
% of Days 100%
9 Licensed Practical Nurse
% of Days 99%
2 Clinical Nurse Specialist
% of Days 71%
2 Physical Therapy Assistant
% of Days 65%
2 Administrator
% of Days 71%
1 Nurse Practitioner
% of Days 70%
1 Dental Services Staff
% of Days 68%
1 Dietitian
% of Days 66%
1 Qualified Social Worker
% of Days 65%
2 Respiratory Therapy Technician
% of Days 61%
1 Other Dietary Services Staff
% of Days 57%
2 Physical Therapy Aide
% of Days 47%
1 Qualified Activities Professional
% of Days 21%

Penalties and fines

Federal penalties imposed by CMS for regulatory violations, including civil money penalties (fines) and denials of payment for new Medicare/Medicaid admissions.

Source: CMS Penalties Database (Data as of Jan 2026)

Total fines amount $3K Rank #70 / 182Federal fines — State benchmarkedThis home is ranked 70th out of 182 homes in Colorado. Shows this facility's cumulative CMS federal fine dollars versus the Colorado average among facilities with fines, and where it ranks among 182 skilled nursing facilities in the pool. Lower total dollars mean a better rank.Click the rank badge to see the full State ranking.Click here to see the full State ranking.
92% lower than Colorado average

Colorado average: $40K

Number of fines 1
55% fewer fines than Colorado average

Colorado average: 2.2

Payment Denials Info Serious action where Medicare and/or Medicaid temporarily stops payments for new residents until issues are fixed. 0
100% fewer payment denials than Colorado average

Colorado average: 0.3

Fines amount comparison
This facility $3K
Colorado average $40K

No penalties in the past 3 years

No civil money penalties or payment denials were reported in the last 3 years.

Quality of care over time

These measures show how residents usually do over time at this home, based on health outcomes and preventive care.

High-risk clinical events score Info A composite score based on pressure ulcers, falls with injury, weight loss, walking ability decline, and activities of daily living decline. 8.2
9% better than Colorado average

Colorado average: 9.0

Functional decline score Info A composite score based on activities of daily living decline, walking ability decline, and incontinence. 19.8
5% worse than Colorado average

Colorado average: 18.8

Long-stay resident measures
Significantly above average Colorado avg: 3.9 Info CMS star rating based on long-stay quality measure performance. 5 stars = significantly above average, 1 star = significantly below average.
Need for Help with Daily Activities Increased Info Percent of long-stay residents whose need for help with daily activities has increased 17.1%
7% worse than Colorado average

Colorado average: 16.0%

Walking Ability Worsened Info Percent of long-stay residents whose ability to move independently worsened 12.5%
27% better than Colorado average

Colorado average: 17.0%

Low Risk Residents with Bowel/Bladder Incontinence Info Percent of low risk long-stay residents who lose control of their bowels or bladder 29.7%
28% worse than Colorado average

Colorado average: 23.2%

Falls with Major Injury Info Percent of long-stay residents experiencing one or more falls with major injury 5.0%
51% worse than Colorado average

Colorado average: 3.3%

High Risk Residents with Pressure Ulcers Info Percent of long-stay high risk residents with pressure ulcers 3.1%
21% better than Colorado average

Colorado average: 3.9%

Urinary Tract Infection Info Percent of long-stay residents with a urinary tract infection 0.9%
35% better than Colorado average

Colorado average: 1.4%

Lost Too Much Weight Info Percent of long-stay residents who lose too much weight 3.2%
38% better than Colorado average

Colorado average: 5.2%

Depressive Symptoms Info Percent of long-stay residents who have depressive symptoms 7.6%
6% worse than Colorado average

Colorado average: 7.2%

Antipsychotic Use Info Percent of long-stay residents who received an antipsychotic medication 28.6%
52% worse than Colorado average

Colorado average: 18.8%

Pneumococcal Vaccine Info Percent of long-stay residents assessed and appropriately given the pneumococcal vaccine 90.0%
In line with Colorado average

Colorado average: 93.3%

Influenza Vaccine Info Percent of long-stay residents assessed and appropriately given the seasonal influenza vaccine 86.9%
8% worse than Colorado average

Colorado average: 94.7%

Hospitalizations per 1,000 days Info Number of hospitalizations per 1,000 long-stay resident days. 0.90
31% better than Colorado average

Colorado average: 1.30

ED visits per 1,000 days Info Number of outpatient emergency department visits per 1,000 long-stay resident days. 0.49
71% better than Colorado average

Colorado average: 1.67

Short-stay resident measures
Pneumococcal Vaccine Info Percent of short-stay residents assessed and appropriately given the pneumococcal vaccine 91.3%
19% better than Colorado average

Colorado average: 76.6%

Antipsychotic medication increase Info Percent of short-stay residents who newly received an antipsychotic medication 0.0%
100% better than Colorado average

Colorado average: 1.4%

Influenza Vaccine Info Percent of short-stay residents assessed and appropriately given the seasonal influenza vaccine 81.3%
7% better than Colorado average

Colorado average: 75.6%

Facility Characteristics

Source: CMS Long-Term Care Facility Characteristics (Data as of Jan 2026)

Total residents 55
Medicare
1
1.8% of residents
Medicaid
33
60% of residents
Private pay or other
21
38.2% of residents
Programs & Services
Residents Group

Residents meet regularly to discuss policies, care quality, and activities

Active Resident Council

Organized group of residents that meets regularly to discuss facility policies, quality of life, and activities.

Finances and operations

Privately-owned community
Home revenue
$7.9M
Profit
$400.4K
Privately-owned community
Home revenue
$7.9M Rank #146 / 182Revenue — State benchmarkedThis home is ranked 146th out of 182 homes in Colorado. Shows this facility's annual revenue compared to the Colorado SNF average. Higher revenue generally means more resources for staffing and capital — read alongside Payroll %.Click the rank badge to see the full State ranking.Click here to see the full State ranking.
Profit
$400.4K
Payroll costs Info The portion of the home's budget spent on staff, including nurses, caregivers, and other employees who support care and operations. Rank #139 / 182Payroll — State benchmarkedThis home is ranked 139th out of 182 homes in Colorado. Shows total annual staff payroll benchmarked to the Colorado average. Higher payroll investment relative to peers often signals better staffing and less reliance on cheaper contract labor.Click the rank badge to see the full State ranking.Click here to see the full State ranking.
$4.3M
54.5% of revenue Rank #89 / 182Payroll % — State benchmarkedThis home is ranked 89th out of 182 homes in Colorado. Shows payroll as a percentage of revenue versus the Colorado average. Well-run Colorado SNFs typically land around 59–66% — the top third Statewide. Below 25% may signal understaffing or heavy agency use — read with Staffing ratings.Click the rank badge to see the full State ranking.Click here to see the full State ranking.
Other operating costs Info All remaining costs needed to run the home, such as food, utilities, building maintenance, supplies and administrative expenses.
$3.2M
Total costs $7.5M

Places of interest near Silver Heights Skilled Nursing and Rehabilitation

Address 0.0 miles from city center Info Estimated distance in miles from Castle Rock's city center to Silver Heights Skilled Nursing and Rehabilitation's address, calculated via Google Maps.

Calculate Travel Distance to Silver Heights Skilled Nursing and Rehabilitation

Add your location

Address

Financial Assistance for
Nursing Home in Colorado

Silver Heights Skilled Nursing and Rehabilitation is located in CASTLE ROCK, Colorado.
Here are the financial assistance programs available to residents in Colorado.

Get Financial aid guidance

Elderly, Blind, and Disabled Waiver

Colorado Medicaid EBD Waiver

Age 65+ or disabled
General Colorado resident, Medicaid- eligible, nursing home-level care need.
Income Limits (2025) ~$2,829/month 300% FBR, individual
Asset Limits $2,000 (individual), $3,000 (couple).
CO

Requires level-of-care assessment by case manager.

Benefits
Personal care (5-7 hours/day) Respite care (up to 240 hours/year) Adult day care ($65/day) Home modifications ($1,500 avg.)

Old Age Pension (OAP) Health Care Program

Colorado OAP

Age 60+
General Colorado resident.
Income Limits ~$1,215/month individual
Asset Limits $2,000 individual
CO

Supplements SSI; limited medical coverage.

Benefits
Cash (~$100-$800/month) Limited in-home care (2-3 hours/week) Medical assistance

Program of All-Inclusive Care for the Elderly (PACE)

Colorado Medicaid PACE

Age 55+
General Colorado resident, nursing home-level care need, safe with PACE support.
Income Limits (2025) ~$2,829/month 300% FBR
Asset Limits $2,000 (individual), $3,000 (couple).
CO

Limited to specific regions (e.g., Denver, Pueblo).

Benefits
All-inclusive care—personal care (5-7 hours/day) Meals Transportation Therapy Medical visits

Home Care Allowance (HCA)

Colorado Home Care Allowance (HCA)

Age
General Seniors typically 65+, Age 5+ with disability, Colorado resident, financial/functional need.
Income Limits (2025) ~$1,004/month individual, stricter than waivers
Asset Limits $2,000 (individual), $3,000 (couple).
CO

Must need help with ADLs; not Medicaid-waiver eligible.

Benefits
Personal care (~4-6 hours/day, paid to provider) E.g. Bathing Dressing

Compare Nursing Home around Colorado

The information below is reported by the Colorado Department of Public Health and Environment, Health Facilities Division.

5 facilities compared · CMS & CO Dept. of Health data

Filter by care type
Peaks Care Center
NH

Nursing Home Licensed facility providing 24/7 skilled nursing care for residents with complex, ongoing medical needs. Staffed by RNs, LPNs, and CNAs. Inspected and star-rated annually by CMS. Accepts Medicare (short-term rehab) and Medicaid (long-term care).

AL

Assisted Living A licensed, long-term care setting for seniors or individuals with disabilities who need help with daily activities — like bathing, dressing, and medication management — but not 24-hour skilled nursing. Offers housing, meals, and around-the-clock support while aiming to maximize resident independence.

IL

Independent Living Lifestyle-focused communities for older adults offering dining, activities, and transportation with minimal personal care. Best for active, independent seniors who want community without medical support.

Longmont (Coffman Street)92 80.1% +5%3.50 +41%-9%$0224.4177A+ 80 Bogie33$11.7M$5.1M43.5%65189
Boulder Canyon Health and Rehabilitation
NH

Nursing Home Licensed facility providing 24/7 skilled nursing care for residents with complex, ongoing medical needs. Staffed by RNs, LPNs, and CNAs. Inspected and star-rated annually by CMS. Accepts Medicare (short-term rehab) and Medicaid (long-term care).

AL

Assisted Living A licensed, long-term care setting for seniors or individuals with disabilities who need help with daily activities — like bathing, dressing, and medication management — but not 24-hour skilled nursing. Offers housing, meals, and around-the-clock support while aiming to maximize resident independence.

IL

Independent Living Lifestyle-focused communities for older adults offering dining, activities, and transportation with minimal personal care. Best for active, independent seniors who want community without medical support.

MC

Memory Care Secured, specialized care for people living with Alzheimer's or dementia. Staff trained in cognitive impairment, with higher staff-to-resident ratios and an environment designed to reduce confusion and wandering risk.

Boulder (Park East)140 76.5% 0%3.45 -13%-11%$0224.4-109- 71 Ray Lauritzen$19.2M$8.7M45.5%65222
Life Care Center of Littleton
NH

Nursing Home Licensed facility providing 24/7 skilled nursing care for residents with complex, ongoing medical needs. Staffed by RNs, LPNs, and CNAs. Inspected and star-rated annually by CMS. Accepts Medicare (short-term rehab) and Medicaid (long-term care).

AL

Assisted Living A licensed, long-term care setting for seniors or individuals with disabilities who need help with daily activities — like bathing, dressing, and medication management — but not 24-hour skilled nursing. Offers housing, meals, and around-the-clock support while aiming to maximize resident independence.

Littleton120 80.6% +5%4.35 +29%+13%$0268.7197A+ 54 Sara Dent$18.4M$9.8M53.4%65370
Silver Heights Skilled Nursing and Rehabilitation
NH

Nursing Home Licensed facility providing 24/7 skilled nursing care for residents with complex, ongoing medical needs. Staffed by RNs, LPNs, and CNAs. Inspected and star-rated annually by CMS. Accepts Medicare (short-term rehab) and Medicaid (long-term care).

AL

Assisted Living A licensed, long-term care setting for seniors or individuals with disabilities who need help with daily activities — like bathing, dressing, and medication management — but not 24-hour skilled nursing. Offers housing, meals, and around-the-clock support while aiming to maximize resident independence.

Castle Rock91 61.2% -20%3.77 +126%-2%$3.3k335.5-52- 80 -$7.9M$4.3M54.5%65285
Woodlake Legacy Senior Living -
NH

Nursing Home Licensed facility providing 24/7 skilled nursing care for residents with complex, ongoing medical needs. Staffed by RNs, LPNs, and CNAs. Inspected and star-rated annually by CMS. Accepts Medicare (short-term rehab) and Medicaid (long-term care).

AL

Assisted Living A licensed, long-term care setting for seniors or individuals with disabilities who need help with daily activities — like bathing, dressing, and medication management — but not 24-hour skilled nursing. Offers housing, meals, and around-the-clock support while aiming to maximize resident independence.

IL

Independent Living Lifestyle-focused communities for older adults offering dining, activities, and transportation with minimal personal care. Best for active, independent seniors who want community without medical support.

MC

Memory Care Secured, specialized care for people living with Alzheimer's or dementia. Staff trained in cognitive impairment, with higher staff-to-resident ratios and an environment designed to reduce confusion and wandering risk.

Lakewood (Foothills)131 51.4% -33%------------ 71 #N/A$7.6M$3.1M41%65374

Frequently Asked Questions about Silver Heights Skilled Nursing and Rehabilitation

Who is the owner of Silver Heights Skilled Nursing and Rehabilitation?

The legal owner and operator of Silver Heights Skilled Nursing and Rehabilitation is Home Street Operations, Llc.

Is Silver Heights Skilled Nursing and Rehabilitation in a walkable area?

Silver Heights Skilled Nursing and Rehabilitation has a walk score of 80. Very walkable. Most errands can be accomplished on foot, and many essentials are within a short walk.

Who is the administrator of Silver Heights Skilled Nursing and Rehabilitation?

Kathryn Evans is the administrator of Silver Heights Skilled Nursing and Rehabilitation.

How many beds does Silver Heights Skilled Nursing and Rehabilitation have?

Silver Heights Skilled Nursing and Rehabilitation has 91 beds.

Are there photos of Silver Heights Skilled Nursing and Rehabilitation?

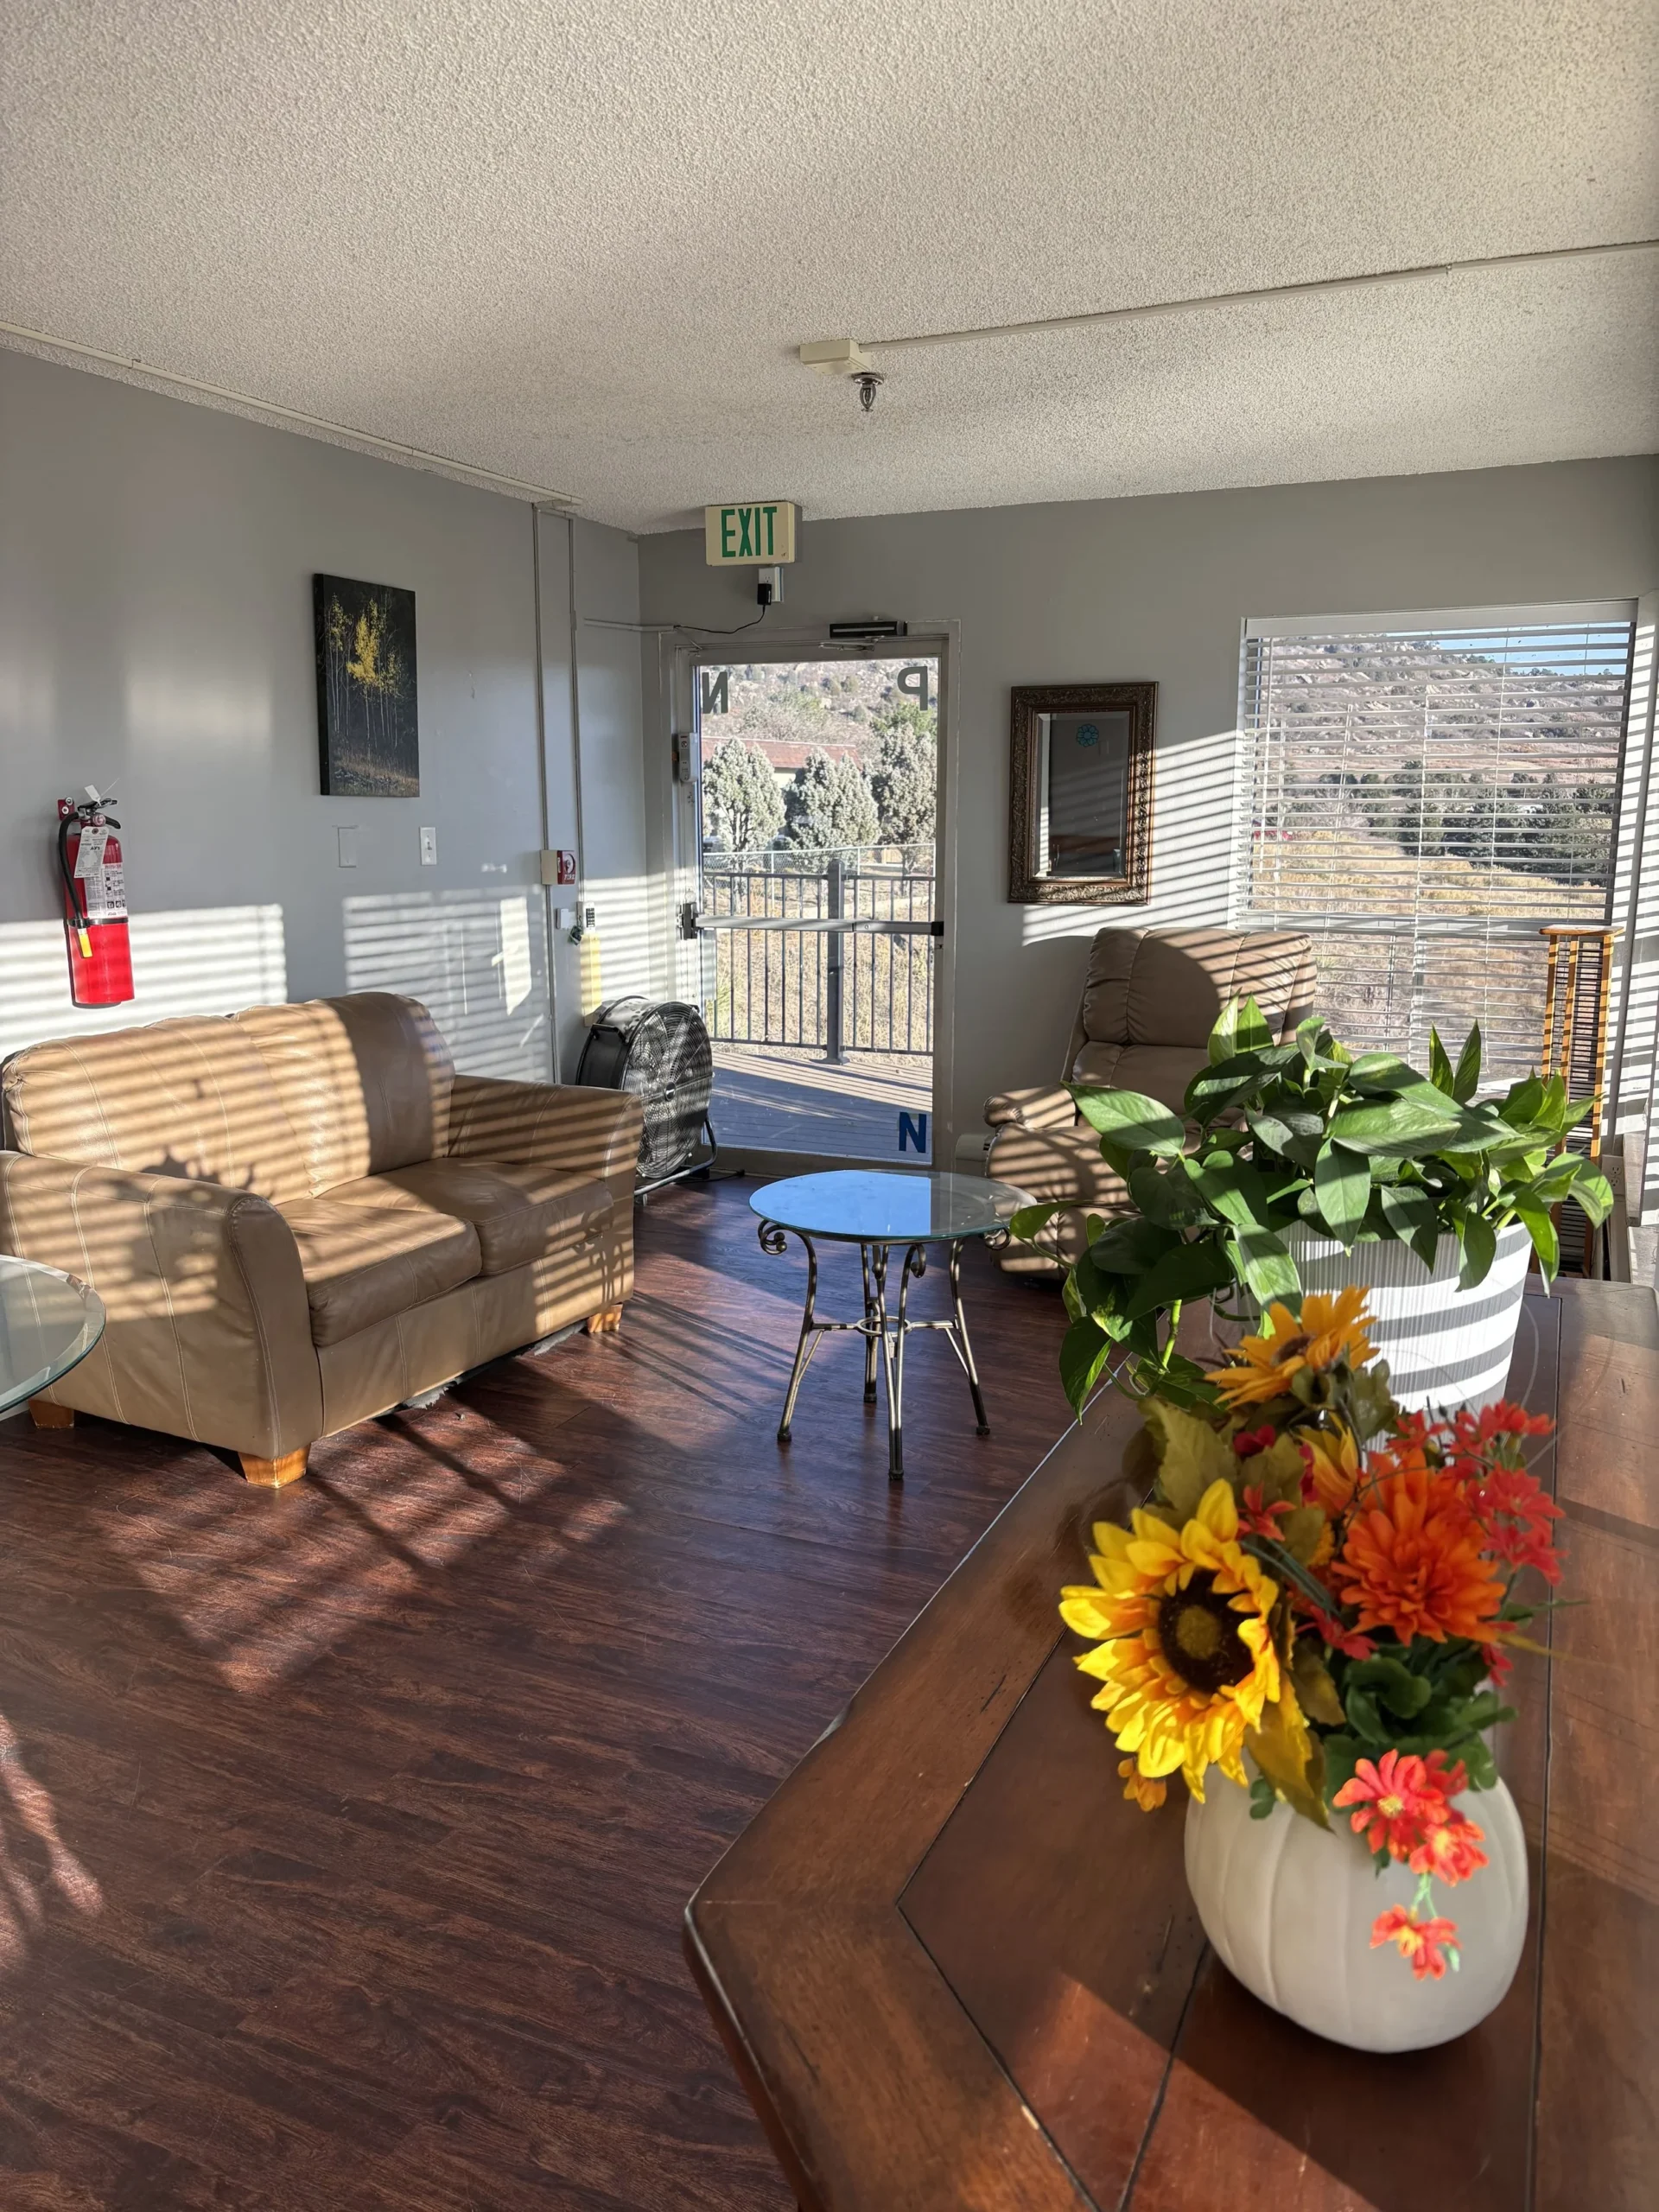
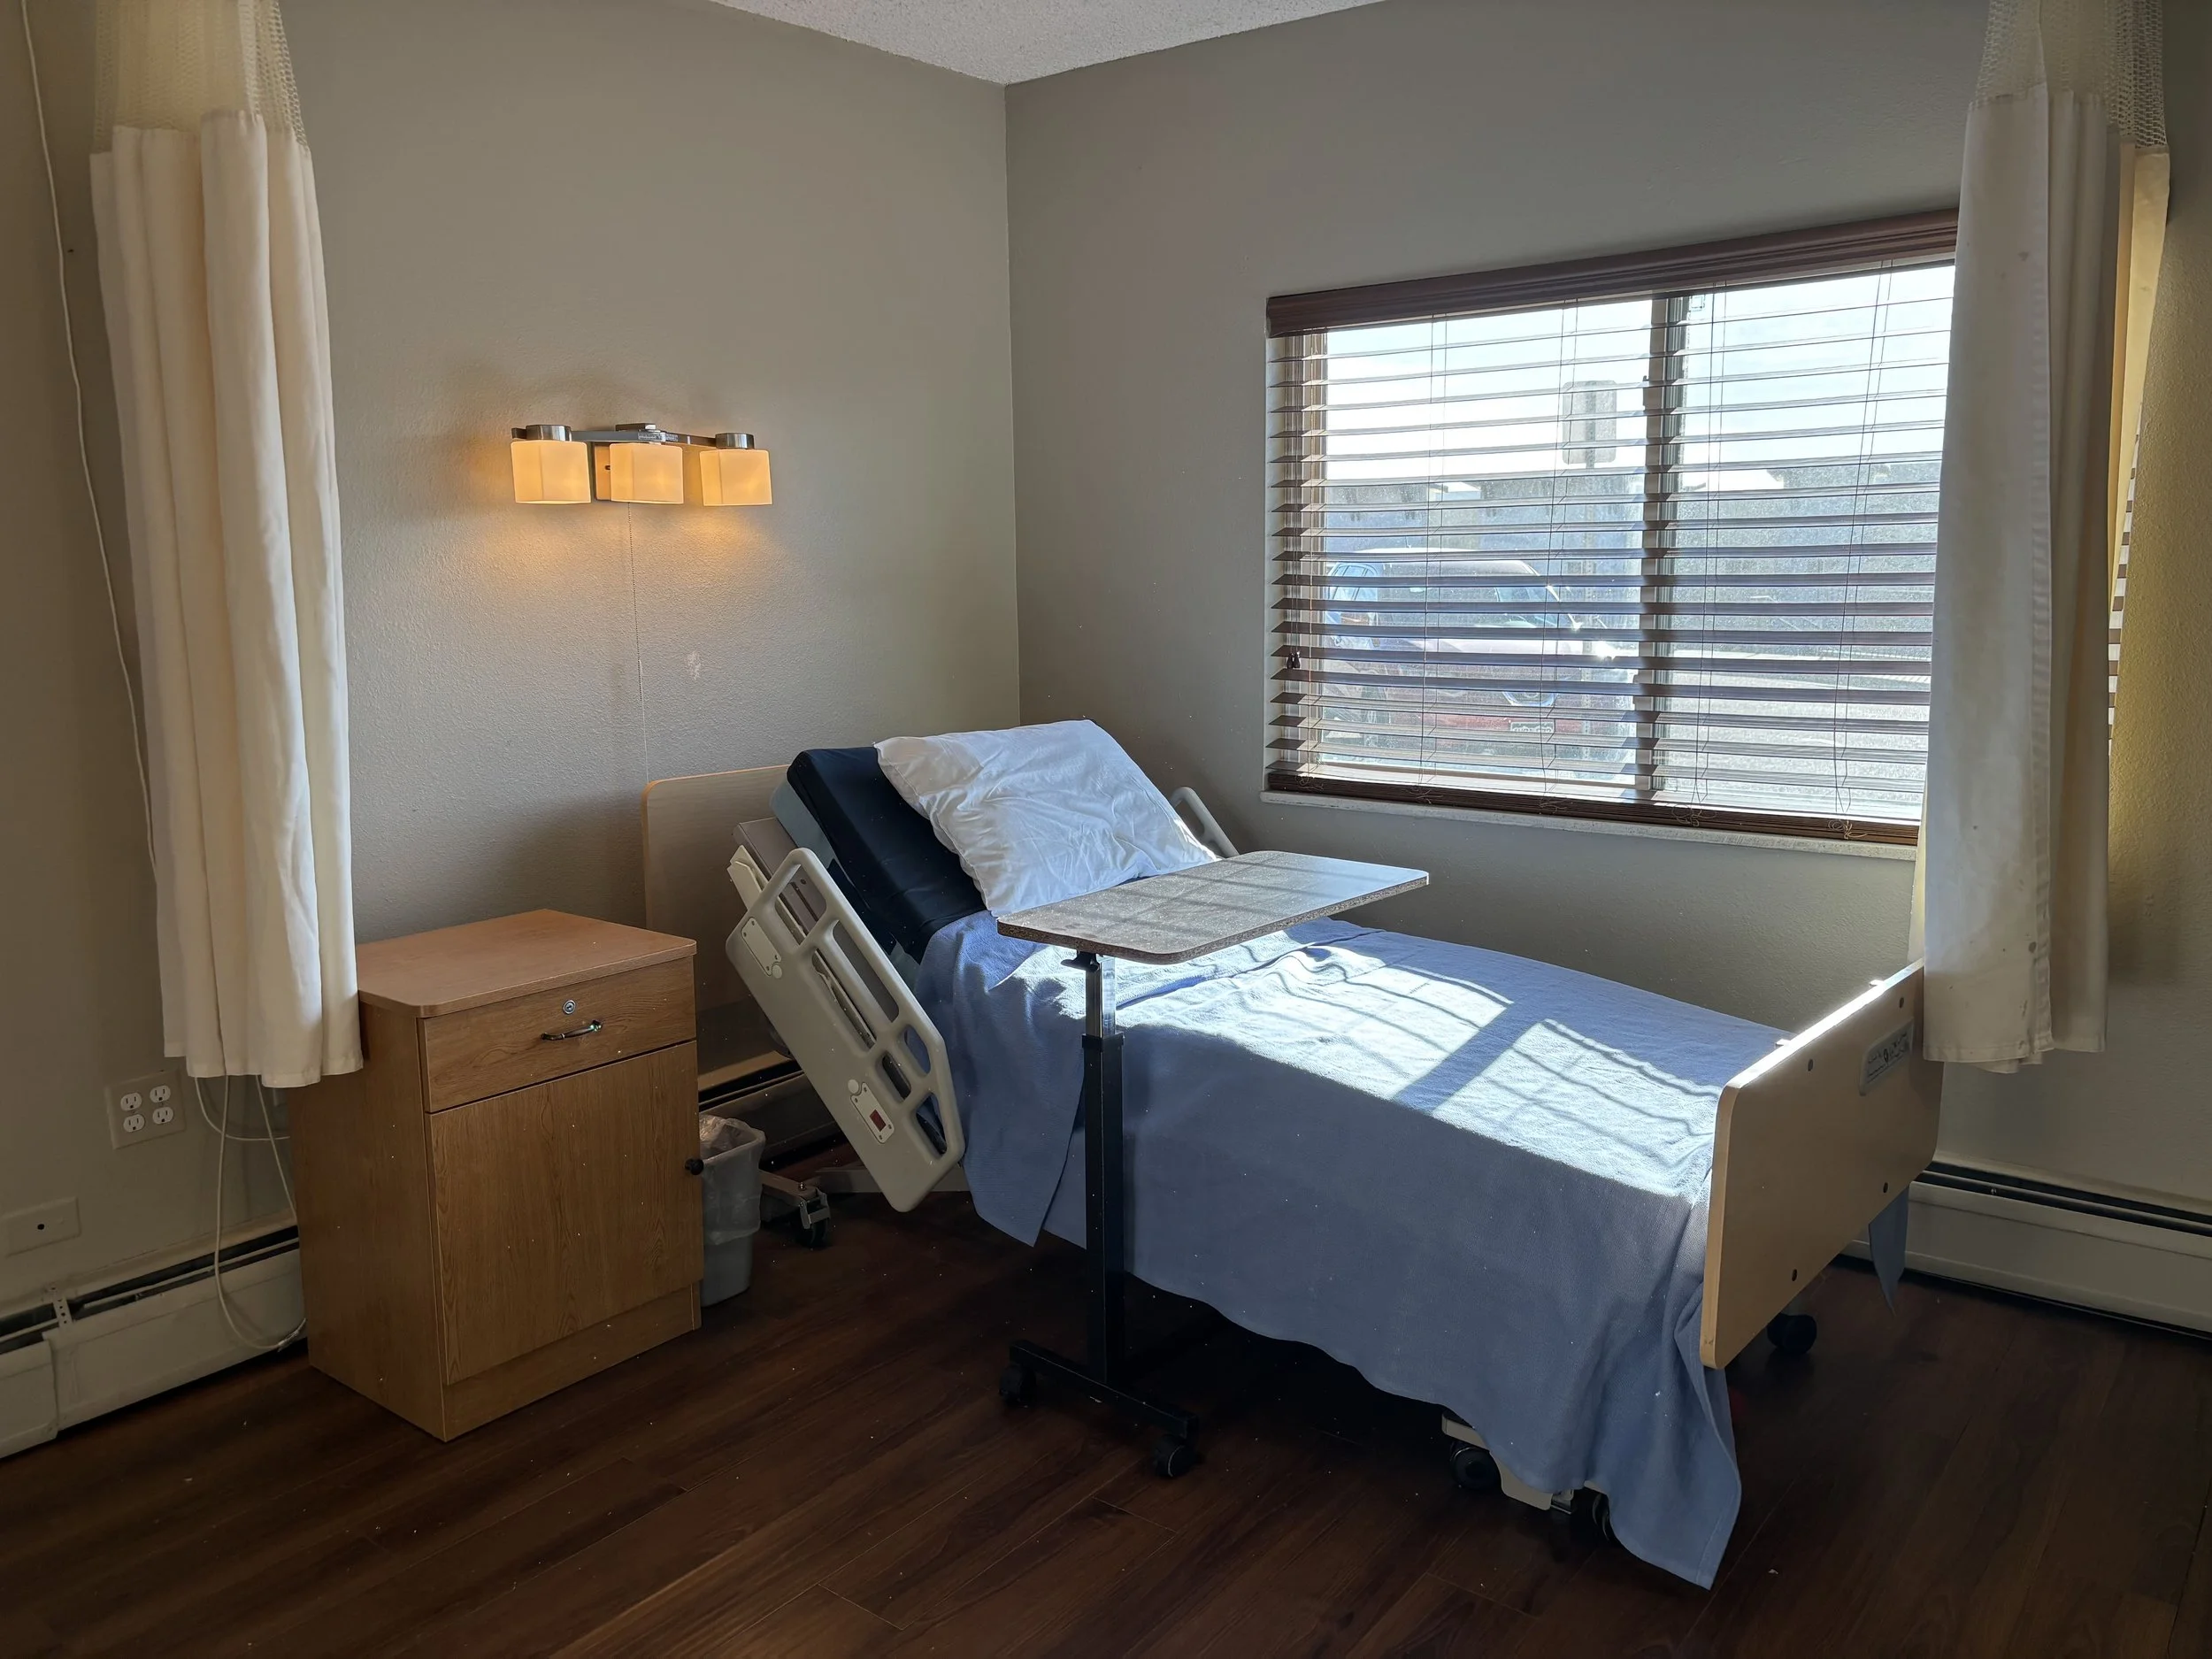
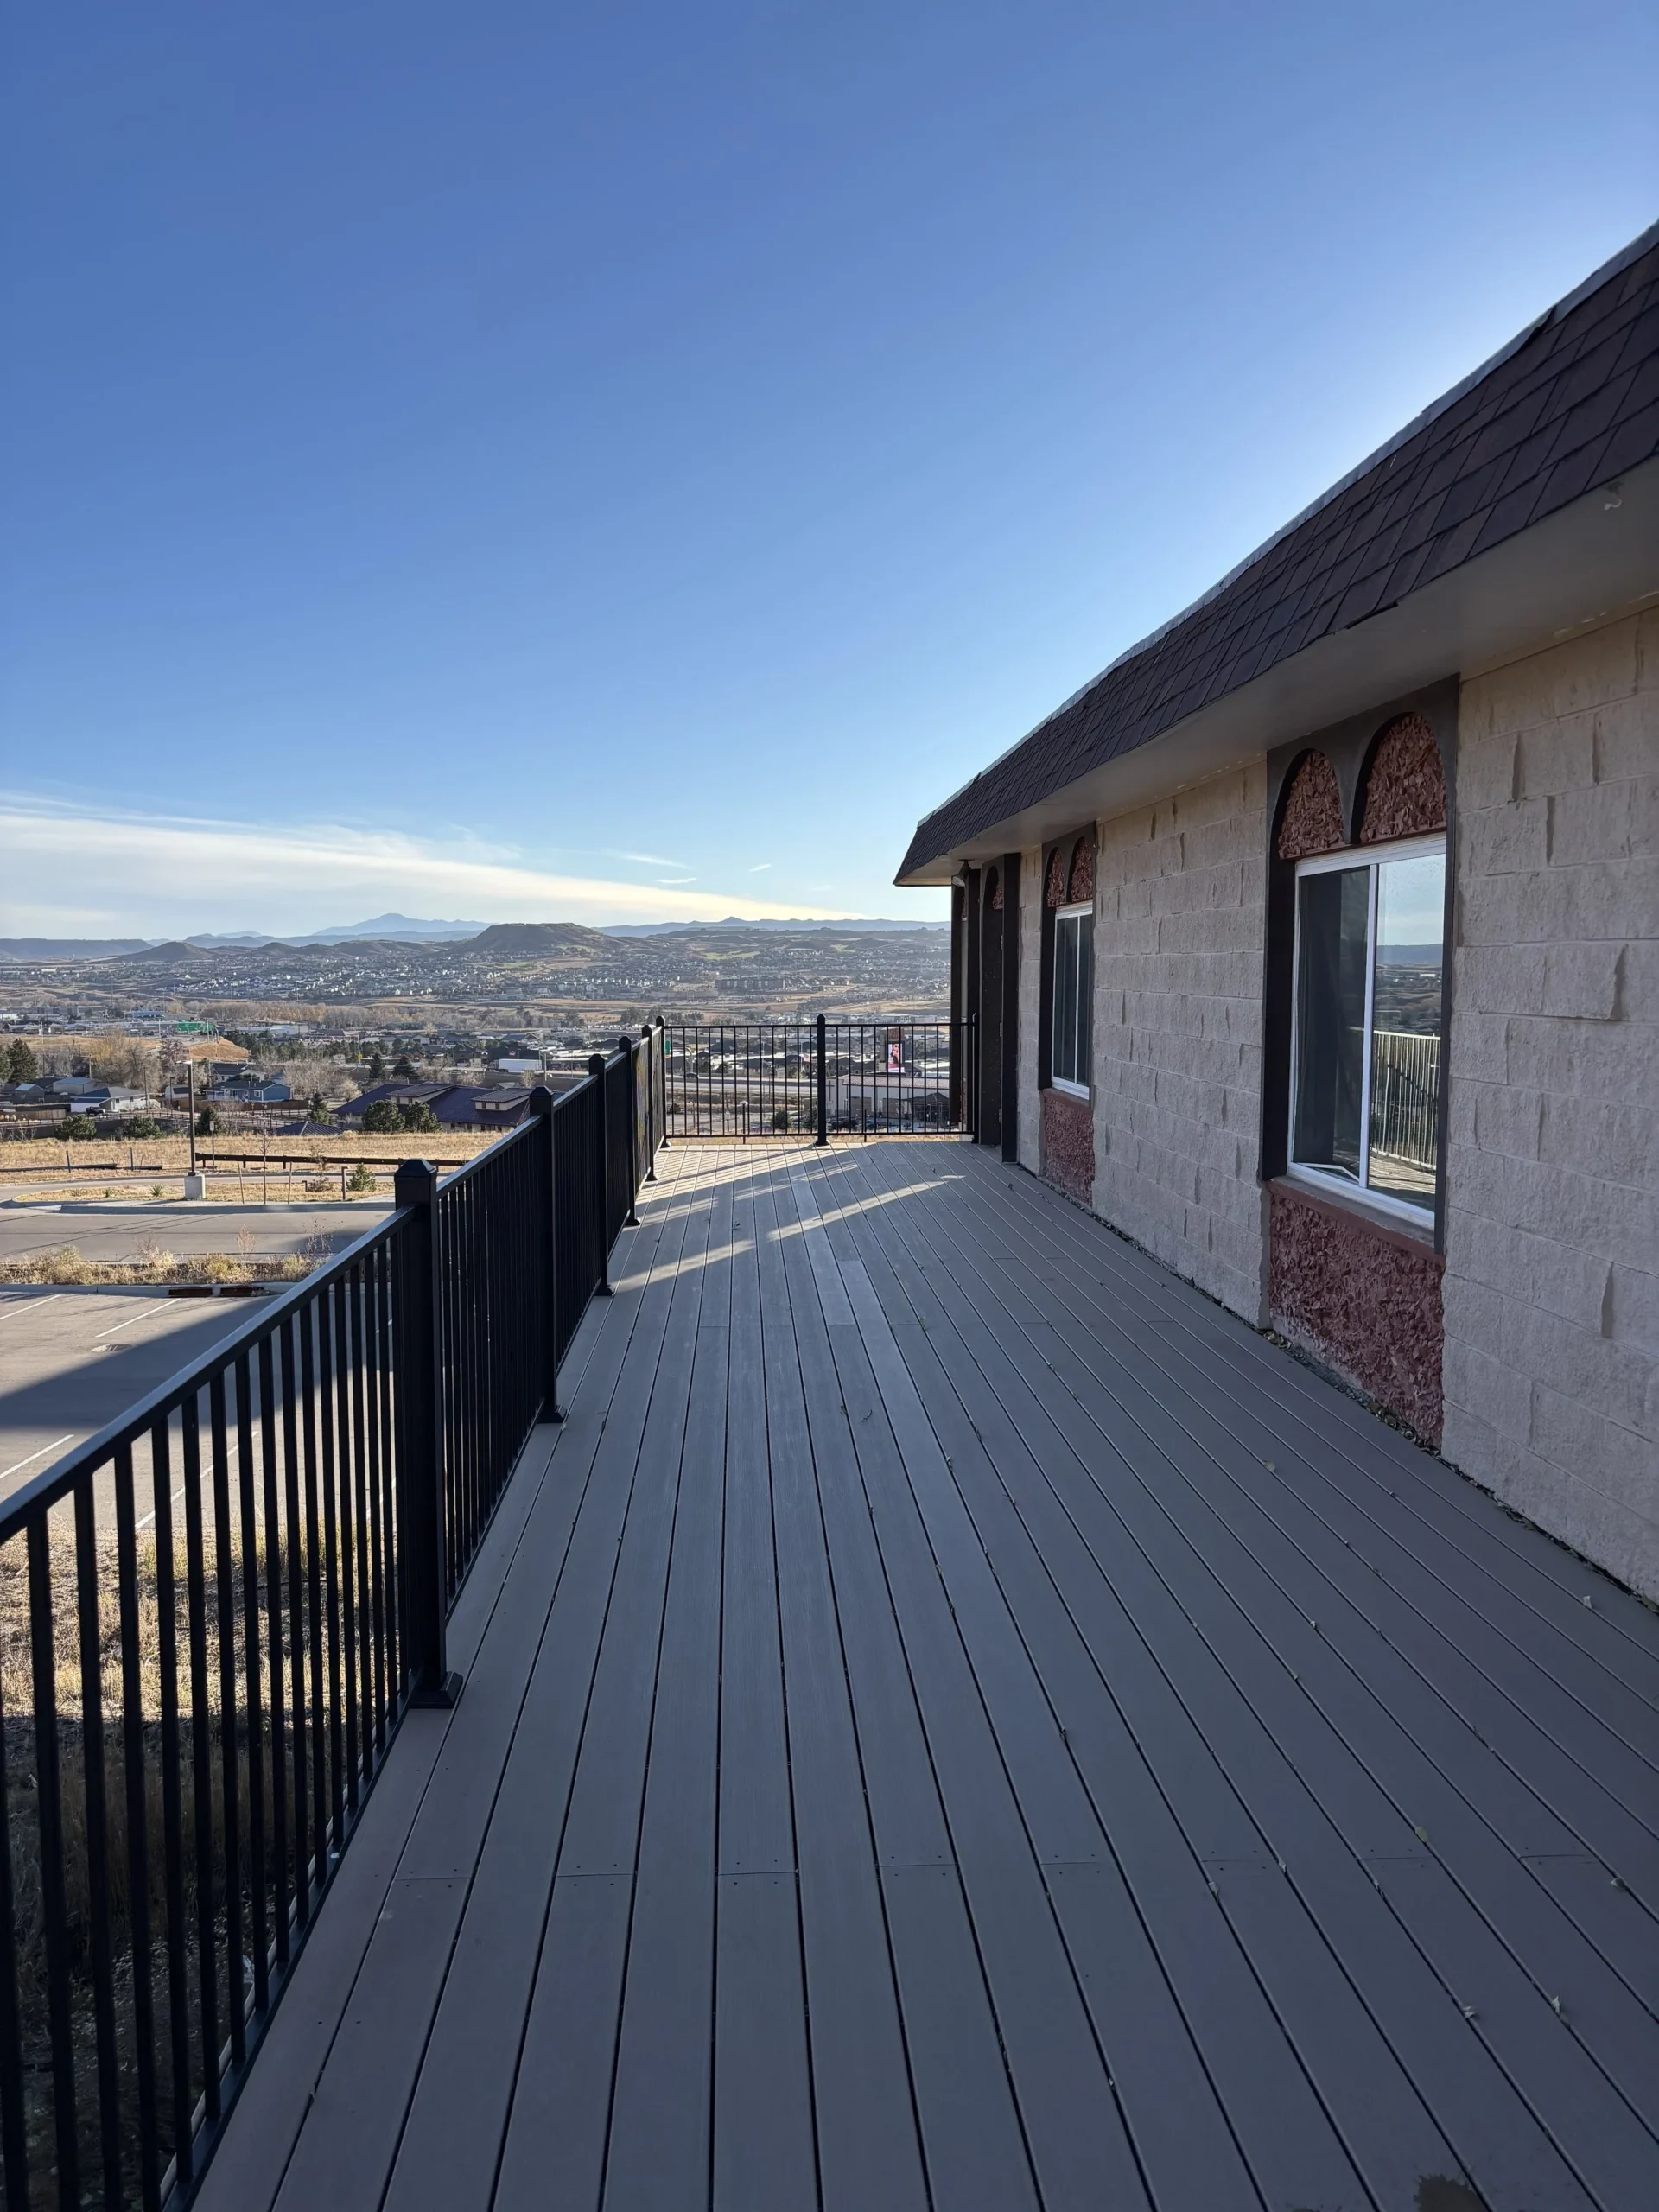
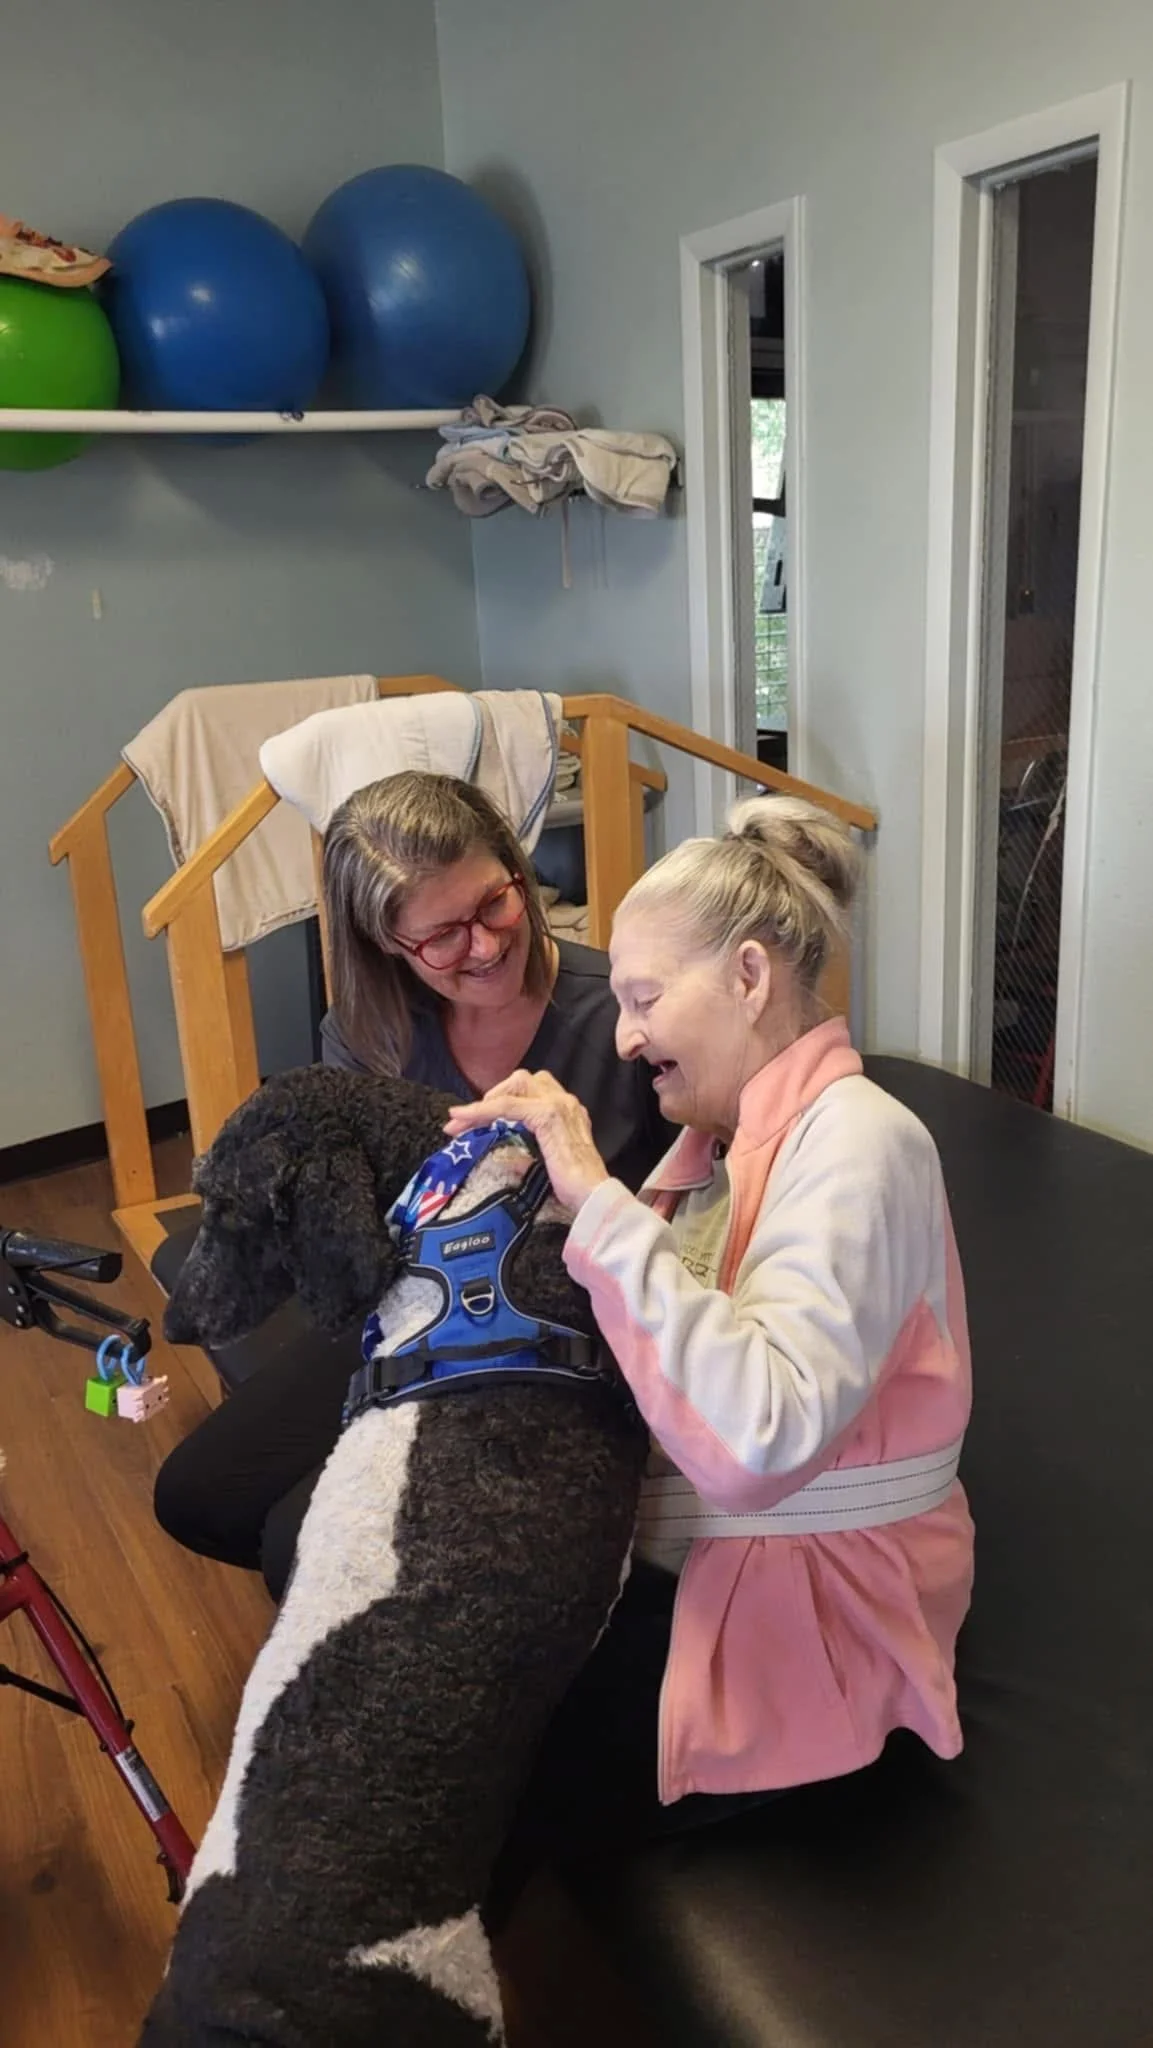
Yes — there are 9 photos of Silver Heights Skilled Nursing and Rehabilitation in the photo gallery on this page.

What is the address of Silver Heights Skilled Nursing and Rehabilitation?

Silver Heights Skilled Nursing and Rehabilitation is located at 4001 HOME ST.

What is the phone number of Silver Heights Skilled Nursing and Rehabilitation?

(303) 688-3174 will put you in contact with the team at Silver Heights Skilled Nursing and Rehabilitation.

Guides for Better Senior Living

Care Cost Calculator: See Prices in Your Area

Nursing Home Data Explorer

Don’t Wait Too Long: 7 Red Flag Signs Your Parent Needs Assisted Living Now

The True Cost of Assisted Living in 2025 – And How Families Are Paying For It

Understanding Senior Living Costs: Pricing Models, Discounts & Financial Assistance

Explore Open Rooms
1 Contact details
2 What type of senior care service are you looking for?
3 What budget do you have in mind for senior care?
4 How soon do you need to find care?
5 Additional details

Thank you for your interest!

Our team will be in touch shortly to help with next steps.