


Silverado Frederick Memory Care Community
Assisted Living & Memory Care · Frederick, MD
Silverado Frederick Memory Care Community
Assisted Living & Memory Care · Frederick, MD
Overview of Silverado Frederick Memory Care Community
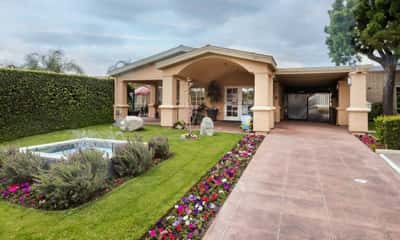
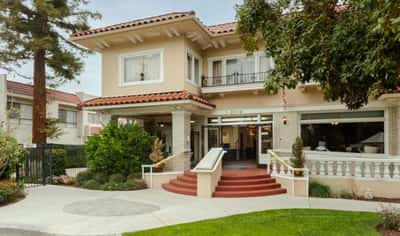
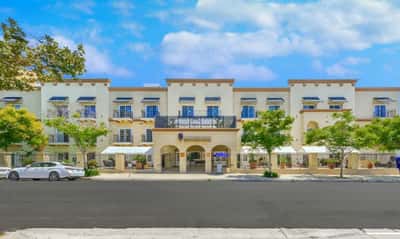
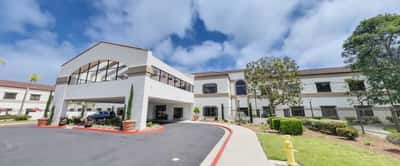
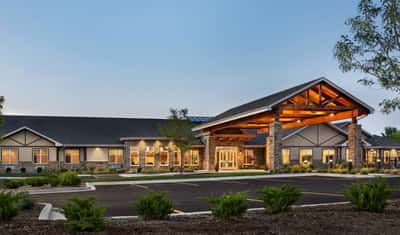
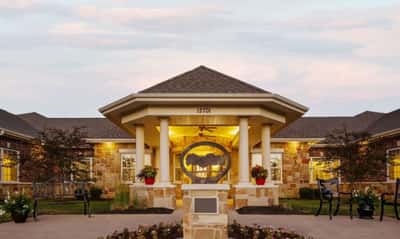
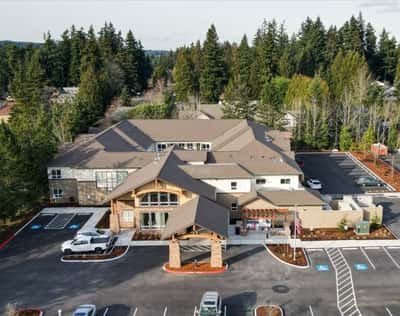
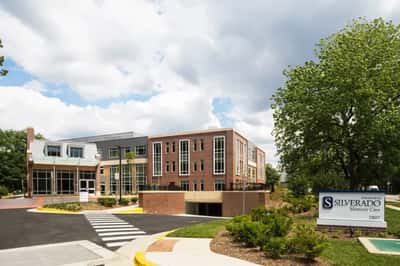
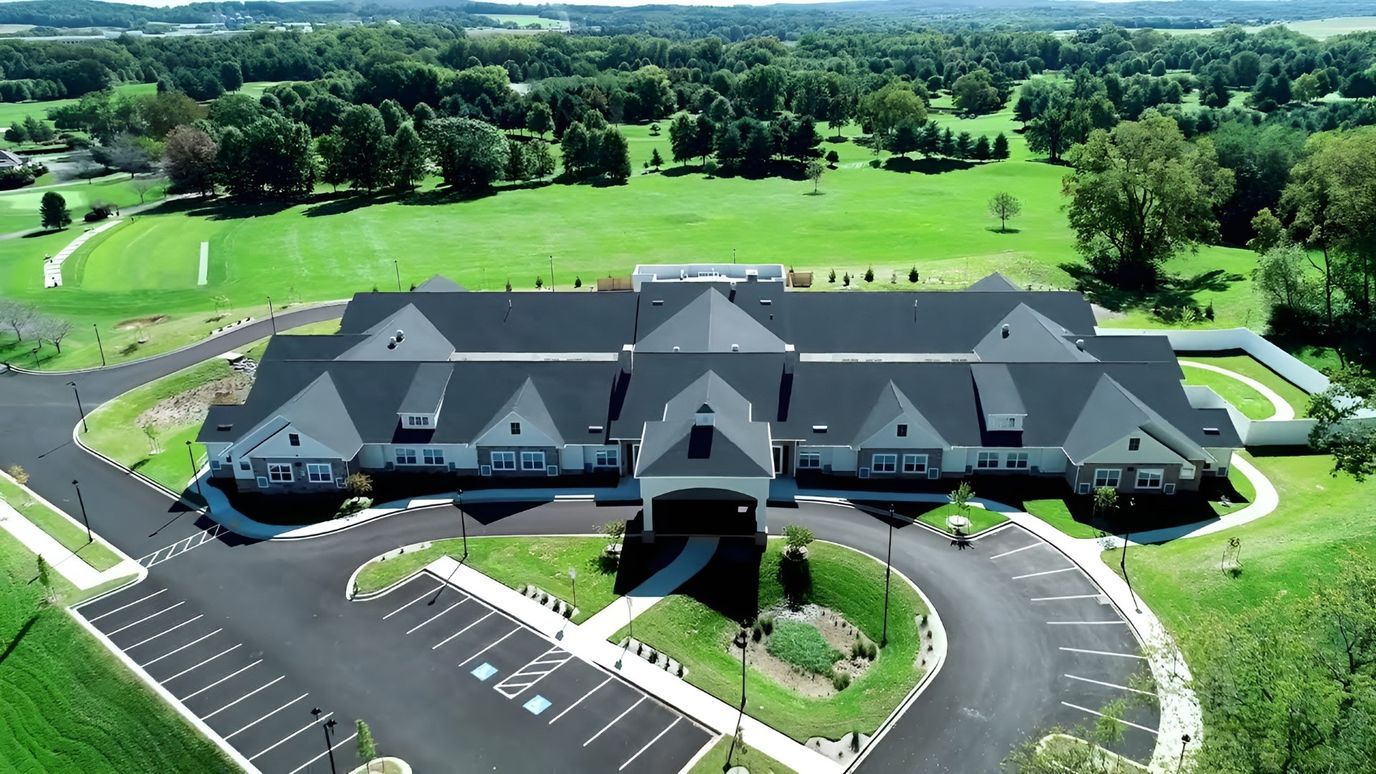
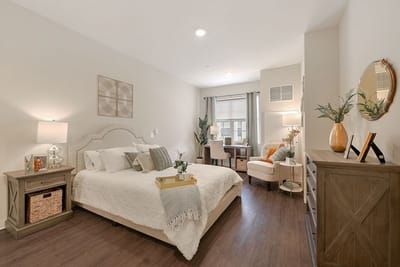
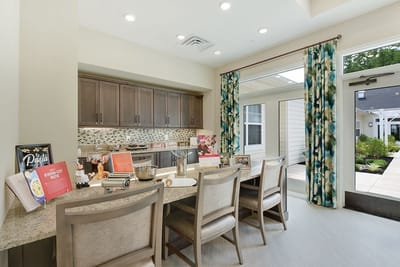
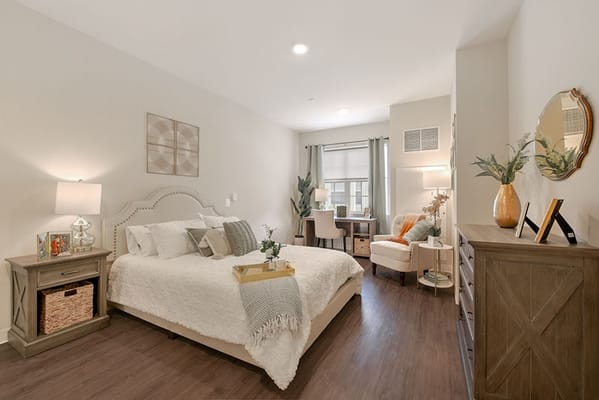
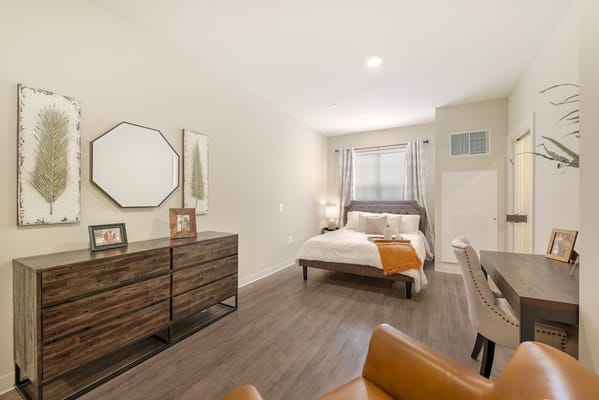
Silverado in Frederick offers a home where seniors write a new story at the beginning of another chapter of their lives. Specializing in memory care, residents can immerse themselves in endless opportunities that enrich their holistic wellness. Management and staff are dedicated to encouraging and supporting its residents’ independence and individuality in a nurturing environment.
Silverado’s resort-style community boasts its quintessential services that essentially make the lives of each resident stress-free so seniors can pursue and continue their interests every day. Community features include amenities and services such as housekeeping, laundry, social events, recreational activities, fitness classes, medication management, and transportation.
72-bed community Rank #194 / 697Bed count — State benchmarkedThis home is ranked 194th out of 697 homes in Maryland. Shows this facility's certified or reported bed count compared to other Maryland SNFs. Larger communities may offer more amenities, programs, and on-site services for residents and families.Click the rank badge to see the full State ranking.Click here to see the full State ranking.
A moderately sized community that may balance personal attention with shared amenities and social activities.
3 years in operation Rank #201 / 208Years in operation — State benchmarkedThis home is ranked 201st out of 208 homes in Maryland. Shows how long this facility has been in operation compared to other Maryland SNFs. Longer operating histories may benefit residents, families, and staff.Click the rank badge to see the full State ranking.Click here to see the full State ranking.
An established community with some operational experience and growing routines.
Walk Score: 20 / 100 Rank #740 / 985Walk Score — State benchmarkedThis home is ranked 740th out of 985 homes in Maryland. Shows how walkable this facility's neighborhood is compared to the average Walk Score across Maryland SNFs. Higher scores benefit residents, families, and staff.Click the rank badge to see the full State ranking.Click here to see the full State ranking.
Car-dependent. Most errands require a car, with limited nearby walkable options.
About this community
Facility TypeAl
CountyFrederick
Profit StatusTrue
Private Room
$310 - $330 per day
Semi-Private Room
$265 - $285 per day
Hospice Affiliations
Staffing
Key information about the people who lead and staff this community.
No CNA training program
No Alzheimer's certification
Dedicated Alzheimer's Unit
Mild Alzheimer's Level
Moderate Alzheimer's Level
Severe Alzheimer's Level
What does this home offer?
Pets Allowed
Housing Options: Private Rooms / Semi-Private Rooms
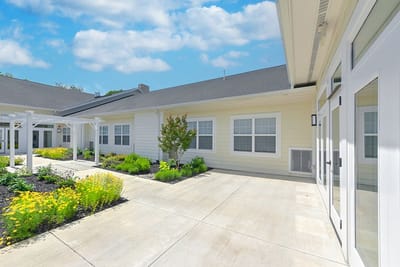
Building Type: Single-story
Fitness and Recreation
Private Rooms
Semi-Private Rooms
Places of interest near Silverado Frederick Memory Care Community
![]() 2.7 miles from city center
2.7 miles from city center
![]() Estimated distance in miles from Frederick's city center to Silverado Frederick Memory Care Community's address, calculated via Google Maps.
— 12.16 miles to nearest hospital (Frederick Health Mt Airy)
Estimated distance in miles from Frederick's city center to Silverado Frederick Memory Care Community's address, calculated via Google Maps.
— 12.16 miles to nearest hospital (Frederick Health Mt Airy)
Calculate Travel Distance to Silverado Frederick Memory Care Community
Add your location
Financial Assistance for
Assisted Living in Maryland
Silverado Frederick Memory Care Community is located in Frederick, Maryland.
Here are the financial assistance programs available to residents in Maryland.
Compare Assisted Living around Frederick
The information below is reported by the Maryland Department of Health, Office of Health Care Quality.
Filter by care type
| Spring Arbor of Frederick |
AL Assisted Living A licensed, long-term care setting for seniors or individuals with disabilities who need help with daily activities — like bathing, dressing, and medication management — but not 24-hour skilled nursing. Offers housing, meals, and around-the-clock support while aiming to maximize resident independence.
MC Memory Care Secured, specialized care for people living with Alzheimer's or dementia. Staff trained in cognitive impairment, with higher staff-to-resident ratios and an environment designed to reduce confusion and wandering risk. | Frederick (Ballenger Creek) | 115
Facility
115
MD AVG
44
Rank
#90 / 697 | Yes |
25
Facility
25
MD AVG
43
Rank
#684 / 985 | Private Rooms / Semi-Private Rooms | 7
Facility
7
MD AVG
21
Rank
#172 / 208 | - |
31% Male Residents — State Benchmarked 31% of residents are male, compared to the Maryland average of 31%. This facility caters to a majority female resident pool (69% female), consistent with the broader assisted living trend where women significantly outnumber men. |
69% Female Residents — State Benchmarked 69% of residents are female, compared to the Maryland average of 69%. Women comprise the large majority, consistent with national assisted living demographics where women live longer and enter care facilities at higher rates. |
96% White Residents — State Benchmarked 96% of residents are reported as White, compared to the Maryland average of 81%. A higher White share than is typical for assisted living in Maryland in this dataset — compare with peer facilities for local context. |
0% African American Residents — State Benchmarked 0% of residents are reported as African American or Black, compared to the Maryland average of 13%. A lower African American share than is typical in Maryland; local markets still vary widely. |
4% Other Ethnicity Residents — State Benchmarked 4% of residents fall into categories other than White or African American (combined), compared to the Maryland average of 6%. This column aggregates Hispanic, Asian, multiracial, and any other labeled groups that are not classified as White or African American. Reported subgroups in this total: Asian (4%). |
3% Residents Age 65–74 — State Benchmarked 3% of residents are 65–74, compared to the Maryland average of 13%. Fewer younger seniors suggests the resident population skews older, likely requiring higher acuity care and more hands-on support. |
39% Residents Age 75–84 — State Benchmarked 39% of residents are 75–84, compared to the Maryland average of 31%. A high concentration in this mid-range bracket, where residents typically need moderate support with daily activities. |
34% Residents Age 85–94 — State Benchmarked 34% of residents are 85–94, compared to the Maryland average of 44%. The population here skews younger than the statewide norm, which may indicate a more active, lower-acuity community. |
25% Residents Age 95+ — State Benchmarked 25% of residents are 95 or older, compared to the Maryland average of 16%. A high proportion of the oldest-old suggests strong end-of-life care experience and very-high-acuity capabilities. |
| Sunrise of Frederick |
AL Assisted Living A licensed, long-term care setting for seniors or individuals with disabilities who need help with daily activities — like bathing, dressing, and medication management — but not 24-hour skilled nursing. Offers housing, meals, and around-the-clock support while aiming to maximize resident independence.
MC Memory Care Secured, specialized care for people living with Alzheimer's or dementia. Staff trained in cognitive impairment, with higher staff-to-resident ratios and an environment designed to reduce confusion and wandering risk. | Frederick (Waterford) | 88
Facility
88
MD AVG
44
Rank
#167 / 697 | Yes |
62
Facility
62
MD AVG
43
Rank
#286 / 985 | Private Rooms / Semi-Private Rooms | 45
Facility
45
MD AVG
21
Rank
#4 / 208 | A- |
31% Male Residents — State Benchmarked 31% of residents are male, compared to the Maryland average of 31%. This facility caters to a majority female resident pool (69% female), consistent with the broader assisted living trend where women significantly outnumber men. |
69% Female Residents — State Benchmarked 69% of residents are female, compared to the Maryland average of 69%. Women comprise the large majority, consistent with national assisted living demographics where women live longer and enter care facilities at higher rates. |
97% White Residents — State Benchmarked 97% of residents are reported as White, compared to the Maryland average of 81%. A higher White share than is typical for assisted living in Maryland in this dataset — compare with peer facilities for local context. |
2% African American Residents — State Benchmarked 2% of residents are reported as African American or Black, compared to the Maryland average of 13%. A lower African American share than is typical in Maryland; local markets still vary widely. |
2% Other Ethnicity Residents — State Benchmarked 2% of residents fall into categories other than White or African American (combined), compared to the Maryland average of 6%. This column aggregates Hispanic, Asian, multiracial, and any other labeled groups that are not classified as White or African American. Reported subgroups in this total: Hispanic (2%). |
10% Residents Age 65–74 — State Benchmarked 10% of residents are 65–74, compared to the Maryland average of 13%. Fewer younger seniors suggests the resident population skews older, likely requiring higher acuity care and more hands-on support. |
34% Residents Age 75–84 — State Benchmarked 34% of residents are 75–84, compared to the Maryland average of 31%. This is the second most common age bracket in assisted living, representing residents with moderate care needs. |
48% Residents Age 85–94 — State Benchmarked 48% of residents are 85–94, compared to the Maryland average of 44%. This is typically the most common age bracket in assisted living — this facility is in line with the statewide norm. |
6% Residents Age 95+ — State Benchmarked 6% of residents are 95 or older, compared to the Maryland average of 16%. Most residents here have not yet reached the oldest-old bracket, suggesting a younger overall community. |
| Silverado Frederick Memory Care Community |
AL Assisted Living A licensed, long-term care setting for seniors or individuals with disabilities who need help with daily activities — like bathing, dressing, and medication management — but not 24-hour skilled nursing. Offers housing, meals, and around-the-clock support while aiming to maximize resident independence.
MC Memory Care Secured, specialized care for people living with Alzheimer's or dementia. Staff trained in cognitive impairment, with higher staff-to-resident ratios and an environment designed to reduce confusion and wandering risk.
RC Respite Care Short-term temporary care — days to weeks — to give family caregivers a break. Full care provided during the stay. Often used after hospitalization or to trial a facility before a permanent placement decision. | Frederick | 72
Facility
72
MD AVG
44
Rank
#194 / 697 | Yes |
20
Facility
20
MD AVG
43
Rank
#740 / 985 | Private Rooms / Semi-Private Rooms | 3
Facility
3
MD AVG
21
Rank
#201 / 208 | - | - | - | - | - | - | - | - | - | - |
| HeartFields Assisted Living at Frederick |
AL Assisted Living A licensed, long-term care setting for seniors or individuals with disabilities who need help with daily activities — like bathing, dressing, and medication management — but not 24-hour skilled nursing. Offers housing, meals, and around-the-clock support while aiming to maximize resident independence.
MC Memory Care Secured, specialized care for people living with Alzheimer's or dementia. Staff trained in cognitive impairment, with higher staff-to-resident ratios and an environment designed to reduce confusion and wandering risk.
RC Respite Care Short-term temporary care — days to weeks — to give family caregivers a break. Full care provided during the stay. Often used after hospitalization or to trial a facility before a permanent placement decision. | Frederick (Dearbought) | 52
Facility
52
MD AVG
44
Rank
#225 / 697 | Yes |
52
Facility
52
MD AVG
43
Rank
#402 / 985 | Private Rooms / Semi-Private Rooms | 27
Facility
27
MD AVG
21
Rank
#61 / 208 | - |
26% Male Residents — State Benchmarked 26% of residents are male, compared to the Maryland average of 31%. This facility caters to a majority female resident pool (74% female), consistent with the broader assisted living trend where women significantly outnumber men. |
74% Female Residents — State Benchmarked 74% of residents are female, compared to the Maryland average of 69%. Women comprise the large majority, consistent with national assisted living demographics where women live longer and enter care facilities at higher rates. |
93% White Residents — State Benchmarked 93% of residents are reported as White, compared to the Maryland average of 81%. A higher White share than is typical for assisted living in Maryland in this dataset — compare with peer facilities for local context. |
7% African American Residents — State Benchmarked 7% of residents are reported as African American or Black, compared to the Maryland average of 13%. In line with the Maryland average for African American residents among facilities reporting this breakdown. |
0% Other Ethnicity Residents — State Benchmarked 0% of residents fall into categories other than White or African American (combined), compared to the Maryland average of 6%. This column aggregates Hispanic, Asian, multiracial, and any other labeled groups that are not classified as White or African American. |
10% Residents Age 65–74 — State Benchmarked 10% of residents are 65–74, compared to the Maryland average of 13%. Fewer younger seniors suggests the resident population skews older, likely requiring higher acuity care and more hands-on support. |
26% Residents Age 75–84 — State Benchmarked 26% of residents are 75–84, compared to the Maryland average of 31%. Below the state norm — the resident mix may skew either younger or older than this typical middle bracket. |
48% Residents Age 85–94 — State Benchmarked 48% of residents are 85–94, compared to the Maryland average of 44%. This is typically the most common age bracket in assisted living — this facility is in line with the statewide norm. |
17% Residents Age 95+ — State Benchmarked 17% of residents are 95 or older, compared to the Maryland average of 16%. In line with the statewide profile for the oldest resident bracket. |
| Somerford House & Place Frederick |
AL Assisted Living A licensed, long-term care setting for seniors or individuals with disabilities who need help with daily activities — like bathing, dressing, and medication management — but not 24-hour skilled nursing. Offers housing, meals, and around-the-clock support while aiming to maximize resident independence.
MC Memory Care Secured, specialized care for people living with Alzheimer's or dementia. Staff trained in cognitive impairment, with higher staff-to-resident ratios and an environment designed to reduce confusion and wandering risk.
RC Respite Care Short-term temporary care — days to weeks — to give family caregivers a break. Full care provided during the stay. Often used after hospitalization or to trial a facility before a permanent placement decision. | Frederick (Whittier) | 52
Facility
52
MD AVG
44
Rank
#225 / 697 | Yes |
40
Facility
40
MD AVG
43
Rank
#523 / 985 | Private Rooms / Semi-Private Rooms | 25
Facility
25
MD AVG
21
Rank
#83 / 208 | - |
21% Male Residents — State Benchmarked 21% of residents are male, compared to the Maryland average of 31%. This facility caters to a majority female resident pool (79% female), consistent with the broader assisted living trend where women significantly outnumber men. |
79% Female Residents — State Benchmarked 79% of residents are female, compared to the Maryland average of 69%. Women comprise the large majority, consistent with national assisted living demographics where women live longer and enter care facilities at higher rates. |
90% White Residents — State Benchmarked 90% of residents are reported as White, compared to the Maryland average of 81%. A higher White share than is typical for assisted living in Maryland in this dataset — compare with peer facilities for local context. |
0% African American Residents — State Benchmarked 0% of residents are reported as African American or Black, compared to the Maryland average of 13%. A lower African American share than is typical in Maryland; local markets still vary widely. |
10% Other Ethnicity Residents — State Benchmarked 10% of residents fall into categories other than White or African American (combined), compared to the Maryland average of 6%. This column aggregates Hispanic, Asian, multiracial, and any other labeled groups that are not classified as White or African American. Reported subgroups in this total: Mixed Race (4%), Other (4%), Hispanic (2%). |
13% Residents Age 65–74 — State Benchmarked 13% of residents are 65–74, compared to the Maryland average of 13%. In line with the statewide profile for this youngest senior bracket in assisted living. |
44% Residents Age 75–84 — State Benchmarked 44% of residents are 75–84, compared to the Maryland average of 31%. A high concentration in this mid-range bracket, where residents typically need moderate support with daily activities. |
23% Residents Age 85–94 — State Benchmarked 23% of residents are 85–94, compared to the Maryland average of 44%. The population here skews younger than the statewide norm, which may indicate a more active, lower-acuity community. |
15% Residents Age 95+ — State Benchmarked 15% of residents are 95 or older, compared to the Maryland average of 16%. In line with the statewide profile for the oldest resident bracket. |
More homes from the same operator
Operated by
Silverado Senior Living
Frequently Asked Questions about Silverado Frederick Memory Care Community
Is Silverado Frederick Memory Care Community in a walkable area?
Silverado Frederick Memory Care Community has a walk score of 20. Car-dependent. Most errands require a car, with limited nearby walkable options.
How many beds does Silverado Frederick Memory Care Community have?
Silverado Frederick Memory Care Community has 72 beds.
Are there photos of Silverado Frederick Memory Care Community?
Yes — there are 5 photos of Silverado Frederick Memory Care Community in the photo gallery on this page.
What is the phone number of Silverado Frederick Memory Care Community?
(866) 522-8125 will put you in contact with the team at Silverado Frederick Memory Care Community.
What county is Silverado Frederick Memory Care Community located in?
Silverado Frederick Memory Care Community is in Frederick County.
Is Silverado Frederick Memory Care Community Medicare or Medicaid certified?
Silverado Frederick Memory Care Community is not currently listed as a CMS-certified provider of Medicare or Medicaid.
Guides for Better Senior Living
Care Cost Calculator: See Prices in Your Area
Nursing Home Data Explorer
Don’t Wait Too Long: 7 Red Flag Signs Your Parent Needs Assisted Living Now
The True Cost of Assisted Living in 2025 – And How Families Are Paying For It
Understanding Senior Living Costs: Pricing Models, Discounts & Financial Assistance
Contact Us

Published on
Updated on
Feedback
Write a review for Silverado Frederick Memory Care Community
Rate your overall experience with this community
Explore Open Rooms
1
Contact details
2
What type of senior care service are you looking for?
3
What budget do you have in mind for senior care?
4
How soon do you need to find care?
5
Additional details
Thank you for your interest!
Our team will be in touch shortly to help with next steps.
Need Help?
Let us help you or a loved one find the perfect senior home.
